Abstract
We revealed that nucleation sites within collagen fibrils determined pathways for calcium phosphate (CaP) nucleation and its transformation, from amorphous species to crystalline plates, during the biomineralization process. Using in situ small-angle X-ray scattering (SAXS), we examined the nucleation and growth of CaP within collagen matrices and elucidated how a nucleation inhibitor, polyaspartic acid (pAsp), governs mineralization kinetics and pathways at multiple length scales. Mineralization without pAsp led initially to spherical aggregates of CaP in the entire extrafibrillar spaces. With time, the spherical aggregates transformed into plates at the outermost surface of the collagen matrix, preventing intrafibrillar mineralization inside. However, mineralization with pAsp led directly to the formation of intrafibrillar CaP plates with a spatial distribution gradient through the depth of the matrix. The results illuminate mineral nucleation kinetics and real-time nanoparticle distributions within organic matrices in solutions containing body fluid components. Because the macroscale mechanical properties of collagen matrices depend on their mineral content, phase, and arrangement at the nanoscale, this study contributes to better design and fabrication of biomaterials for regenerative medicine.
Graphical abstract
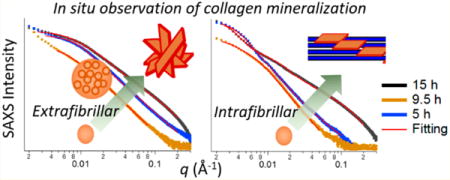
INTRODUCTION
Mammalian mineralized tissues are natural composites of fibrillar collagen proteins1,2 and calcium phosphate (CaP) nanocrystals.3–5 The combination of a compliant component (collagen) with relatively stiff inclusions (CaP crystals) provides a wide range of tissue-level mechanical properties.6–8 This range includes stiff (but brittle) tooth enamel, made mostly of mineral,3,5 and partially mineralized tendon-to-bone attachments with high toughness.7,9,10 Type I collagen molecules self-assemble into a fibril with a periodic 67 nm banded pattern.1,2 There are 40 nm gap zones between neighboring collagen molecules, providing nucleation sites for intrafibrillar mineralization (IM).4,11,12 Stabilization of prenucleation clusters (PNCs) is essential to IM by inhibiting CaP nucleation in extrafibrillar spaces (extrafibrillar mineralization, EM).11,13–15 In addition to physiologically existing noncollagenous proteins (NCPs), such as fetuin,11,13 polyaspartic acid (pAsp) has been shown to promote IM during the in vitro mimicking of collagen mineralization.11,12,16 Controlling the nucleation sites and kinetics using EM inhibitors, such as pAsp, can be an effective approach to achieving targeted mechanical properties of both individual collagen fibrils at the nanometer scale and tissue constructs at the millimeter scale.
Previous nanoscale observations relied on snapshot images of debris16 or selected cross sections from matrices17 or individual fibrils,11 typically focusing on late in vitro mineralization events. These studies required extensive sample preparation procedures prior to imaging or were limited to cryogenic sample environments,11,16,17 and so could not fully explore the in situ kinetics of nucleation and growth of CaP, which involve a dynamic sequence of morphological changes with phase transformations. The phase transformations include amorphous CaP phases as important intermediate products.15,18–22 To understand the mineralization of tissue-level scaffolds, the spatial distribution of CaP within millimeter-sized collagen matrices needs to be evaluated from the nanoscale, as mineral crystals nucleate and grow within collagen fibrils,11 through the macroscale, where mineral crystals are widely distributed in the extrafibrillar spaces between collagen fibrils arranged within the matrix.17,23 Prior approaches have not provided continuous real-time information on the spatial distribution of CaP within a collagen matrix over these length scales. Without in situ kinetic evaluation of mineral nucleation and growth, and of the spatial distribution of the mineral crystals at multiple length scales, a precise design of CaP-stiffened collagen matrices cannot be achieved.
Studies utilizing synchrotron X-ray techniques have revealed important aspects of bone and bioengineered materials.18,24–28 Recent studies have provided full three-dimensional reconstruction of collagen fiber orientation in a human trabecula bone and tooth, using small-angle X-ray scattering (SAXS) with tensor tomography.29,30 However, in situ nucleation kinetics during collagen mineralization have not been evaluated despite their importance in governing the chemical and mechanical properties of organic-nanocrystal composites. Here, using SAXS, we provide in situ investigations31,32 of CaP development (i.e., its morphology and distribution) within reconstituted collagen matrices under the influence of pAsp, which controls the nucleation kinetics of CaP in extrafibrillar space.11,12,33 This evaluation of the temporal development of CaP demonstrates different pathways for intra- and extrafibrillar mineralization. The macroscale spatial distributions of CaP nanocrystals in different stages emphasize the role of the extrafibrillar spaces of the collagen matrices in transport of nucleation and growth precursors during tissue mineralization.
EXPERIMENTAL SECTION
The Experimental Section in the Supporting Information (SI) provides full details of the preparation of samples and simulated body fluid, and descriptions of the flow-through reactor, in situ X-ray scattering data collection and analysis, and ex situ analyses of collagen mineralization.
Preparation of Samples
Collagen matrices were reconstituted from Type I collagen34 (C857, calf skin lyophilized, Elastin Products Company, Inc.) in a specially designed polytetrafluoroethylene (PTFE) frame (Figure 1a). The cover glass on both sides of the frame held the solution and collagen, and also allowed X-ray penetration during the SAXS analysis. The frame was 2 mm thick in the direction of the X-ray path. To reconstitute the lyophilized collagen in a well-controlled shape with uniform thickness for the SAXS evaluations, a collagen fibrillar density of 12 mg mL−1 was used. With this collagen fibrillar density, we were able to observe both intra- and extrafibrillar mineralization behaviors clearly in the mineralization solution. In addition, thin collagen films were prepared on glass slides to simulate the reactions at the outermost surface of collagen matrices. CaP structures formed during collagen mineralization were compared with synthetic hydroxyapatite (ACROS Organics).
Figure 1.
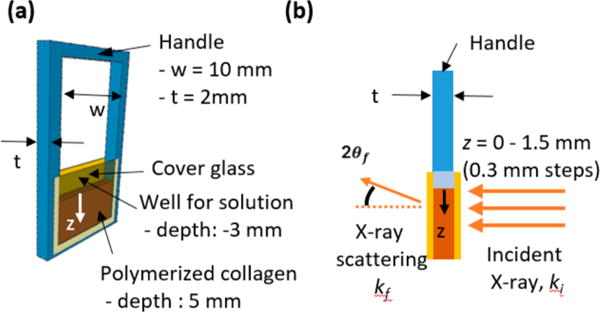
(a) Design of custom-made sample frame containing collagen matrix between two cover glasses, with an indication of the z-direction. (b) Experimental setup for SAXS measurements. ki and kf are the incident and scattered wave vectors, respectively, and 2θf is the exit angle of the X-rays. SAXS measurements were taken at different positions of the matrix along the z-direction from 0 (the interface between the SBF and collagen matrix) to 1.5 mm, with 0.3 mm steps.
Simulated Body Fluid and the Flow-through Reactor
To simulate physiologically relevant conditions, while conducting our experiments within a reasonable time, a simulated body fluid (SBF)35,36 with three times higher concentrations of calcium and phosphate ions (3×SBF, pH 7.25) was used as an experimental solution (Table S1). Either 0 or 10 mg L−1 of polyaspartic acid, pAsp (sodium salt, Mw: 5000 Da, LANXES) was added to the solution, depending on the experimental condition. To prevent any precipitation prior to the experiment, the 3×SBF solutions containing either Ca or P sources were prepared separately and then combined just before the reaction, using a syringe pump (Figure S1a). The reactor was maintained at 37 ± 1 °C.
In Situ X-ray Scattering Data Collection and Analysis
SAXS data were collected at the Advanced Photon Source (APS, Sector 12 ID-B, Figure S1b) at Argonne National Laboratory (Argonne, IL, USA).31,32 At intervals of 5, 9.5, and 15 h, frames were immediately moved to the SAXS sample stage and scanned from z = 0–1.5 mm depth of the matrix (Figure 1b). The distance from the sample to the SAXS detector was 3.6 m, which provided a range of 0.0017–0.53 Å−1 for the scattering vector, q. For each scan, the sample was exposed to a 14 keV X-ray beam for 1 s. The size of the beam was 150 μm (perpendicular to the z-direction) × 40 μm (parallel to the z-direction). Two different lateral positions were scanned at each time for duplicated samples; therefore, a total of four scattering patterns were obtained for each condition and position. Control SAXS intensities were acquired for unmineralized scenarios and used to define the background intensity (Figure S2). The procedures for the data analysis are described in the SI Experimental Section in detail.37–41
Similarly, in situ wide-angle X-ray scattering (WAXS) analysis was conducted at APS sector 11-ID-B to identify the CaP phases during collagen mineralization (q > 0.6 Å−1). Samples were exposed to a 58.66 keV X-ray beam (size: 300 μm × 300 μm) for 5 min for the data collection.
Ex Situ Analyses of Collagen Mineralization
Thin sections (100 nm) of the collagen matrices were prepared for TEM analysis. Matrices were fixed in 100 mM cacodylate buffer containing 2% paraformaldehyde and 2.5% glutaraldehyde, followed by dehydration in successive ethanol baths. Then samples were embedded in epoxy resin, and thin sections were prepared using an ultramicrotome (EM UC7, Leica). Osmium tetroxide, uranyl acetate, and Reynold’s lead citrate were used for staining for TEM imaging if needed. Two different instruments were used for TEM imaging. A JEOL 1200 EX II was operated at 100 kV, and a JEOL JEM-2100F was operated at 200 kV for higher resolution images.
Collagen matrices and films were analyzed by Raman spectroscopy (inVia Raman spectrometer, Renishaw plc) and scanning electron microscopy (SEM) equipped with energy-dispersive X-ray spectroscopy (EDS) (FEI Nova NanoSEM 2300). Samples were stored in an ethanol bath for more than 5 h to remove excess ions after mineralization. The matrices were then frozen in liquid nitrogen and cut into ∼1 mm thick sections (Figure S6a).
Fluorescence correlation spectroscopy (FCS) was used to evaluate the extrafibrillar pore structures of the matrices by measuring the diffusion time of rhodamine 6G (R6G).42 We used an inverted design confocal laser scanning microscope (Zeiss Axiovert 200M) equipped with a 40× water immersion lens and a 514 nm argon laser. Fluorescence intensities were collected for 30 s × 10 times, and then the diffusion time, τD, was evaluated by analyzing correlation curves.43
RESULTS AND DISCUSSION
SAXS Analysis of CaP Development within Collagen Matrices
An overview of the influence of pAsp on CaP development can be seen from invariant values which are proportional to the total volume of newly formed CaP particles with the same morphology and structure at a given time.31,44 Invariant values, Q, are expressed as Q = (1/2π2)∫ q2I(q) dq, where I(q) is the scattering intensity at the scattering vector, q.37 As shown in Figure 2a, for mineralized collagen matrices without pAsp (MC0p), Q increased monotonically up to 15 h, without any variation in the spatial distribution at z = 0.3–1.5 mm. However, the outermost surface of the matrix (z = 0) showed Q values at 15 h more than twice as high as those of other positions, with a statistically significant difference (Figures 2b and S3a). In contrast, CaP formation was strongly hindered until 9.5 h in the matrices mineralized with the addition of 10 mg L−1 pAsp (MC10p) as a nucleation inhibitor.11,45 With pAsp, interestingly, a clear gradient in CaP distribution, with statistically significant differences, was observed throughout the depth of the matrix at 15 h, demonstrating a direct relationship between the proximity of the SBF–matrix interfaces and CaP formation (Figures 2c and S3b).
Figure 2.
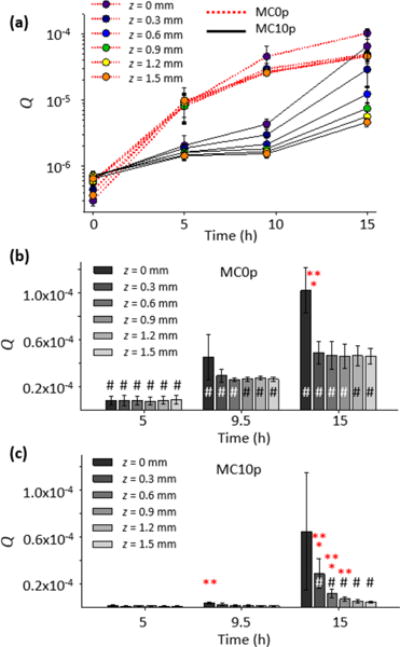
(a) Spatiotemporal development of CaP within collagen matrix, observed from the invariant, Q, derived from the integration of SAXS intensities. The background intensity from unmineralized collagen matrices was subtracted from the SAXS intensities. (b, c) Statistical analysis of Q values from MC0p and MC10p, using a three-factor analysis of variance and post hoc t tests. The asterisk symbols * and ** indicate that an averaged Q has a significant difference (p < 0.05) compared to the next and second next z-positions, respectively. A sharp symbol # indicates a significant difference compared to a measurement at previous time interval.
The analysis of individual SAXS patterns provided detailed information on the evolution of CaP population and morphology.37,38 All SAXS profiles at 5–9.5 h, regardless of the spatial position or inclusion of pAsp, had similar patterns with short plateaus at small q, followed by a linear decrease in intensity (Figure 3). Those SAXS patterns can be fit using the global unified scattering function, I(q) = G exp(−q2Rg2/3) + Bq−P, to estimate the radius of gyration, Rg, from Guinier’s law, and the power-law scattering exponent, P, from the slope at linear power-law regimes.37 In the absence of pAsp (MC0p), the power-law scattering with an exponent of P ≈ 3 is observed, which indicates the existence of fractal structures. For mass fractal structures, such as loosely packed aggregates, P equals the fractal dimension Df.46 The power-law is terminated at the lower q side by the Guinier type of scattering, indicating that the fractal structure is finite in size. Combining these observations, we modeled this structure as a spherical (isometric shape, Df = 3) aggregate with a fractal inner structure. Nonisometric objects, such as cylinder or disk, would show a power-law slope less steep than −3, and a fractal nature (either mass or surface) or surface roughness would reduce the slope further. From the model, the size and population of the aggregates can be determined. The scattering intensity from this population increased with time at all z positions, which resulted in a clear increase in the volume fraction of spherical aggregates within the matrix (Vsp, Figure 4a).
Figure 3.
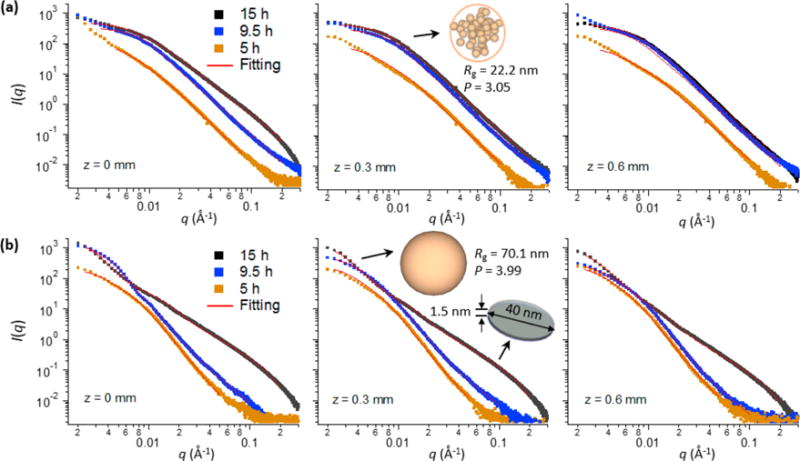
SAXS patterns from collagen matrices and their fittings. SAXS patterns from MC0p (a) and MC10p (b) over time at z = 0–0.6 mm, and their fittings. The SAXS patterns fit one or two CaP populations with morphologies of spherical aggregates, compact spheres, or plates. For example, the SAXS pattern at z = 0.3 mm of MC0p at 15 h fits spherical aggregates (Rg = 22.2 nm and P = 3.05), and the corresponding pattern of MC10p fits a combination of compact spheres (Rg = 70.1 nm and P = 3.99, at small q) and plates (diameter = 40 nm with a standard deviation of 0.15 in log-normal distributions and thickness = 1.5 nm, at large q).
Figure 4.
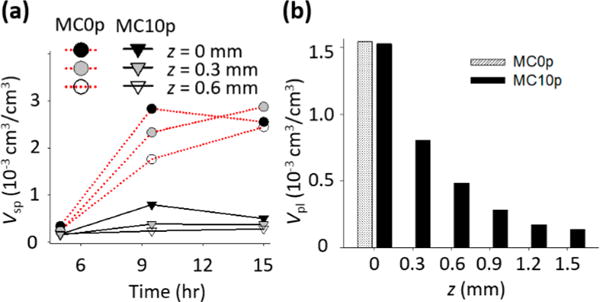
(a) Volume fractions of CaP populations with spherical morphologies, Vsp, at 5–15 h and (b) volume fractions of plate-like shapes, Vpl, at 15 h, determined from fittings of SAXS patterns. No plate-like shape particles were identified from SAXS patterns of MC0p below 0.3 mm. The volume fractions of each particle population were estimated by calibrating I(q) using a glassy carbon reference sample.
The intensities at high q for 15 h of mineralization showed typical SAXS patterns for plate-like objects (the slope at q around 0.01–0.1 Å−1 is about −2, Porod scattering appears at q above 0.2 Å−1),15,38 both for samples mineralized with pAsp (at all z positions) and without pAsp (only at z = 0). These data can be fit using a specific form factor and size distribution function (SI Experimental Section eqs S4–S7). In the MC0P system, a population of plates was observed only at the SBF– MC0p interface (z = 0) at 15 h (Figure 3a), showing a sudden, but significant, volume fraction of plates at that location (Vpl, Figure 4b). Contrarily, populations of plates developed at all z-positions of the MC10p samples at 15 h, with decreasing Vpl along the z-direction (Figures 3b and 4b). The morphology of these plates (a thickness of 1.5 nm and mean diameter of 40 nm) was comparable to widely accepted dimensions for apatite crystals in mature bone (∼2.1 × 30 × 40 nm3).7,14 A similar thickness, though slightly thinner than that of crystals in mature bone, was reported from a SAXS pattern of octacalcium phosphate-like plates (∼1.4 nm),15 and most bone crystals observed were less than 2 nm thick.5,47 In our observations, CaP plates developed from both MC0p and MC10p had almost identical thicknesses, and the thickness of plates was uniform along the z-directions of MC10p. Another population of spheres, following Porod’s law (P ≈ 4), was also observed in MC10p samples, demonstrating that this population was not formed by aggregation of smaller precursors but consisted of individual compact spherical particles (Figures 3b and S3d,e). In addition, Vsp was significantly lower in MC10p samples than in MC0p samples, without showing a clear increasing trend over time until the development of plate-like crystals (Figure 4a).
The three different populations of particles with dissimilar morphologies and size ranges observed by in situ SAXS analysis in this study show that CaP developments in intra- and extrafibrillar spaces undergo different pathways, although both pathways include 1.5 mm thick plates at 15 h. The following discussion describes how those pathways are determined by the nucleation inhibitor, pAsp, and how they consequently influence the mineralization patterns of tissue-level constructs.
Distinctively Different Pathways for CaP Mineralization in the Intra- and Extrafibrillar Spaces of Collagen Matrices
A TEM image of thin sections of MC0p indicated that CaP developed primarily in extrafibrillar spaces. At 15 h of mineralization, aggregated thin plates (dashed circle and inset image in Figure 5a) were imaged near z = 0, around unmineralized collagen fibrils (black arrow in Figure 5a) showing brighter contrast than the embedding epoxy resin. On the other hand, CaP development with 10 mg L−1 pAsp (MC10p) represents an IM-dominant system, showing darker contrasts from collagen fibrils than the surrounding epoxy resin (white arrow in Figure 5b). The different mineralization patterns resulting from pAsp were also evaluated from the thin collagen films on glass slides after 15 h of mineralization (Figure 6). This process simulated reactions at the outermost surface of the matrices (z = 0), which were not imaged from thin sections cut along the z-direction. In the absence of pAsp, the collagen surface was mostly covered with micrometer scale spheres, consisting of a number of nanoscale plates (Figure 6a). The Raman spectra from these spheres is similar to that of synthetic hydroxyapatite, with a clear phosphate peak at Δ960 cm−1 (the P–O band for apatite, Figure 6d). This peak indicates CaP formed during the mineralization without pAsp (Figure 6a), but the spectrum does not include peaks from collagen fibrils. On the other hand, individual fibrils were clearly mineralized by the addition of 10 mg L−1 pAsp (Figure 6b, the atomic percentages of Ca and P by SEM-EDS were 21.4 and 16.6, respectively) losing their periodic patterns shown in the unmineralized fibrils (Figures 5c and 6c). In Raman spectra, peaks indicating both apatite (at Δ960 cm−1 for the P–O band) and collagen (at Δ2941 cm−1 for the C–H band) clearly appeared (Figure 6d). Similar Raman spectra have been frequently reported from partially mineralized tendons or bone samples.9,10 Ca/P molar ratios of EM and IM in this study were 1.19 and 1.29. Those numbers are slightly lower than the theoretical value of octacalcium phosphate (1.33), which are expected to appear during the early stage CaP development process.15
Figure 5.
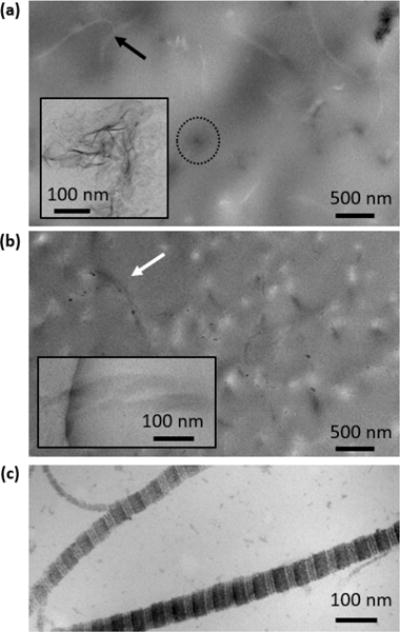
TEM images of thin sections of collagen matrices. (a) Near the outer surface (z = 0) of a MC0p sample at 15 h. The black arrow indicates an unmineralized collagen fibril. The dashed circle surrounds an aggregate of extrafibrillar CaP plates. The inset is a high resolution TEM image of extrafibrillar CaP plates, corresponding to the features in the circle. (b) Near the outer surface (z = 0) of the MC10p at 15 h. The higher magnification inset is taken from a neighboring area of the sample. Collagen fibrils, indicated with a white arrow, are mineralized, showing darker contrast than the surrounding epoxy resin. No staining was applied to collagen fibrils for (a) and (b) because precipitates from staining cannot easily be distinguished from CaP particles formed within the matrices. (c) Stained unmineralized collagen fibrils demonstrated a clear banding pattern of collagen fibrils.
Figure 6.
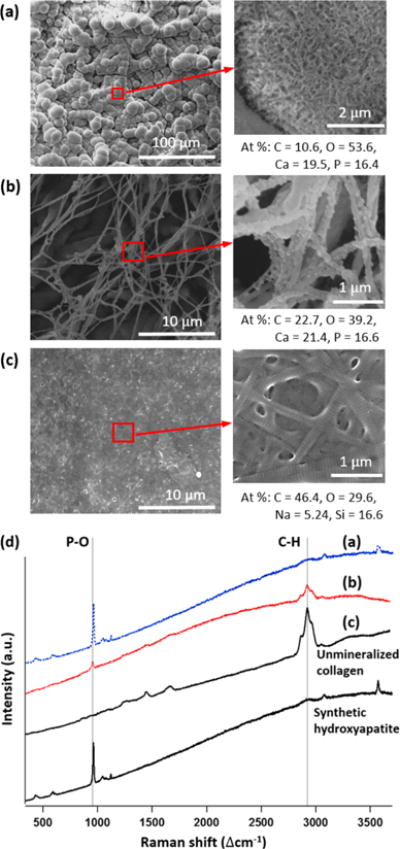
(a–c) SEM images of collagen films on glass. (a) Mineralized for 15 h in 3 × SBF without pAsp. (b) Mineralized for 15 h in 3×SBF with 10 mg L−1 pAsp. (c) Unmineralized collagen. (d) Raman spectra of (a–c) and synthetic hydroxyapatite for comparison.
On the basis of ex situ observations (Figures 5 and 6), we concluded that the addition of 10 mg L−1 pAsp effectively controlled the IM and EM patterns. This control allowed us to evaluate the nucleation kinetics and pathways for both mineralization processes separately, using in situ SAXS observations. To better evaluate the different nucleation kinetics and pathways during both mineralization processes and to thoroughly investigate this complex system, we simplified the system to use one type and concentration of pAsp (10 mg L−1 of 5000 Da pAsp).
From the SAXS analyses during EM (MC0p), we found a CaP population of spherical aggregates (Figure 3a, P ≈ 3) as intermediate products. This finding is consistent with a CaP nucleation pathway without collagen fibrils in the absence of nucleation inhibitors, as observed in recent cryogenic studies of CaP formation.15,20 These studies showed that amorphous CaP spheres formed via aggregation and densification of PNCs before transformation into plate-like morphologies with increased crystallinity. The diameters of the densified aggregates in prior reports were 30–80 nm,15,20 consistent with the SAXS results of the current study (Rg = 20.5–32.3 nm, equivalent to a diameter = 52.9–83.4 nm, Figure S3f). A decreasing pattern in Rg over time can be evidence of the CaP pathway of the densification of ionic clusters as nucleation precursors.
During the CaP development with pAsp (MC10p), plate-like crystals (akin to the shape of bone apatite crystals) formed without an intermediate phase of spherical aggregates (between 9.5 and 15 h, Figure 3b), and this showed that the pathway of CaP development for IM is clearly distinguished from that for EM. This new finding also indicates that CaP transformation to plates for IM is much faster (once nucleation occurs) than for EM. In the absence of pAsp, it took 15 h for the transformation of spherical aggregates to plates in the extrafibrillar spaces, and this transformation was observed only at the top surface of the matrix (Figure 3a). Therefore, the inhibition of CaP nucleation at the extrafibrillar spaces by pAsp allows the nucleation in the intrafibrillar spaces, and during this IM process, CaP takes a new pathway, which is faster in its transformation but slower in nucleation than EM process.
Similarly, in situ WAXS data show that crystalline structure of CaP developed faster in MC10p than in MC0p (Figure S4). The WAXS pattern clearly shows peaks (corresponding to the (002), (211), and (112) faces of hydroxyapatite) developed in MC10p after 20 h. When CaP developed in the extrafibrillar structure (MC0p), only the (002) peak appeared, indicating that more amorphous or poorly crystalline states persisted for a longer period. This finding supports our SAXS observation that the morphological transformation from spherical aggregates to plates in MC0p was maintained for a relatively longer period (compared to the direct development of plates after the incubation time in MC10p) and was limited to only the outermost surface.
On the other hand, the spherical population observed for MC10p (Compact spherical particles, P ≈ 4) does not seem to be directly related to plates, due to its large size (Rg = 47–71 nm, Figure S3f) and much lower Vsp than Vpl (Figure 4a,b). Instead, CaP spheres might develop from aqueous Ca-pAsp complexation in the extrafibrillar space.13 However, the SAXS patterns that are fitted to compact spheres had minimal influence on the fitting of plate-like crystals (Figure S3d), validating that plate-like CaP developed without any intermediate products.
In situ SAXS and WAXS observations indicate that nanoscale evaluations of amorphous CaP phase are critical to thoroughly understand the kinetics and pathways of CaP nucleation and its phase transformation. This study highlights the importance of in situ X-ray scattering applications for future studies on the early stage collagen mineralization.
Macroscale Spatial Distribution of CaP Nanocrystals
Despite the importance of collagen fibrillar structure on tissue mineralization, as suggested in recent studies,17,48,49 the role of extrafibrillar space, which can be an important entryway for molecules required for the CaP mineralization, has been neglected in most studies. Therefore, researchers have often not connected the implications from in vitro findings to those found in vivo. The spatial distribution of CaP as a function of the distance from the SBF–matrix interface explored in this study is especially important for understanding how molecules, such as PNCs or Ca2+ ions, are delivered from the SBF to the inside of the matrix to form CaP plates. The occupation of extrafibrillar pores with CaP (Figures 5a and 6a) could influence the transport of those molecules within the matrix by limiting their diffusion.42
To examine this possibility, the diffusion time, τD, of rhodamine 6g (R6G) was evaluated using fluorescence correlation spectroscopy (Figure 7a). τD at z = 0 was about three times higher than at other positions in MC0p at 15 h, indicating that a diffusion of molecules decreased, especially at the SBF–matrix interface, and further prevented nucleation precursors from penetrating into the deeper positions of the matrix. The increased diffusion time corresponds to the SAXS observation that the increase in scattering intensity from MC0p became mild at z = 0.3–1.5 mm (Figure 2a). In consequence, a thin layer of aggregated plates formed on the outer surface of MC0p in a later stage, as clearly imaged using TEM (Figures 7b and S5a–c). These aggregated plates filled the extrafibrillar space less than 0.2 mm deep from the top surface, but they were scarcely observed at deeper z-positions. This layer could be a diffusion barrier for the further nucleation in deeper positions of MC0p. Ex situ analyses of matrices’ sections using SEM and Raman spectroscopy demonstrated that IM was not achieved in MC0p even after the additional 23 h mineralization period, showing clearly distinguishable features between the extrafibrillar CaP layer and collagen matrix (Figure S6 and Table S2).
Figure 7.
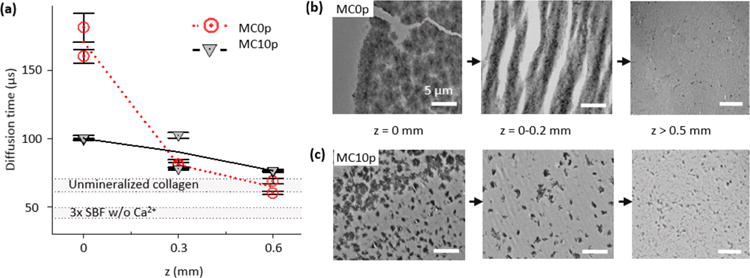
Reduced diffusion of R6G during the early stage (within 15 h) of extrafibrillar mineralization results in a nucleation barrier in a later stage of collagen mineralization (after additional 23 h). (a) Diffusion times of R6G into MC0p and MC10p at different depths after 15 h of mineralization. The average and standard deviation were obtained from 10 measurements at each scanning position. Two different positions were scanned at the same depth. Diffusion times in unmineralized collagen matrix and simulated body fluid without Ca2+ are also indicated as gray regions for the comparison. (b, c) Spatial distributions of CaP within MC0p (b) and MC10p (c) systems at the late stage of the mineralization were influenced by the reduced diffusion of molecules required for the CaP mineralization from SBF solution into the deeper positions of the matrices. After an initial 15 h of mineralization, for in situ SAXS analysis, TEM images of thin sections were taken after an additional 23 h incubation in 3 × SBF. Scale bars are 5 μm.
On the other hand, the increase in τD after mineralization in MC10p was relatively low compared to MC0p (Figure 7a), demonstrating that neither the occupation of extrafibrillar spaces by CaP crystals nor the influence of the intrafibrillar CaP plate on the extrafibrillar space was significant, allowing scattering intensities to increase with a relatively steep slopes at low z positions of MC10p (Figure 2a). Therefore, CaP plates can form more deeply in the matrices even at z = 1.5 mm (Figure 4b). The extrafibrillar CaP crystals in MC10p were visible only at the later stage, showing elongated morphologies in the micrometer scale (Figures 7c and S5d–f). Unlike in MC0p, extrafibrillar CaP crystals were not severely aggregated (corresponding to different P values for spherical populations in MC0p and MC10p, Figure S3e) and did not significantly occupy the extrafibrillar spaces except for a few areas at z = 0 (Figure 7c).
Kinetic Control of CaP Nucleation for Tissue-Level Mineralization
The proposed mechanisms of CaP development in collagen matrices are described in Figure 8. In the absence of a nucleation inhibitor, spherical aggregates form in extrafibrillar spaces, in a fashion similar to CaP developing in solution.15,20 Initially, CaP precursors, such as PNCs or other ionic Ca and P species, move freely within the matrix through the relatively large extrafibrillar spaces, nucleating in the extrafibrillar spaces with little z-position dependency. This population of spherical aggregates grows continuously, filling the extrafibrillar spaces while reducing the diffusion of precursors penetrating deeper into the matrix. Over time, spherical aggregates require continuously bond with Ca2+ from the solution and transform into crystalline plates,15 but this dominantly occurs only at the solution–matrix interface (Figure 4b). These aggregated plates eventually become dense enough to create a diffusion barrier at the later stage (Figure 7b), inhibiting the transport of precursors to the inside of the matrix and preventing further mineralization throughout its depth.
Figure 8.
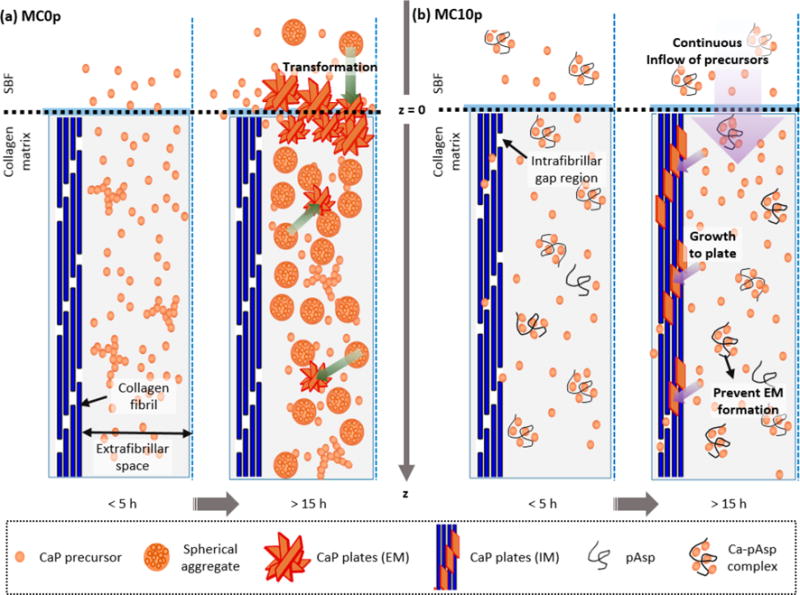
Mechanisms of (a) extrafibrillar mineralization within collagen matrices in the absence of pAsp (MC0p) and (b) intrafibrillar mineralization of collagen fibrils in the presence of pAsp (MC10P).
In the presence of a nucleation inhibitor (representing the physiologically relevant case), the nucleation of CaP in extrafibrillar spaces is kinetically restricted by aqueous complexation of Ca2+ ions with inhibitors. Thus, PNCs or other CaP precursors can be continuously supplied to collagen gap channels before they are consumed for EM or blocked by a diffusion barrier. The confined space of narrow gap channels (40 nm wide, but less than 2 nm high2,5,6) does not allow for the formation of large aggregates; hence, nuclei can directly grow as plates without the intermediate step of spherical aggregates, as observed in MC0P. When ionic precursors do not form aggregated clusters due to the inhibition by pAsp, the activation energy barrier for creating new surfaces for nucleation of CaP in extrafibrillar spaces cannot be overcome easily.15 Therefore, about 9.5 h of induction time was required before the initial development of CaP plates. Once nucleation occurs within the gap channels, however, CaP nuclei strongly attract precursors and begin to grow into plates. This pathway results in a faster morphological transformation (Figure 3) and crystallization (Figure S4) than the pathway with intermediate spherical aggregates in the absence of pAsp. The consumption of precursors by nuclei for IM cause the delivery of fewer precursors to deeper z-positions; therefore, intrafibrillar CaP plates develop with a gradual spatial distribution.
CONCLUSIONS
In summary, we evaluated the kinetics of mineralization of collagen matrices at nano- through macroscales, using in situ SAXS analysis. The evolution of CaP’s morphology and its volume size distribution were separately determined during nucleation and growth within intra- and extrafibrillar spaces. The findings of this study revealed that the pathways and kinetics of CaP development during intrafibrillar mineralization are distinctively different from those during extrafibrillar CaP mineralization. In the absence of nucleation inhibitors, improper control of CaP nucleation kinetics brought significant CaP populations of spherical aggregates in the extrafibrillar spaces. This highlights the importance of including nucleation inhibitors for recreating physiologically relevant mineralization of collagen-based matrices.11,12
In situ SAXS measurement at the different z-positions utilized in this study has a number of practical benefits. For example, we were able to detect unexpected layers that clearly formed at the outermost surface (z = 0), which disrupts the preparation of biomaterials with a uniform mineral distribution in macroscale. The quantitative information showing gradual development of plate-like crystals along the z-positons can be adapted to evaluate the kinetic parameters, such as the diffusion coefficients of precursor molecules for the nucleation of biominerals in biological templates. Furthermore, because the distribution of CaP minerals relative to collagen, at both nano and macroscales, dictates the mechanics of the tissue,7,8 the current results provide guidance for proper mineralization of scaffolds for creating in vitro model systems and for developing constructs for regenerative medicine.
Supplementary Material
Acknowledgments
The authors acknowledge the Biomineralization discussion group at Washington University in St. Louis, consisting of J. D. Pasteris, G. Genin, T. Daulton, A. Deymier, A. G. Schwartz, J. Lipner, and J. Boyle for helpful discussions. We thank J. Ballard for carefully reviewing the manuscript. The project was mainly supported by Y.S.J.’s faculty startup fund at Washington University and partially supported by the National Science Foundation (DMR-1608545 and DMR-1608554) and the National Institutes of Health (U01 EB016422). The Nano Research Facility, Institute of Materials Science & Engineering, Molecular Microbiology Imaging Facility, Confocal Microscopy Facility, and Soft Nanomaterials Laboratory at Washington University in St. Louis provided their facilities for the experiments. Use of the Advanced Photon Source (sector 12 ID-B and 11ID-B) at Argonne National Laboratory was supported by the U.S. Department of Energy, Office of Science, Office of Basic Energy Sciences, under Contract No. DE-AC02-06CH11357.
Footnotes
Supporting Information
The Supporting Information is available free of charge on the ACS Publications website at DOI: 10.1021/acs.cgd.6b00864.
Full details of Experimental Section. Background SAXS intensities and additional SAXS patterns and their fittings from mineralized collagen matrices. WAXS patterns from mineralized collagen matrices. Characterizations of sections of collagen matrices (TEM and SEM images and Raman spectra) (PDF)
Notes
The authors declare no competing financial interest.
References
- 1.Hodge AJ, Petruska JA. In: Aspects of Protein Structure. Ramachandran GN, editor. Academic Press; New York, NY: 1963. pp. 289–300. [Google Scholar]
- 2.Orgel JPRO, Irving TC, Miller A, Wess TJ. Proc Natl Acad Sci U S A. 2006;103:9001–9005. doi: 10.1073/pnas.0502718103. [DOI] [PMC free article] [PubMed] [Google Scholar]
- 3.Glimcher M. J Rev Mineral Geochem. 2006;64:223–282. [Google Scholar]
- 4.Landis W, Jacquet R. Calcif Tissue Int. 2013;93:329–337. doi: 10.1007/s00223-013-9725-7. [DOI] [PubMed] [Google Scholar]
- 5.Pasteris JD, Wopenka B, Valsami-Jones E. Elements. 2008;4:97–104. [Google Scholar]
- 6.Alexander B, Daulton TL, Genin GM, Lipner J, Pasteris JD, Wopenka B, Thomopoulos S. J R Soc, Interface. 2012;9:1774–1786. doi: 10.1098/rsif.2011.0880. [DOI] [PMC free article] [PubMed] [Google Scholar]
- 7.Liu Y, Thomopoulos S, Chen C, Birman V, Buehler MJ, Genin GM. J R Soc Interface. 2014;11 doi: 10.1098/rsif.2013.0835. [DOI] [PMC free article] [PubMed] [Google Scholar]
- 8.Nair AK, Gautieri A, Chang S-W, Buehler MJ. Nat Commun. 2013;4:1724. doi: 10.1038/ncomms2720. [DOI] [PMC free article] [PubMed] [Google Scholar]
- 9.Schwartz AG, Pasteris JD, Genin GM, Daulton TL, Thomopoulos S. PLoS One. 2012;7:e48630. doi: 10.1371/journal.pone.0048630. [DOI] [PMC free article] [PubMed] [Google Scholar]
- 10.Wopenka B, Kent A, Pasteris JD, Yoon Y, Thomopoulos S. Appl Spectrosc. 2008;62:1285–1294. doi: 10.1366/000370208786822179. [DOI] [PMC free article] [PubMed] [Google Scholar]
- 11.Nudelman F, Pieterse K, George A, Bomans PHH, Friedrich H, Brylka LJ, Hilbers PAJ, de With G, Sommerdijk NAJM. Nat Mater. 2010;9:1004–1009. doi: 10.1038/nmat2875. [DOI] [PMC free article] [PubMed] [Google Scholar]
- 12.Olszta MJ, Cheng X, Jee SS, Kumar R, Kim Y-Y, Kaufman MJ, Douglas EP, Gower LB. Mater Sci Eng, R. 2007;58:77–116. [Google Scholar]
- 13.Heiss A, DuChesne A, Denecke B, Grötzinger J, Yamamoto K, Renné T, Jahnen-Dechent W. J Biol Chem. 2003;278:13333–13341. doi: 10.1074/jbc.M210868200. [DOI] [PubMed] [Google Scholar]
- 14.Landis WJ, Song MJ, Leith A, McEwen L, McEwen BF. J Struct Biol. 1993;110:39–54. doi: 10.1006/jsbi.1993.1003. [DOI] [PubMed] [Google Scholar]
- 15.Habraken WJEM, Tao J, Brylka LJ, Friedrich H, Bertinetti L, Schenk AS, Verch A, Dmitrovic V, Bomans PHH, Frederik PM, Laven J, van der Schoot P, Aichmayer B, de With G, DeYoreo JJ, Sommerdijk NAJM. Nat Commun. 2013;4 doi: 10.1038/ncomms2490. [DOI] [PubMed] [Google Scholar]
- 16.Jee SS, Culver L, Li Y, Douglas EP, Gower LB. J Cryst Growth. 2010;312:1249–1256. [Google Scholar]
- 17.Wang Y, Azaïs T, Robin M, Vallée A, Catania C, Legriel P, Pehau-Arnaudet G, Babonneau F, Giraud-Guille M-M, Nassif N. Nat Mater. 2012;11:724–733. doi: 10.1038/nmat3362. [DOI] [PubMed] [Google Scholar]
- 18.Betts F, Posner AS. Mater Res Bull. 1974;9:353–360. [Google Scholar]
- 19.Combes C, Rey C. Acta Biomater. 2010;6:3362–3378. doi: 10.1016/j.actbio.2010.02.017. [DOI] [PubMed] [Google Scholar]
- 20.Dey A, Bomans PH, Müller FA, Will J, Frederik PM, Sommerdijk NA. Nat Mater. 2010;9:1010–1014. doi: 10.1038/nmat2900. [DOI] [PubMed] [Google Scholar]
- 21.Mahamid J, Aichmayer B, Shimoni E, Ziblat R, Li C, Siegel S, Paris O, Fratzl P, Weiner S, Addadi L. Proc Natl Acad Sci U S A. 2010;107:6316–6321. doi: 10.1073/pnas.0914218107. [DOI] [PMC free article] [PubMed] [Google Scholar]
- 22.Posner AS, Betts F. Acc Chem Res. 1975;8:273–281. [Google Scholar]
- 23.Landis WJ, Hodgens KJ, Song MJ, Arena J, Kiyonaga S, Marko M, Owen C, McEwen BF. J Struct Biol. 1996;117:24–35. doi: 10.1006/jsbi.1996.0066. [DOI] [PubMed] [Google Scholar]
- 24.Campi G, Ricci A, Guagliardi A, Giannini C, Lagomarsino S, Cancedda R, Mastrogiacomo M, Cedola A. Acta Biomater. 2012;8:3411–3418. doi: 10.1016/j.actbio.2012.05.034. [DOI] [PubMed] [Google Scholar]
- 25.Campi G, Fratini M, Bukreeva I, Ciasca G, Burghammer M, Brun F, Tromba G, Mastrogiacomo M, Cedola A. Acta Biomater. 2015;23:309–316. doi: 10.1016/j.actbio.2015.05.033. [DOI] [PubMed] [Google Scholar]
- 26.Fratzl P, Fratzl-Zelman N, Klaushofer K, Vogl G, Koller K. Calcif Tissue Int. 1991;48:407–413. doi: 10.1007/BF02556454. [DOI] [PubMed] [Google Scholar]
- 27.Fratzl P, Groschner M, Vogl G, Plenk H, Eschberger J, Fratzl-Zelman N, Koller K, Klaushofer K. J Bone Miner Res. 1992;7:329–334. doi: 10.1002/jbmr.5650070313. [DOI] [PubMed] [Google Scholar]
- 28.Fratzl P, Schreiber S, Klaushofer K. Connect Tissue Res. 1996;34:247–254. doi: 10.3109/03008209609005268. [DOI] [PubMed] [Google Scholar]
- 29.Liebi M, Georgiadis M, Menzel A, Schneider P, Kohlbrecher J, Bunk O, Guizar-Sicairos M. Nature. 2015;527:349–352. doi: 10.1038/nature16056. [DOI] [PubMed] [Google Scholar]
- 30.Schaff F, Bech M, Zaslansky P, Jud C, Liebi M, Guizar-Sicairos M, Pfeiffer F. Nature. 2015;527:353–356. doi: 10.1038/nature16060. [DOI] [PubMed] [Google Scholar]
- 31.Jun Y-S, Lee B, Waychunas GA. Environ Sci Technol. 2010;44:8182–8189. doi: 10.1021/es101491e. [DOI] [PubMed] [Google Scholar]
- 32.Li Q, Fernandez-Martinez A, Lee B, Waychunas GA, Jun Y-S. Environ Sci Technol. 2014;48:5745–5753. doi: 10.1021/es405141j. [DOI] [PubMed] [Google Scholar]
- 33.Olszta MJ, Douglas EP, Gower LB. Calcif Tissue Int. 2003;72:583–591. doi: 10.1007/s00223-002-1032-7. [DOI] [PubMed] [Google Scholar]
- 34.Boyle JJ, Kume M, Wyczalkowski MA, Taber LA, Pless RB, Xia Y, Genin GM, Thomopoulos S. J R Soc Interface. 2014;11 doi: 10.1098/rsif.2014.0685. [DOI] [PMC free article] [PubMed] [Google Scholar]
- 35.Gamble JL. Chemical Anatomy Physiology and Pathology of Extracellular Fluid. 6th. Harvard University Press; Cambridge, MA: 1967. [Google Scholar]
- 36.Ohtsuki C, Kokubo T, Yamamuro T. J Non-Cryst Solids. 1992;143:84–92. [Google Scholar]
- 37.Beaucage G, Kammler HK, Pratsinis SE. J Appl Crystallogr. 2004;37:523–535. [Google Scholar]
- 38.Fratzl P. J Appl Crystallogr. 2003;36:397–404. [Google Scholar]
- 39.Ilavsky J, Jemian PR. J Appl Crystallogr. 2009;42:347–353. [Google Scholar]
- 40.Zhang F, Ilavsky J, Long G, Quintana JG, Allen A, Jemian P. Metall Mater Trans A. 2010;41:1151–1158. [Google Scholar]
- 41.Beaucage G. J Appl Crystallogr. 1995;28:717–728. [Google Scholar]
- 42.Kihara T, Ito J, Miyake J. PLoS One. 2013;8:e82382. doi: 10.1371/journal.pone.0082382. [DOI] [PMC free article] [PubMed] [Google Scholar]
- 43.Rigler R, Mets Ü, Widengren J, Kask P. Eur Biophys J. 1993;22:169–175. [Google Scholar]
- 44.Liu J, Pancera S, Boyko V, Shukla A, Narayanan T, Huber K. Langmuir. 2010;26:17405–17412. doi: 10.1021/la101888c. [DOI] [PubMed] [Google Scholar]
- 45.Tas AC. Acta Biomater. 2014;10:1771–1792. doi: 10.1016/j.actbio.2013.12.047. [DOI] [PubMed] [Google Scholar]
- 46.Li T, Senesi AJ, Lee B. Chem Rev. 2016 doi: 10.1021/acs.chemrev.5b00690. [DOI] [PubMed] [Google Scholar]
- 47.Eppell SJ, Tong W, Lawrence Katz J, Kuhn L, Glimcher MJ. J Orthop Res. 2001;19:1027–1034. doi: 10.1016/S0736-0266(01)00034-1. [DOI] [PubMed] [Google Scholar]
- 48.Cantaert B, Beniash E, Meldrum FC. Chem – Eur J. 2013;19:14918–14924. doi: 10.1002/chem.201302835. [DOI] [PMC free article] [PubMed] [Google Scholar]
- 49.Cantaert B, Beniash E, Meldrum FC. J Mater Chem B. 2013;1:6586–6595. doi: 10.1039/C3TB21296C. [DOI] [PMC free article] [PubMed] [Google Scholar]
Associated Data
This section collects any data citations, data availability statements, or supplementary materials included in this article.


