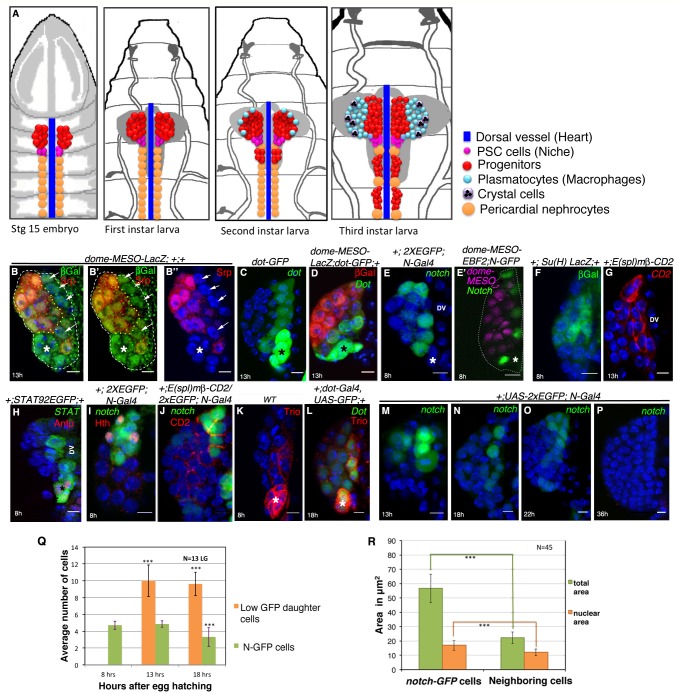
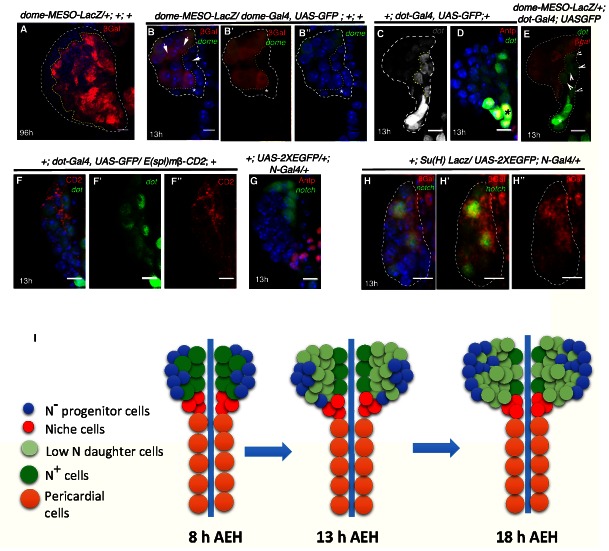
Figure 1. Presence of distinct cells in the first instar larval lymph glands of Drosophila that express several unique molecular markers.
(A) A schematic representation of lymph gland development throughout larval life. Red: progenitors; Magenta: niche cells; Blue: dorsal vessel (DV); orange: pericardial cells; light blue: plasmatocytes; purple with black crystals: Crystal cells. (B–B”) shows few Serpent (Srp; green) expressing cells (arrows) that lack domeless-MESO-LacZ (dome; red) expression in a first instar lymph gland. dome negative cells shown in white arrows are outlined by yellow dotted lines. Asterisk marks the niche. (C) dorothy-GFP (dot; green) expression is higher in the PSC compared to the cells that align near the dorsal vessel, but are negative for dome (red) expression in (D). Also see Figure 1—figure supplement 1E. (E–G) Expression of Notch alone (N; green; [E]), co-staining with domeless expressing progenitors (magenta, E') and its pathway components: Suppressor of hairless (Su(H); Green; F) and Enhancer of Split (E(spl); red; [G]) in the cells near the DV. (H) STAT92EGFP also expresses in these cells in addition to the PSC (red, Antp indicated by an asterisk). (I) A subset of N expressing cells (green) are positive for Homothorax, (hth; red) expression. (J) Overlap of E(spl) (red) and N (green; n = 10) expression. (K–L) indicate Trio (red) expression in the PSC (asterisks) and in cells near the dorsal vessel, which overlaps with dot-Gal4, UAS-GFP as evident in (L). (M–P) shows expression of N (green) in cells close to the DV during early first instars. Also see E and Figure 1—figure supplement 1I. This expression is hardly detectable beyond 22 hr AEH (O–P) (Q) Quantitative analysis of the number of N expressing cells with respect to time. Based on the fluorescence intensity estimation in (Figure 1—source data 1), number of N expressing cells and their daughter cells are 4.8 at 8 hr, 4.8 (p=0.635406062, two tailed unpaired Student’s t-test) and 10 (p=2.14882E-10, two tailed unpaired Student’s t-test) at 13 hr and 9.6 (p=1.01648E-11, two tailed unpaired Student’s t-test) and 3.3 (p=0.000754707, two tailed unpaired Student’s t-test) at 18 hr AEH respectively. (R) Quantitative estimation of the nuclear and total area of the N expressing cells with respect to neighboring cells. The total area of N expressing cells is 2.5 times (n = 45; p=8.50672E-29, two tailed unpaired Student’s t-test) and nuclear area is about 1.4 times (n = 45; p=1.68523E-11, two tailed unpaired Student’s t-test) greater than surrounding cells. Scale bar = 5 μm. Error bars=SD. Genotypes are shown on top of corresponding panels. DAPI marks the nucleus. Hours after larval hatching are as indicated in each panel. Also see Figure 1—figure supplement 1–2.


