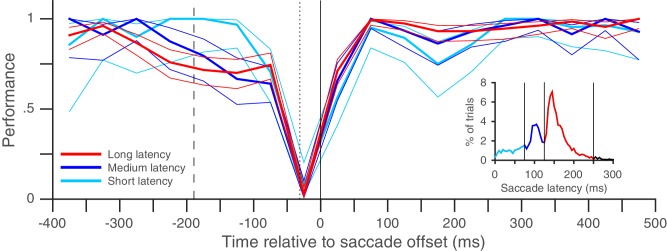
Figure 3. Rapid post-saccadic performance recovery is independent of saccade latency.
The time-course of recovery was indistinguishable for saccades in three different latency ranges in the same dataset used in Figure 2A (8 subjects, color coding in inset): 0–75 ms (predictive saccades), 75–125 ms (express saccades), 125–250 ms (regular-latency saccades). The inset plots the pooled saccade latency distribution. Figure conventions as in Figure 2A, except that non-overlapping 50 ms time-bins were used.
DOI: http://dx.doi.org/10.7554/eLife.18009.015

