

Supplemental Digital Content is available in the text
Keywords: body composition, body mass index, HIV, HIV wasting syndrome, obesity, waist circumference, weight-to-height ratio
Abstract
Examine body composition changes across the lifespan of HIV-infected compared to uninfected adults. Longitudinal study of antiretroviral therapy (ART)-treated HIV-infected and uninfected participants from the Multicenter AIDS Cohort Study and Women's Interagency HIV Study. Body mass index (BMI), waist (WC), hip circumference (HC), and waist-to-height ratio (WHtR) measured at semiannual visits from 1999 to 2014. The age effect on outcomes over time was investigated using multivariate, piecewise, linear mixed-effect regression models adjusted for demographics, substance use, and comorbidities. Person-visits from 2363 men (1059 HIV-infected/1304 HIV-uninfected) and 2200 women (1455 HIV-infected/745 HIV-uninfected), median ages 45 [IQR 39,51] and 40 [32,46], respectively, were included. BMI gains were slower among HIV-infected participants of 40 years or less (P < 0.001), similar between HIV-infected and uninfected persons 40 to 60 years of age, and plateaued after age 60 in both groups. WC and WHtR increased across the age spectrum (P < 0.001) regardless of HIV serostatus, with significantly greater gains in HIV-infected men more than 60. Black race and Hispanic ethnicity were associated with greater BMI and WC. Lower BMI, WC, hip circumference, and WHtR were associated with hepatitis C infection among women only, and with substance use among all participants, and with lower CD4+ cell count and shorter ART duration among HIV-infected participants. Slower BMI gain among younger HIV-infected adults may be partly explained by substance use and hepatitis C infection, and suggests that lower BMI does not represent improved health. Further analysis of muscle and fat abundance and quality will advance understanding of metabolic risk over the lifespan, a key to reducing morbidity in an aging population.
1. Introduction
Over the past 3 decades, the association of HIV infection with body composition has evolved from the initial manifestations of severe muscle wasting in the preantiretroviral therapy (ART) era, to lipodystrophy which was most prominent after the advent of highly active ART (HAART). Today, lipodystrophy is observed primarily among adults who have aged with HIV and were treated with older ART regimens, but it continues to occur even with contemporary ART regimens.[1] Longitudinal studies from the Fat Redistribution and Metabolic Changes in HIV (FRAM) Study, the Multicenter AIDS Cohort (MACS), and the Women's Interagency HIV Study (WIHS) have described some of these changes.[2–4] In FRAM, HIV-infected men and women had persistently lower subcutaneous adipose tissue over 5 years of follow-up compared to HIV-uninfected participants.[2] In the MACS and WIHS, a more rapid increase in the waist circumference (WC) or waist-to-hip ratio (WHR), but overall lower body mass index (BMI), were seen among HIV-infected men and women compared to uninfected but at-risk men and women from 1999 to 2004 [3,4]; these findings likely reflected lipoatrophy (loss of subcutaneous fat) overlying the pelvic girdle rather than increased abdominal adiposity (lipohypertrophy).
The term “return to health” weight gain was initially used to describe weight increases among profoundly immunocompromised individuals initiating ART following a period of weight loss. Weight gain with ART initiation continues to occur in the current ART era, however, despite relatively normal immune function and minimal pre-ART weight loss. A recent analysis in the Swiss HIV Cohort Study observed the most pronounced increase in weight during the first year after ART initiation, with an increase in the proportion of overweight or obese participants from 13% in 1990 to 38% in 2012.[5] In the WIHS cohort, 40% of normal weight women became overweight and 47% of overweight women became obese following ART initiation.[6] Cross-sectional studies of HIV-infected individuals have found rates of overweight or obesity as high as 65%.[7–10] Thus, generalized obesity among HIV-infected persons may mirror the general population, where nearly 35% of U.S adults are obese.[11] In the Military Natural History Study 60% of HIV-infected men and women gained weight over an average follow-up period of 6.2 years beginning in 1985, although less than 20% had an undetectable HIV-1 viral load.[7] In a south Texas cohort evaluated between 2007 and 2010, a quarter of HIV-infected persons (80% ART treated) were followed for a median of 3.25 years and had gains in BMI of over 3% per year.[12] The clinical significance of these weight changes was recently demonstrated in the Veterans Aging Cohort, where weight gain among underweight or normal-weight patients initiating ART had a beneficial effect on mortality, while no mortality benefit was seen with weight gain among overweight or obese individuals.[13] Furthermore, the impact of regional weight gain is less clear, as few studies have reported longitudinal imaging analyses. No prior studies have explored how these changes may vary by age.
The objectives of the present study were to describe the changes in BMI, WC, hip circumference (HC), and waist-to-height ratio (WHtR) that occur across the adult lifespan (from ages 18 to 75 years) of HIV-infected men and women on HAART; compare these changes to those in similar people without HIV infection; and determine factors associated with BMI, WC, HC, and WHtR trajectories. Identification of populations at high risk for gain or loss in these variables may guide age- and gender-specific obesity prevention programs and identify potential mechanisms for the body composition changes with aging.
2. Methods
2.1. Study population
The MACS and the WIHS are ongoing, multicenter, prospective cohort studies of the natural and treated histories of men and women, respectively, with or at risk for HIV infection in the United States. The MACS began in 1984, and has enrolled 7343 men from sites in Baltimore, MD/ Washington DC; Chicago, IL; Pittsburgh, PA; and Los Angeles, CA. The WIHS has enrolled 4,856 women since 1994, from sites in Atlanta, GA; Birmingham, AL; Bronx/Manhattan and Brooklyn, NY; Chapel Hill, NC; Chicago, IL; Jackson, MS; Los Angeles and San Francisco, CA; Miami, FL; and Washington, DC. Study design and participant characteristics of both studies have been described.[14–16] Each semiannual MACS and WIHS visit includes a physical examination, collection of blood for laboratory studies including CD4+ T cell count and plasma HIV-1 RNA determination, and completion of questionnaires that provide data on demographics, health status, and use of antiretroviral medications. Measurements of WC and HC were added to semi-annual visits beginning in 1999. The institutional review boards at each site approved study protocols and forms, and each participant provided written informed consent.
The current analysis included participants who were between ages 18 and 75 years, were receiving at least 2 ART agents with an HIV-1 RNA less than 400 copies/mL at baseline (for HIV-infected participants), and had at least 3 measurements of BMI, WC, and HC. Person-visits were excluded if BMI, WC, and HC were not measured, covariates of interest (alcohol use, smoking, marijuana and stimulant use, hepatitis B virus infection, hepatitis C virus infection, and depression) were not measured, or if the age of the participant at the visit was more than 75 years (see Supplementary material for a flow chart of participant selection).
2.2. Outcomes: BMI, WC, HC, WHtR
At each visit, BMI was determined by dividing the body weight (kilograms) by height (meters) squared, and categorized as underweight (<18.5), normal weight (18.5–24.9), overweight (25.0–29.9), and obese (≥ 30 kg/m2). WC and HC measurements from both cohorts were obtained in the standing position, using standardized procedures.[17] WHtR was calculated by dividing the WC by the height. All examiners underwent a standardized training.
2.3. Exposure: HIV status
All HIV-uninfected men and women were assessed for HIV positivity by ELISA. Positive results were confirmed by Western blot. Persons who seroconverted were included in the appropriate group because of and following seroconversion.
2.4. Covariates
Age was measured via self-reported date of birth and categorized into decades of age. Cigarette exposure was categorized as never, former, or current smoker; alcohol use was categorized as none, mild (1–3 drinks/week), moderate (4–13 drinks/week), or heavy (14 or more drinks/week). Education was categorized as ≤ high school, any college, or graduate school. Marijuana and stimulant (including cocaine or methamphetamine) use were dichotomized as any or no use within the prior 6 months. Hepatitis C infection was defined as a detectable hepatitis C RNA in serum, and hepatitis B virus infection as a positive hepatitis B virus surface antigen. Depressive symptoms were defined by a score of 16 or greater using the Center for Epidemiological Studies-Depression (CES-D) questionnaire.[18] Entry into the MACS or WIHS was dichotomized as before or after 2001. History of an acquired immunodeficiency syndrome (AIDS)-defining illness was measured according to the Centers for Disease Control and Prevention definition [19]; AIDS defined by a nadir CD4+ T-cell count less than 200 cells/μL was included as a separate variable. The definition of HAART was guided by the Department of Health and Human Services/Kaiser Panel guidelines.[20] Years from ART initiation was categorized as less than 5, 5 to 10, or more than 10 years.
2.5. Statistical analysis
To assess changes in body composition over time, multivariate, piecewise, linear mixed-effect regression models were implemented by employing the SAS PROC Mixed procedure (SAS Institute, Cary, NC). Separate models were constructed for each outcome (BMI, WC, HC, and WHtR). Our a priori hypothesis was that age modified the effect of treated HIV infection on our outcomes of interest. Covariates were selected based on statistically significant univariate associations with HIV status (P < 0.10) and literature review to identify potential confounders. The following covariates were included in the models: age at visit (as the time scale), HIV serostatus, an interaction term for age and HIV serostatus, race, cigarette exposure, alcohol use, marijuana and stimulant use, hepatitis B or hepatitis C infection, and depression. Additional variables were tested but not included in multivariate analyses as all P values were more than 0.10 in univariate analyses: enrollment into the MACS/WIHS before or after 2001; education; physical activity; cumulative use of zidovudine (ZDV), stavudine (D4T), lamivudine (3TC), or emtricitabine (FTC); nadir CD4+ T-cell count while under observation; and history of an AIDS-defining illness. Because the trajectories of outcomes across time were nonlinear, a spline term for age with knots at 40 and 60 years of age was used to allow for different outcomes over time in different age ranges. Different effects of baseline age and HIV serostatus on trajectories of outcomes were explored by using interactions. For HIV-infected participants, a separate model was built including HIV-related variables, CD4+ T cell count, and years from ART initiation.
These models were constructed to fit the data with random intercept allowing for individual differences at baseline visit, and random slope, reflecting individual rate of change over time (by age). Parameters including unstructured covariance of random coefficient and constant error variances, and the restricted maximum likelihood method were applied to estimate regression coefficients. The models accounted for correlation among repeated measurements from the same participants. These models provided estimates of the average rate of change of each outcome over time. P < 0.05 was considered as statistical significance for all of analyses. All statistical analyses were performed using SAS 9.4 (SAS Institute, Cary, NC).
3. Results
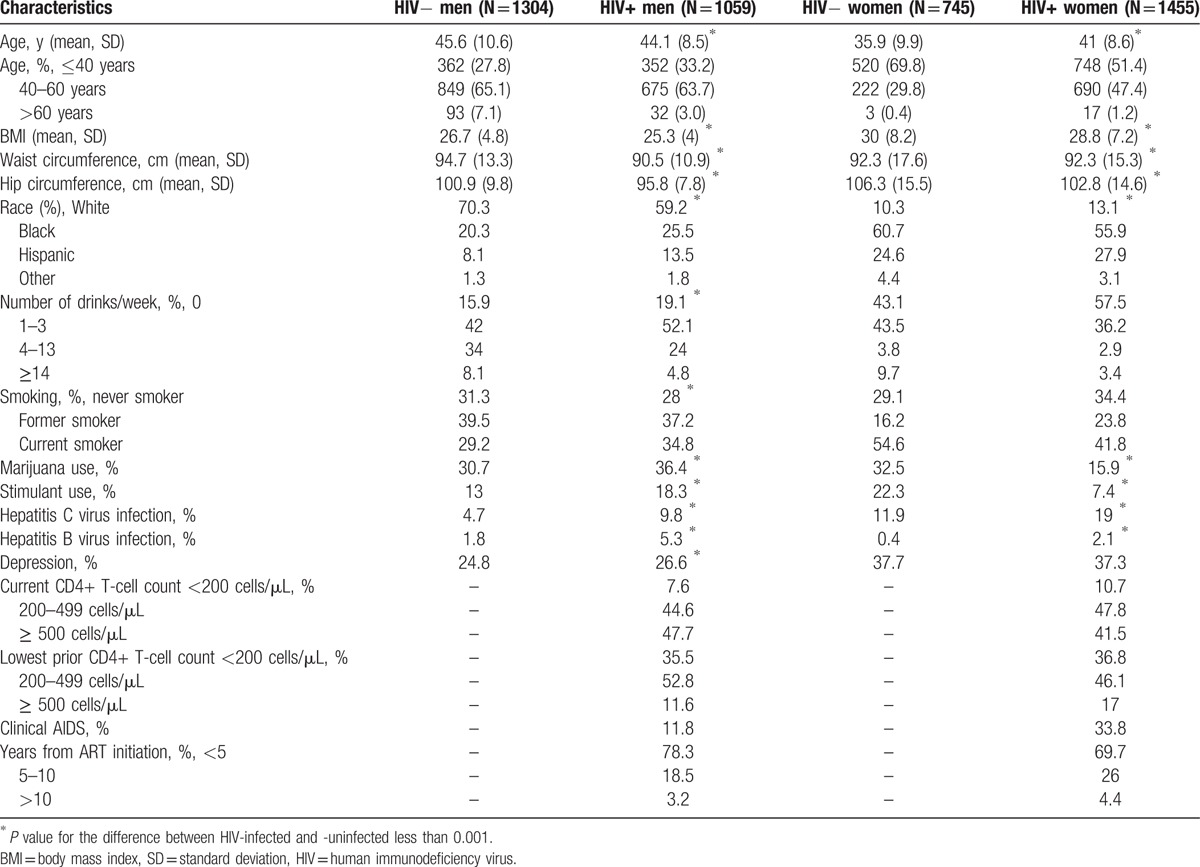
A total of 2363 men (1059 HIV-infected contributing 13,965 person visits, and 1304 HIV-uninfected contributing 20,652 visits) and 2200 women (1455 HIV-infected contributing 16,472 person-visits, and 745 HIV-uninfected contributing 11,763 person-visits) were included in the analyses; participant characteristics from the first available visit are detailed in Table 1. Briefly, HIV-infected men were younger and black, smoked cigarettes and used marijuana or stimulants, and had hepatitis B or C infection compared to HIV-uninfected men. In contrast, HIV-infected women were older, white, and/or Hispanic, less likely to smoke or consume alcohol, marijuana, or stimulants, but more had hepatitis B or C infection than HIV-uninfected women.
Table 1.
Baseline characteristics of study participants.
3.1. BMI, WC, HC, and WHtR Trajectories
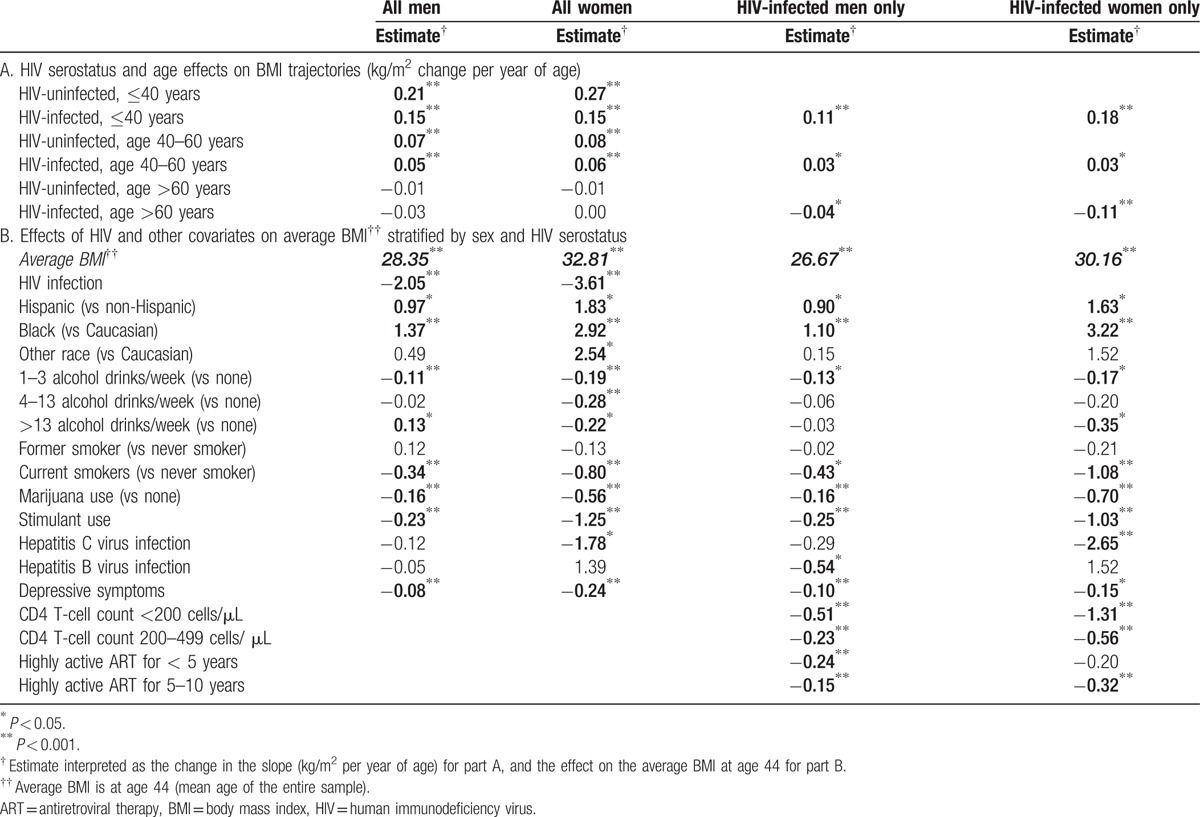
As shown in Fig. 1A, BMI increased significantly (P < 0.001) among both HIV-infected and HIV-uninfected men and women until 60 years of age, and then stabilized after age 60. Compared to HIV-uninfected men, HIV-infected men gained BMI significantly more slowly before age 40 (0.15 kg/m2/year in HIV-infected vs 0.21 kg/m2/year in HIV-uninfected; P < 0.001); yearly changes in BMI did not differ by HIV status after age 40 (Table 2A). Similar changes were seen among the women: BMI change differed by HIV serostatus only among those less than 40 years during which time HIV-uninfected women experienced nearly double the rate of BMI increase of HIV-infected women (0.15 kg/m2/year in HIV-infected vs 0.27 kg/m2/year in HIV-uninfected; <0.001). Similar changes by age were seen in models restricted to HIV-infected participants with further adjustment for HIV-specific variables (Table 2A) except that the decrease in BMI trajectory among women more than 60 years strengthened (from 0 to −0.11 kg/m2/year) and was statistically significant (P value <0.001; Table 2A).
Figure 1.
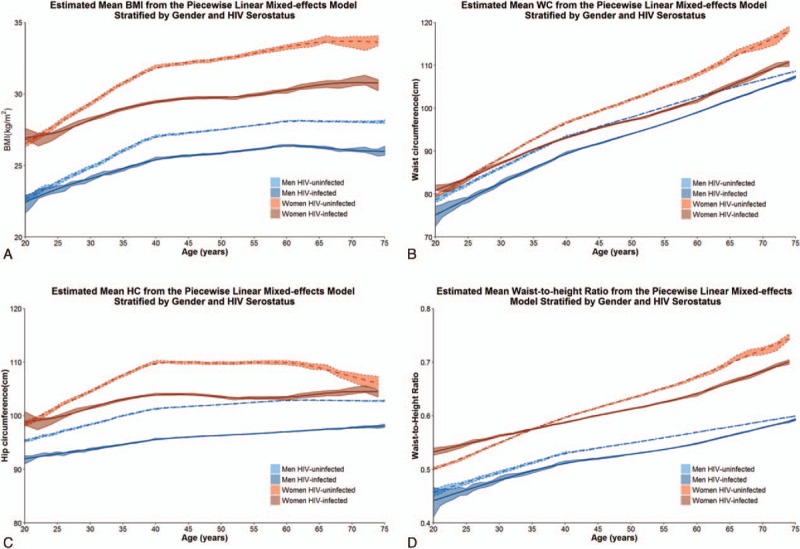
Mean body mass index (1A), waist circumference (1B), hip circumference (1C), and WHtR by age, estimated using multivariate piecewise linear mixed-effect regression models, and adjusted for age at visit, HIV infection on effective antiretroviral therapy, the interaction between age at visit and HIV infection on effective antiretroviral therapy, race, cigarette exposure, alcohol use, marijuana and stimulant use, hepatitis C and B viral infection, and depression. WHtR = waist-to-height ratio.
Table 2.
Effects on BMI by piecewise linear mixed-effects models, stratified by sex and HIV serostatus.
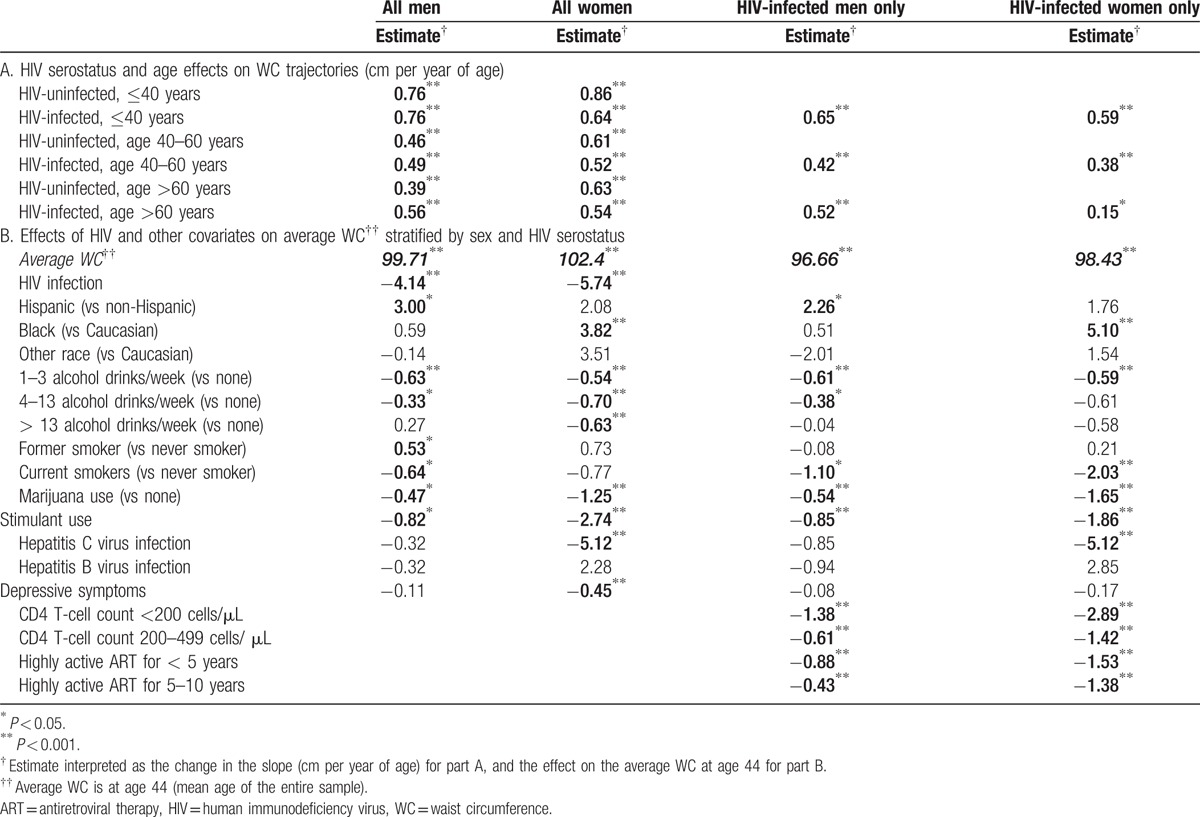
WC (Fig. 1B; Table 3A) increased among both men and women across each age category regardless of HIV serostatus (P <0.001). The increases in WC were similar between HIV-infected and -uninfected men until age 60; thereafter, HIV-infected men increased more rapidly (0.56 cm/y) compared to HIV-uninfected men (0.39 cm/y; P = 0.021). In contrast, the HIV-uninfected women of 40 years or less experienced a significantly greater gain in WC (0.86 cm/y) compared to HIV-infected women (0.64 cm/year; P = 0.002); no significant differences by HIV serostatus were seen in other age groups (P≥0.57). Similar changes were observed in analyses restricted to HIV-infected men and HIV-infected women.
Table 3.
Effects on WC by piecewise linear mixed-effects models, stratified by sex and HIV serostatus.
Small but significant increases in HC (Fig. 1C, Table 4A) were seen among men until age 60; these changes did not differ by HIV serostatus (P = 0.09 for age ≤ 40, P = 0.38 for age 40–60, and P = 0.12 for age >60). Women also had significant increases in HC until age 40, which were significantly greater among HIV-uninfected (0.57 cm/y) versus HIV-infected women (0.27 cm/y; P < 0.001). In models restricted to HIV-infected participants, similar changes in HC occurred among men; HC increased significantly in women up to age 40, and then decreased significantly after age 40 (P < 0.001; Table 4A).
Table 4.
Effects on HC by piecewise linear mixed-effects models, stratified by sex and HIV serostatus.

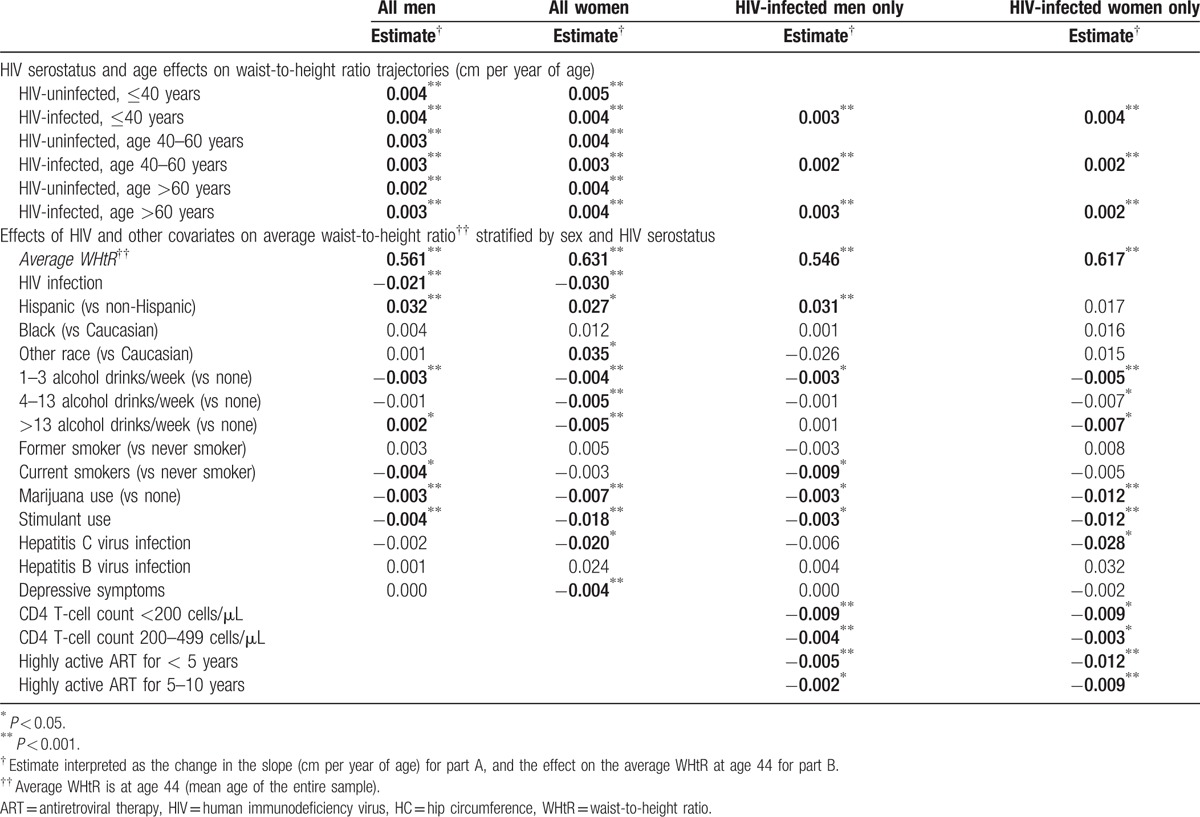
Change in WHtR were similar to the WC (Fig. 1D; Table 5A), and increased among both men and women across each age category regardless of HIV serostatus (all P < 0.001). Changes between HIV-infected and uninfected men were similar until age 60, when HIV-infected men experienced greater increases in WHtR (0.003/y vs 0.002/y, P = 0.020). In contrast, HIV-infected women experienced slower WHtR until age 40 (0.004/y vs 0.005/y, P = 0.005). Findings were similar in models restricted to HIV-infected participants.
Table 5.
Effects on waist-to-height ratio by piecewise linear mixed-effects models, stratified by sex and HIV serostatus.
3.2. Covariate effects on BMI, WC, HC, and WHtR at age 44, the mean age of the study population
The effects of covariates on BMI among men and women in multivariate analyses are shown in Tables Table 2B to 5B. Black race and Hispanic ethnicity were both associated with greater BMI; the association with WC was only seen among Hispanic men and black women, while the association with WHtR was seen among Hispanic, but not black, men and women. The association with HC was only seen among black men and women. Alcohol intake, marijuana use, and stimulant use were all associated with lower BMI, WC, HC, and WHtR; current smoking was associated with lower WC and WHtR in men and lower HC in men and women. Lower BMI, WC, HC, and WHtR were associated with hepatitis C infection among women only. Depressive symptoms were associated with significantly lower BMI among both men and women, and lower WC, HC, and WHtR among women only.
3.3. HIV-related effects on BMI, WC, HC, and WHtR at age 44, the mean age of the study population
Among HIV-infected men and women, a lower CD4+ T-cell count and shorter duration of ART tended to be associated with lower BMI, WC, HC, and WHtR (Tables 2–5B).
In a sensitivity analysis, we restricted the analysis to participants who were virologically suppressed (HIV-1 RNA <400 copies/mL) at all available visits (608 HIV-infected men and 580 HIV-infected women). The estimates of BMI, WC, and HC trajectories were similar to point estimates in the overall cohort, as shown in the Supplemental Table. In separate sensitivity analysis, adjustment for the baseline outcome (ie, BMI, WC, or HC) did not appreciably change the effects of age and/or HIV status.
4. Discussion
We provide the first comparisons of body composition trajectories from ages 18 to 75 among both HIV-infected and -uninfected men and women. Similar to prior findings among HIV-uninfected US adults,[21–23] we found that gains in BMI and WC were the steepest in the youngest participants. BMI increases continued until age 60 and then plateaued, whereas WC and WHtR increased across the age spectrum and irrespective of HIV serostatus, but with slower gains among younger HIV-infected women and faster gains among older HIV-infected men. These changes in WC in those more than 60 years with a leveling off of BMI suggest a concomitant loss of lean mass (an estimate of skeletal muscle) that may have important clinical consequences in an aging population: changes in WC are highly correlated with changes in trunk fat by dual-energy absorptiometry and with visceral adipose tissue area by computed tomography scan (Priya Bhagwat, et al; Measurement of Abdominal Fat Changes in HIV-Infected Individuals Initiating Therapy; Abstract #704, presented at Conference on Retroviruses and Opportunistic Infections; Boston, MA 2/2016). Moreover, central obesity has negative metabolic effects and has been associated with increased mortality[24] and neurocognitive impairment,[25] in addition to fatty liver disease[26] and liver stiffness among HIV-infected individuals.[27]
Although published data on WHtR is very limited in adults with HIV infection, this measurement has been associated with mortality and metabolic risk in HIV-uninfected populations.[28,29] A value of 0.5 or greater has been proposed as an indicator of increased metabolic risk,[30] and this cut-off value allows for a simple bedside test to determine whether a piece of string measured at one-half of a person's height will fit around the person's waist.[30] As expected, WC and WHtR changes with age were quite similar in our population (Fig. 1D). Although further studies are needed to verify the predictive value of this measure in HIV-infected populations, the findings are notable for the average WHtR well above 0.5 among both HIV-infected and -uninfected men and women in this study population.
The greatest differences in BMI, WC, HC, and WHtR occurred among ethnic and/or racial minorities, suggesting a need for targeted lifestyle interventions in these high-risk populations. Depressive symptoms were associated with significantly lower BMI, WC, HC, and WHtR in nearly all models. Prior studies have shown an association between depression and both weight loss and weight gain,[31] and between depressive symptoms and weight loss.[32] This relationship may be complex, with the most severe symptoms in underweight older adults and less severe symptoms among overweight or obese individuals.[33] Thus, in our cohort, weight loss may be a sign of more severe depression.
The present findings in the HIV-infected participants are also notable: although weight gain is often attributed to a “return to health” following ART initiation, our findings suggest that greater BMI, WC, HC, and WHtR are found many years after immune reconstitution, including among participants with CD4 T-cell counts more than 500 cells/μL and with over 10 years of ART. These findings likely reflect the overall increasing rates of obesity in the general population. Alternatively, they could suggest that many years of suppressive ART are needed before the elevated resting energy expenditure associated with HIV is reversed, an inflammatory state persists during the first 5 to 10 years of ART and blunts weight gain, or the development of abdominal lipohypertrophy is most pronounced after a longer duration (>10 years) of ART. Furthermore, the effects of age were similar among those with consistent HIV virologic suppression and in the overall cohort with intermittent viremia.
HIV-infected adults generally gained weight and girth at a slower pace than HIV-uninfected individuals. This may be somewhat reassuring, in the midst of a growing obesity epidemic. However, a less steep BMI and WC trajectory is not necessarily equivalent to maintaining a “healthy” weight or improved health outcomes, as suggested by the observed strong association of substance abuse and hepatitis C infection with lower BMI and WC. BMI is a rough estimate of overall obesity-related risk particularly among older adults, as aging is associated with decreased muscle and increased fat[34–36] and BMI by itself therefore likely underestimates the extent of adiposity.[37] Indeed, the steady increase in WC but not BMI or HC after age 60 in the present study suggests a gain in central adiposity and loss of lean mass. This finding is worrisome, because a normal or stable BMI may not prompt diet and physical activity counseling by healthcare providers despite underlying potentially harmful body composition changes that would benefit from these interventions.[38] Lastly, an obesity paradox may exist among older adults, where a greater BMI is associated with improved survival.[39,40] Consistent with this paradox, a lower BMI throughout the age trajectory may suggest less reserve and lower survival benefit among older populations.
We acknowledge several limitations of the current analysis. First, we did not have body composition imaging to distinguish whether the gain in abdominal fat was subcutaneous or visceral, or if the gain in fat was associated with a loss of lean body mass. We also did not have detailed dietary intake, food security assessments, or physical activity measurements that were comparable and consistent in both cohorts. However, the large numbers of visits and participants, the use of clinically feasible and inexpensive anthropomorphic measurements, the inclusion of racially and ethnically diverse men and women, and the restriction of some analyses to virologically suppressed participants on ART expand greatly upon previously reported BMI trajectory data, and are strengths of the study.
Routine measurement and monitoring of BMI, WC, and HC trajectories may provide important insights and identify opportunities for interventions. Counseling should be provided to all HIV-infected patients, regardless of BMI, on the importance of a lifestyle factors (healthy diet, physical activity) to maintain a normal weight. Particular attention should be directed toward younger individuals, racial/ethnic minorities, and individuals initiating ART at high CD4+ T cell counts. An unintentional negative BMI trajectory might serve as a prompt for screening for depressive symptoms, substance abuse, or hepatitis C infection, and may be a marker of loss of lean mass. Further analysis of the changes in muscle and fat compartments complemented by studies of muscle and fat quality will advance the understanding of the metabolic risk over the lifespan, a key to extending longevity and compressing morbidity in an aging population.
Acknowledgments
KME contributed to study conception and design, and interpretation of data; she prepared the first draft of the manuscript. LZ and LJ contributed to study design, data analysis, interpretation, and reviewed and edited the manuscript. JEL, JS, KA, AS, PT, JM, and TTB contributed to study data collection, study design, and interpretation of data, and reviewed and edited the manuscript.
Supplementary Material
Footnotes
Abbreviations: 3TC = lamivudine, AIDS = acquired immunodeficiency syndrome, ART = antiretroviral therapy, BMI = body mass index, CES-D = Center for Epidemiologic Studies Depression Scale, D4T = stavudine, FRAM Study; The Study of Fat Redistribution and Metabolic Change in HIV Infection, FTC = emtricitabine, HAART = highly active antiretroviral therapy, HC = hip circumference, HIV = human immunodeficiency virus, IQR = interquartile ratio, MACS = Multicenter AIDS Cohort Study, WC = waist circumference, WHtR = weight-to-height ratio, WIHS = Women's Interagency HIV Study, ZDV = zidovudine.
KME has served as a consultant for Theratechnologies and received research funding from Gilead. KNA reports serving on a Medical Advisory Board for Gilead Sciences, Inc. JEL has served as a consultant for Gilead Sciences and GSK. LPJ has served as a consultant for Bristol Myers Squibb. TTB has served as a consultant for Gilead Sciences, Merck, Bristol Myers Squibb, Theratechnologies, and EMD-Serono.
The research was supported in part by funding through the National Institutes of Health, National Institute on Aging (K23 AG050260 to KME and K01 AG048765 to JAS), National Institute of Allergy and Infectious Diseases (K01 AI093197 to KMA, K23 AI110532 to JEL, and K24 AI120834 to TTB), and the National Institute of Arthritis and Musculoskeletal and Skin Diseases (K23AR06199301 to AS). The contents of this publication are solely the responsibility of the authors and do not represent the official views of the NIH.
Data in this manuscript were collected by the Multicenter AIDS Cohort Study (MACS) with centers at Baltimore (U01-AI35042 and UL1-TR000424): The Johns Hopkins University Bloomberg School of Public Health: Joseph B. Margolick (PI), Jay Bream, Todd Brown, Adrian Dobs, Michelle Estrella, W. David Hardy, Lisette Johnson-Hill, Sean Leng, Anne Monroe, Cynthia Munro, Michael W. Plankey, Wendy Post, Ned Sacktor, Jennifer Schrack, Chloe Thio; Chicago (U01-AI35039): Feinberg School of Medicine, Northwestern University, and Cook County Bureau of Health Services: Steven M. Wolinsky (PI), John P. Phair, Sheila Badri, Dana Gabuzda, Frank J. Palella, Jr., Sudhir Penugonda, Susheel Reddy, Matthew Stephens, Linda Teplin; Los Angeles (U01-AI35040): University of California, UCLA Schools of Public Health and Medicine: Roger Detels (PI), Otoniel Martínez-Maza (Co-P I), Aaron Aronow, Peter Anton, Robert Bolan, Elizabeth Breen, Anthony Butch, Shehnaz Hussain, Beth Jamieson, Eric N. Miller, John Oishi, Harry Vinters, Dorothy Wiley, Mallory Witt, Otto Yang, Stephen Young, Zuo Feng Zhang; Pittsburgh (U01-AI35041): University of Pittsburgh, Graduate School of Public Health: Charles R. Rinaldo (PI), Lawrence A. Kingsley (Co-PI), James T. Becker, Phalguni Gupta, Kenneth Ho, Susan Koletar, Jeremy J. Martinson, John W. Mellors, Anthony J. Silvestre, Ronald D. Stall; Data Coordinating Center (UM1-AI35043): The Johns Hopkins University Bloomberg School of Public Health: Lisa P. Jacobson (PI), Gypsyamber D'Souza (Co-PI), Alison Abraham, Keri Althoff, Jennifer Deal, Priya Duggal, Sabina Haberlen, Eithne Keelaghan, Heather McKay, Alvaro Muñoz, Derek Ng, Eric C. Seaberg, Sol Su, Pamela Surkan. Institute of Allergy and Infectious Diseases: Robin E. Huebner; National Cancer Institute: Geraldina Dominguez. The MACS is funded primarily by the National Institute of Allergy and Infectious Diseases (NIAID), with additional co-funding from the National Cancer Institute (NCI), the National Institute on Drug Abuse (NIDA), and the National Institute of Mental Health (NIMH). Targeted supplemental funding for specific projects was also provided by the National Heart, Lung, and Blood Institute (NHLBI), and the National Institute on Deafness and Communication Disorders (NIDCD). MACS data collection is also supported by UL1-TR001079 (JHU ICTR) from the National Center for Advancing Translational Sciences (NCATS), a component of the National Institutes of Health (NIH), and NIH Roadmap for Medical Research. The MACS website is located at http://aidscohortstudy.org/.
Data in this manuscript were also collected by the Women's Interagency HIV Study (WIHS). The contents of this publication are solely the responsibility of the authors and do not represent the official views of the National Institutes of Health (NIH). WIHS (Principal Investigators): UAB-MS WIHS (Michael Saag, Mirjam-Colette Kempf, and Deborah Konkle-Parker), U01-AI-103401; Atlanta WIHS (Ighovwerha Ofotokun and Gina Wingood), U01-AI-103408; Bronx WIHS (Kathryn Anastos), U01-AI-035004; Brooklyn WIHS (Howard Minkoff and Deborah Gustafson), U01-AI-031834; Chicago WIHS (Mardge Cohen and Audrey French), U01-AI-034993; Metropolitan Washington WIHS (Mary Young), U01-AI-034994; Miami WIHS (Margaret Fischl and Lisa Metsch), U01-AI-103397; UNC WIHS (Adaora Adimora), U01-AI-103390; Connie Wofsy Women's HIV Study, Northern California (Ruth Greenblatt, Bradley Aouizerat, and Phyllis Tien), U01-AI-034989; WIHS Data Management and Analysis Center (Stephen Gange and Elizabeth Golub), U01-AI-042590; Southern California WIHS (Alexandra Levine and Marek Nowicki), U01-HD-032632 (WIHS I – WIHS IV). The WIHS is funded primarily by the National Institute of Allergy and Infectious Diseases (NIAID), with additional cofunding from the Eunice Kennedy Shriver National Institute of Child Health and Human Development (NICHD), the National Cancer Institute (NCI), the National Institute on Drug Abuse (NIDA), and the National Institute on Mental Health (NIMH). Targeted supplemental funding for specific projects is also provided by the National Institute of Dental and Craniofacial Research (NIDCR), the National Institute on Alcohol Abuse and Alcoholism (NIAAA), the National Institute on Deafness and other Communication Disorders (NIDCD), and the NIH Office of Research on Women's Health. WIHS data collection is also supported by UL1-TR000004 (UCSF CTSA) and UL1-TR000454 (Atlanta CTSA).
The authors report no conflicts of interest.
Supplemental Digital Content is available for this article.
References
- 1.McComsey GA, Moser C, Currier J, et al. Body composition changes after initiation of raltegravir or protease inhibitors: ACTG A5260 s. Clin Infect Dis 2016; 62:853–862. [DOI] [PMC free article] [PubMed] [Google Scholar]
- 2.Grunfeld C, Saag M, Cofrancesco J, Jr, et al. Regional adipose tissue measured by MRI over 5 years in HIV-infected and control participants indicates persistence of HIV-associated lipoatrophy. AIDS 2010; 24:1717–1726. [DOI] [PMC free article] [PubMed] [Google Scholar]
- 3.Brown TT, Chu H, Wang Z, et al. Longitudinal increases in waist circumference are associated with HIV-serostatus, independent of antiretroviral therapy. AIDS 2007; 21:1731–1738. [DOI] [PubMed] [Google Scholar]
- 4.Justman JE, Hoover DR, Shi Q, et al. Longitudinal anthropometric patterns among HIV-infected and HIV-uninfected women. J Acquir Immune Defic Syndr 2008; 47:312–319. [DOI] [PMC free article] [PubMed] [Google Scholar]
- 5.Hasse B, Iff M, Ledergerber B, et al. Obesity trends and body mass index changes after starting antiretroviral treatment: The Swiss HIV Cohort Study. Open Forum Infect Dis 2014; 1:ofu040. [DOI] [PMC free article] [PubMed] [Google Scholar]
- 6.Sharma A, Bynum SA, Schneider MF, et al. Changes in body mass index following HAART initiation among HIV-infected women in the Women's Interagency HIV Study. J AIDS Clin Res 2014; 5. [DOI] [PMC free article] [PubMed] [Google Scholar]
- 7.Crum-Cianflone N, Roediger MP, Eberly L, et al. Increasing rates of obesity among HIV-infected persons during the HIV epidemic. PLoS One 2010; 5:e10106. [DOI] [PMC free article] [PubMed] [Google Scholar]
- 8.Boodram B, Plankey MW, Cox C, et al. Prevalence and correlates of elevated body mass index among HIV-positive and HIV-negative women in the Women's Interagency HIV Study. AIDS Patient Care STDS 2009; 23:1009–1016. [DOI] [PMC free article] [PubMed] [Google Scholar]
- 9.Crum-Cianflone N, Tejidor R, Medina S, et al. Obesity among patients with HIV: the latest epidemic. AIDS Patient Care STDS 2008; 22:925–930. [DOI] [PMC free article] [PubMed] [Google Scholar]
- 10.Buchacz K, Baker RK, Palella FJ, Jr, et al. Disparities in prevalence of key chronic diseases by gender and race/ethnicity among antiretroviral-treated HIV-infected adults in the US. Antivir Ther 2013; 18:65–75. [DOI] [PubMed] [Google Scholar]
- 11.Ogden CL, Carroll MD, Kit BK, et al. PRevalence of childhood and adult obesity in the united states, 2011-2012. JAMA 2014; 311:806–814. [DOI] [PMC free article] [PubMed] [Google Scholar]
- 12.Taylor BS, Liang Y, Garduno LS, et al. High risk of obesity and weight gain for HIV-infected uninsured minorities. J Acquir Immune Defic Syndr 2014; 65:e33–e40. [DOI] [PMC free article] [PubMed] [Google Scholar]
- 13.Yuh B, Tate J, Butt AA, et al. Weight change after antiretroviral therapy and mortality. Clin Infect Dis 2015; 60:1852–1859. [DOI] [PMC free article] [PubMed] [Google Scholar]
- 14.Kaslow RA, Ostrow DG, Detels R, et al. The Multicenter AIDS Cohort Study: rationale, organization, and selected characteristics of the participants. Am J Epidemiol 1987; 126:310–318. [DOI] [PubMed] [Google Scholar]
- 15.Dudley J, Jin S, Hoover D, et al. The Multicenter AIDS Cohort Study: retention after 9 1/2 years. Am J Epidemiol 1995; 142:323–330. [DOI] [PubMed] [Google Scholar]
- 16.Bacon MC, von Wyl V, Alden C, et al. The Women's Interagency HIV Study: an observational cohort brings clinical sciences to the bench. Clin Diagn Lab Immunol 2005; 12:1013–1019. [DOI] [PMC free article] [PubMed] [Google Scholar]
- 17.National Health and Nutrition Examination Survey III. Body Measurements (Anthropometry). Rockville, MD:1988. [Google Scholar]
- 18.Radloff LS. The CES-D scale: a self-report depression scale for research in the general population. Appl Psychol Measur 1977; 1:385–401. [Google Scholar]
- 19.1993 revised classification system for HIV infection and expanded surveillance case definition for AIDS among adolescents and adults. MMWR Recomm Rep. 1992; 41(RR-17):1–19. [PubMed] [Google Scholar]
- 20.DHHS/Henry J. Kaiser Family Foundation Panel on Clinical Practices for the Treatment of HIV infection. Guidelines for the use of antiretroviral agents in HIV-infected adults and adolescents. January 2016 revision. Available at: https://aidsinfo.nih.gov/guidelines/html/1/adult-and-adolescent-treatment-guidelines/. [Google Scholar]
- 21.Williamson DF, Kahn HS, Remington PL, et al. The 10-year incidence of overweight and major weight gain in US adults. Arch Intern Med 1990; 150:665–672. [PubMed] [Google Scholar]
- 22.Kimokoti RW, Newby PK, Gona P, et al. Patterns of weight change and progression to overweight and obesity differ in men and women: implications for research and interventions. Public Health Nutr 2013; 16:1463–1475. [DOI] [PMC free article] [PubMed] [Google Scholar]
- 23.Williamson DF. Descriptive epidemiology of body weight and weight change in U.S. adults. Ann Intern Med 1993; 119 (7 Pt 2):646–649. [DOI] [PubMed] [Google Scholar]
- 24.Scherzer R, Heymsfield SB, Lee D, et al. Decreased limb muscle and increased central adiposity are associated with 5-year all-cause mortality in HIV infection. AIDS 2011; 25:1405–1414. [DOI] [PMC free article] [PubMed] [Google Scholar]
- 25.Sattler F, He J, Letendre S, et al. Abdominal obesity contributes to neurocognitive impairment in HIV infected patients with increased inflammation and immune activation. J Acquir Immune Defic Syndr 2014; 68:281–288. [DOI] [PMC free article] [PubMed] [Google Scholar]
- 26.Price JC, Seaberg EC, Latanich R, et al. Risk factors for fatty liver in the Multicenter AIDS Cohort Study. Am J Gastroenterol 2014; 109:695–704. [DOI] [PMC free article] [PubMed] [Google Scholar]
- 27.Bailony MR, Scherzer R, Huhn G, et al. Association of HIV infection, hepatitis C virus infection, and metabolic factors with liver stiffness measured by transient elastography. J Infect Dis 2013; 208:1776–1783. [DOI] [PMC free article] [PubMed] [Google Scholar]
- 28.Ashwell M, Mayhew L, Richardson J, et al. Waist-to-height ratio is more predictive of years of life lost than body mass index. PLoS One 2014; 9:e103483. [DOI] [PMC free article] [PubMed] [Google Scholar]
- 29.Ashwell M, Gunn P, Gibson S. Waist-to-height ratio is a better screening tool than waist circumference and BMI for adult cardiometabolic risk factors: systematic review and meta-analysis. Obes Rev 2012; 13:275–286. [DOI] [PubMed] [Google Scholar]
- 30.Ashwell M, Gibson S. A proposal for a primary screening tool: ’Keep your waist circumference to less than half your height’. BMC Med 2014; 12:207. [DOI] [PMC free article] [PubMed] [Google Scholar]
- 31.Gibson-Smith D, Bot M, Milaneschi Y, et al. Major depressive disorder, antidepressant use, and subsequent 2-year weight change patterns in the Netherlands Study of Depression and Anxiety. J Clin Psychiatry 2016; 77:e144–e151. [DOI] [PubMed] [Google Scholar]
- 32.Kim J, Noh JW, Park J, et al. Body mass index and depressive symptoms in older adults: a cross-lagged panel analysis. PLoS One 2014; 9:e114891. [DOI] [PMC free article] [PubMed] [Google Scholar]
- 33.Noh JW, Kwon YD, Park J, et al. Body mass index and depressive symptoms in middle aged and older adults. BMC Public Health 2015; 15:310. [DOI] [PMC free article] [PubMed] [Google Scholar]
- 34.Batsis JA, Sahakyan KR, Rodriguez-Escudero JP, et al. Normal weight obesity and mortality in United States subjects >/=60 years of age (from the Third National Health and Nutrition Examination Survey). Am J Cardiol 2013; 112:1592–1598. [DOI] [PubMed] [Google Scholar]
- 35.Bennasar-Veny M, Lopez-Gonzalez AA, Tauler P, et al. Body adiposity index and cardiovascular health risk factors in Caucasians: a comparison with the body mass index and others. PLoS One 2013; 8:e63999. [DOI] [PMC free article] [PubMed] [Google Scholar]
- 36.Hsu CH, Lin JD, Hsieh CH, et al. Adiposity measurements in association with metabolic syndrome in older men have different clinical implications. Nutrition research (New York, NY) 2014; 34:219–225. [DOI] [PubMed] [Google Scholar]
- 37.Padwal R, Leslie WD, Lix LM, et al. Relationship among body fat percentage, body mass index, and all-cause mortality: a cohort study. Ann Intern Med 2016; 165:604. [DOI] [PubMed] [Google Scholar]
- 38.Ampt AJ, Amoroso C, Harris MF, et al. Attitudes, norms and controls influencing lifestyle risk factor management in general practice. BMC Fam Pract 2009; 10:59. [DOI] [PMC free article] [PubMed] [Google Scholar]
- 39.Harrington M, Gibson S, Cottrell RC. A review and meta-analysis of the effect of weight loss on all-cause mortality risk. Nutr Res Rev 2009; 22:93–108. [DOI] [PubMed] [Google Scholar]
- 40.Corrada MM, Kawas CH, Mozaffar F, et al. Association of body mass index and weight change with all-cause mortality in the elderly. Am J Epidemiol 2006; 163:938–949. [DOI] [PMC free article] [PubMed] [Google Scholar]
Associated Data
This section collects any data citations, data availability statements, or supplementary materials included in this article.