

Abstract
Patients with herpes zoster oticus (HZO) may commonly show symptoms associated with 7th and 8th cranial nerve (CN VII and CN VIII) dysfunction. The aim of this study is to investigate the characteristics of hearing loss in patients with HZO and discuss possible mechanisms.
Ninety-five HZO patients who showed at least one of the symptoms of CN VII and CN VIII dysfunction between January 2007 and October 2014 were included in this study. Hearing loss was defined when the mean thresholds of pure tone audiometry (PTA) in speech frequency (0.5 kHz + 1 kHz + 2 kHz/3) or isolated high frequency (4 kHz + 8 kHz/2) were greater than 10 dB in the affected ear compared with the healthy ear, and a total of 72 patients were classified as the hearing loss group.
The difference of mean PTA thresholds between affected and healthy ears was significantly greater in the high frequency range than in low range (20.0 ± 11.5 dB vs. 12.9 ± 15.7 dB, P = 0.0026) in patients with hearing loss (n = 72). The difference between affected and healthy ear was significantly greater in patients with vertigo (n = 34) than those without vertigo (n = 38) in both the high (P = 0.033) and low (P = 0.024) frequency ranges. In contrast, the differences between affected and healthy ears were not significantly different between patients with facial palsy (n = 50) and those without facial palsy (n = 22) in both the high (P = 0.921) and low (P = 0.382) frequency ranges.
In patients with HZO, hearing loss is more severe in the high frequency range than in the low frequency range. Hearing impairment is more severe in patients with vertigo than in those without vertigo in both the high and low frequency ranges, even though the degree of hearing impairment is not significantly different between patients with and without facial palsy. These findings indicate that the mechanisms of viral spread from CN VII to CN VIII may differ between vestibular and audiologic deficits.
Keywords: facial palsy, hearing loss, herpes zoster oticus, ramsay hunt syndrome, vertigo
1. Introductions
Herpes zoster oticus (HZO) is characterized by erythematous vesicular rashes in the external auditory canal and pinna with severe otalgia. When it is accompanied with ipsilesional facial palsy, a diagnosis of Ramsay Hunt syndrome (RHS) can be made. Inflammation of the facial nerve due to reactivation of varicella-zoster virus (VZV) is a known cause of RHS, and perivascular, perineural, or intraneural aggregations of round cells in the facial nerve have been observed in patients with RHS.[1] Neurological complications include changes in cerebrospinal fluids, peripheral motor neuropathy, aseptic meningitis, and cranial polyneuropathy.[2] Among these, vestibulocochlear symptoms such as vertigo, hearing loss, and tinnitus most commonly occur in patients with RHS.
Hearing loss frequently manifests in patients with RHS. Previous investigations of hearing impairment in patients with RHS found that hearing loss in these patients is mild to moderate in most cases, and that cochlear and/or retrocochlear involvement is attributed to this hearing loss.[3–6] Moreover, while 54% of HZO patients without cochlear symptoms showed hearing loss isolated to high frequency on pure tone audiometry (PTA), only 19% had hearing loss at speech frequency.[4] It was reported that a lesioned site in RHS patients with vertigo may be more likely within the vestibular nerve than the inner ear as a cause for vestibular deficit because the results of vestibular function tests in RHS patients with vertigo were more similar to those in vestibular neuritis patients than those in sudden sensorineural hearing loss with vertigo.[7] RHS patients with vertigo exhibited lower electroneuronography (ENoG) value of facial nerve suggesting more severe nerve degeneration compared with those without vertigo, even though ENoG values were not significantly different between patients with and without hearing loss.[8]
Considering the previous findings of differential clinical manifestations and severity of cochleovestibular dysfunction in patients with HZO, it can be assumed that the mechanism of an effect of HZO on cochlear and vestibular function and the mode of viral spread in vestibular and auditory deficit may be different. However, there have been, to our best knowledge, no studies that emphasized a possible mechanism of VZV spread from facial nerve to cochleovestibular nerve according to the findings of a differential effect of HZO on frequency of hearing loss and the relation between the severity of cochleovestibular deficit and the presence of facial nerve palsy.
The purposes of this study are to investigate the characteristics of hearing loss aiming to determine the frequency range in which the hearing impairment is more severe in patients with HZO, and to suggest a mechanism of viral transmission from the facial nerve to cochleovestibular nerve.
2. Materials and methods
2.1. Patients
Ninety-five patients (50 men and 45 women, 17–89 years old, with a mean age of 48.1 years), who were diagnosed with HZO accompanying at least one of the symptoms of 7th and 8th cranial nerve dysfunction (CN VII and CN VIII) between January 2007 and October 2014, were included in the study. Right and left ears were affected in 49 and 46 patients, respectively. Neurological and otolaryngological examinations were performed and those with a prior history of neurotologic disorders or otologic surgery in either ear were excluded from the study.
Sixty-nine patients (of 95) complained of cochlear symptoms such as hearing loss, tinnitus, or ear fullness. Ninety-three patients underwent PTA. Hearing thresholds of the affected side were compared with the unaffected side, and the “hearing loss” was defined when the pure tone thresholds of speech frequency (0.5 kHz + 1 kHz + 2 kHz/3) or isolated high frequency (4 kHz + 8 kHz/2) were greater than 10 dB in the affected ear compared with the healthy ear.[4,8] Air-bone gaps were not revealed from PTA in any of the patients. Out of the 69 patients with cochlear symptoms, 66 met the criteria of “hearing loss”, whereas 3 patients, who complained of ear fullness did not show hearing loss on PTA. Out of the 26 patients without cochlear symptoms, 6 patients met the above-mentioned criteria for “hearing loss” on the affected side. In total, 72 patients were classified in the “hearing loss group.”
Seventy-two patients with associated ipsilesional facial palsy were further diagnosed with RHS, and House–Brackmann grade was II in 10 patients, III in 21 patients, IV in 31 patients, and V in 10 patients. Thirty-seven patients who complained of vertigo were classified in the“vertigo group.”
2.2. Vestibular function tests
A bithermal caloric test was conducted irrigating with a constant flow of water at alternating temperatures of 30 and 44 °C for a constant period of time (30 seconds) in each ear. Using an infrared video-based system (CHARTR VNG, ICS Medical, Schaumburg), the maximum slow-phase velocity (SPV) of nystagmus was calculated. Jongkees’ formula was used to determine canal paresis (CP), and a CP ≥ 25% was considered abnormal. The vibration-induced nystagmus test (VIN) was performed using a hand-held vibrator (VVIB 100; Synapsys, France) with a fixed frequency of100 Hz. Using an infrared video-based system (CHARTR VNG, ICS Medical, Schaumburg), eye movements were recorded for 10 seconds during vibratory stimulation in a seated position. The vibrator was applied to both mastoid bones and sternocleidomastoid (SCM) muscles, and the maximum SPV on the horizontal plane was calculated. When spontaneous nystagmus was present, it was subtracted from the SPV of VIN. When all the SPVs from the 4 different stimulation sites (both mastoid bones and SCM muscles) were 2°/s or greater or SPVs from both mastoid bones and SCM muscles were 5°/s or greater,[7] VIN was considered abnormal. To conduct hyperventilation-induced nystagmus (HVIN), the patients were instructed to open their mouths and take deep and rapid breaths for 90 seconds. The maximum SPV was calculated, and when spontaneous nystagmus was present, it was subtracted from the SPV of HVIN. A positive test was defined as a maximum SPV of HVIN of ≥4°/s.[7]
2.3. Classification of patients
Among the patients with hearing loss (n = 72), patients with all 3 symptoms of CN VII and VIII dysfunction (facial palsy, vertigo, and hearing loss) were the most common (39%, 28/72), followed by patients with facial palsy without vertigo (31%, 22/72). Among the patients without hearing loss (n = 23), patients with facial palsy without vertigo were the most common (87%, 20/23) and only 1 patient had vertigo without facial palsy (Fig. 1).
Figure 1.

Patient distribution according to the symptoms of CN VII and VIII dysfunction. FP = facial palsy; V = vertigo.
2.4. Statistical analysis
A comparison of pure tone averages (dB; means ± standard deviations) between different symptomatic groups or frequencies was performed using an unpaired t test, and P < 0.05 was considered to be statistically significant. The Institutional Review Board of Konkuk University Medical Center approved the study (KUH1110054).
3. Results
3.1. Comparison of hearing loss between high frequency and low frequency ranges
To assess cause-related hearing loss, the differences in PTA thresholds between affected and healthy ears were compared in HZO patients with hearing loss. Since hearing loss has been reported to be more apparent in the high frequency range in patients with HZO,[3,4] we compared the degree of hearing loss between PTA averages of high frequency (3, 4, and 8 kHz) and low frequency (250, 500 Hz, and 1 kHz) thresholds. In the affected ear (n = 72), mean pure tone average was 49.8 ± 25.0 dB and 33.4 ± 22.9 dB in the high frequency and low frequency range, respectively. Healthy ears exhibited pure tone averages of 29.8 ± 21.7 dB in the high frequency and 20.6 ± 13.1 dB in the low frequency range (Fig. 2). The difference in pure tone average between affected and healthy ears was significantly greater in the high frequency range than in the low frequency range (20.0 ± 11.5 dB vs. 12.9 ± 15.7 dB, P = 0.0026; Fig. 2). Among 72 patients of “hearing loss group,” 58 patients underwent speech discrimination test. Speech discrimination score (%) was significantly worse in the affected side than healthy side (83.9 ± 22.9 vs. 93.8 ± 7.6; P < 0.001).
Figure 2.
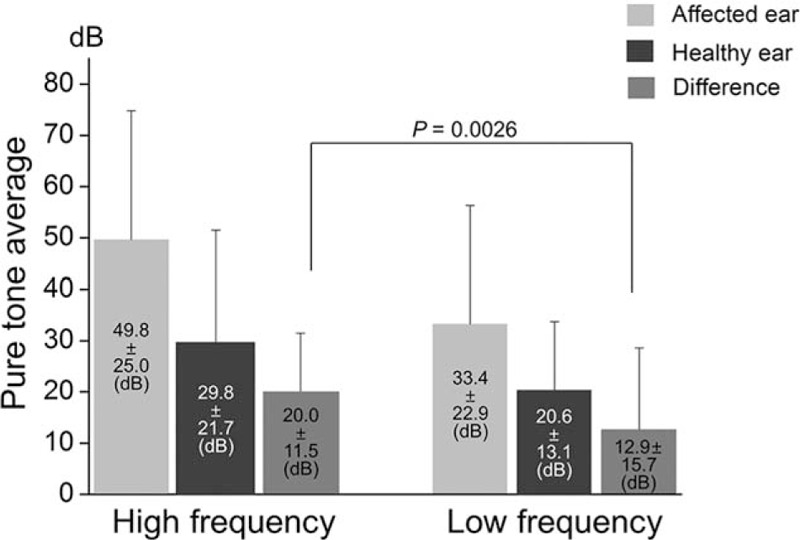
Comparison of pure tone averages between high frequency (3000, 4000, and 8000 Hz) and low frequency (250, 500, and 1000 Hz) ranges in patients with hearing loss (n = 72). Pure tone averages (means ± standard deviations) were presented in the panels. The difference in pure tone average between affected and healthy ears is significantly greater in the high frequency (20.0 ± 11.5 dB) than in the low frequency (12.9 ± 15.7 dB; P = 0.0026).
3.2. Comparison of hearing loss between patients with vertigo and those without vertigo
We compared pure tone averages between patients with and without vertigo (Fig. 3). In patients with vertigo (n = 34), affected ears showed a mean pure tone average of 55.9 ± 25.4 dB, while healthy ears had a mean pure tone average of 32.8 ± 21.0 dB in high frequency range. At low frequency, mean pure tone average was 38.6 ± 23.6 dB in affected ears and 21.1 ± 11.3 dB in healthy ears. The difference between affected and healthy ears was significantly greater in the high frequency (23.0 ± 11.9 dB) than in the low frequency range (17.5 ± 19.0 dB, P = 0.015; Fig. 3). In patients without vertigo (n = 38), affected ears showed a mean pure tone average of 44.3 ± 23.7 dB, while healthy ears exhibited a mean pure tone average of 27.2 ± 22.3 dB in the high frequency range. In the low frequency range, the mean pure tone average was 28.7 ± 21.4 dB in affected ears and 20.2 ± 14.6 dB in healthy ears. The difference between affected and healthy ears was also significantly greater in the high frequency (17.2 ± 10.6 dB) than in the low frequency range (8.9 ± 10.8 dB, P = 0.001; Fig. 3). The difference between affected and healthy ears was significantly greater in patients with vertigo than in those without vertigo in both high (P = 0.033) and low frequency (P = 0.024) ranges (Fig. 3).
Figure 3.

Comparison of pure tone averages between patients with vertigo (n = 34) and those without vertigo (n = 38) in patients with hearing loss (n = 72). Pure tone averages (means ± standard deviations, dB) were presented in the panels. The difference in pure tone averages between affected and healthy ears is significantly greater in the high frequency range (3000, 4000, and 8000 Hz) than in low frequency range (250, 500, and 1000 Hz) in both patient groups with vertigo (23.0 ± 11.9 dB vs. 17.5 ± 19.0 dB; P = 0.015) and without vertigo (17.2 ± 10.6 dB vs. 8.9 ± 10.8 dB; P = 0.001). The difference in pure tone average between affected and healthy ears is significantly greater in patients with vertigo than those without vertigo in both high (23.0 ± 11.9 dB vs. 17.2 ± 10.6 dB; P = 0.033) and low (17.5 ± 19.0 dB vs. 8.9 ± 10.8 dB; P = 0.024) frequency ranges.
3.3. Comparison of hearing loss between patients with facial palsy and those without facial palsy
We then compared pure tone averages between patients with and without facial palsy (Fig. 4). In patients with facial palsy (n = 50), affected ears showed a mean pure tone average of 53.2 ± 27.1 dB, and healthy ears exhibited a mean pure tone average of 33.2 ± 23.8 dB in the high frequency range. In the low frequency range, a mean pure tone average was 34.8 ± 24.3 dB in affected ears and 20.9 ± 14.3 dB in healthy ears. The difference between affected and healthy ears was significantly greater in high frequency range (20.1 ± 11.7 dB) than in low frequency range (14.0 ± 16.7 dB, P = 0.038; Fig. 4). In patients without facial palsy (n = 22), affected ears exhibited a mean pure tone average of 41.9 ± 17.5 dB, and healthy ears showed a mean pure tone average of 22.3 ± 13.6 dB in the high frequency range. In low frequency, the mean pure tone average was 30.2 ± 19.3 dB in affected ears and 20.0 ± 10.1 dB in healthy ears. The difference between affected and healthy ears was also significantly greater in high frequency range (19.8 ± 11.2 dB) than in the low frequency range (10.5 ± 13.1 dB, P = 0.015; Fig. 4). However, differences between affected and healthy ears were not statistically significant between patients with facial palsy and those without facial palsy in both high (P = 0.921) and low frequency (P = 0.382) ranges (Fig. 4).
Figure 4.

Comparison of pure tone averages between patients with facial palsy (n = 50) and those without facial palsy (n = 22) in patients with hearing loss (n = 72). Pure tone averages (means ± standard deviations, dB) were presented in the panels. The difference in pure tone average between affected and healthy ears is significantly greater in the high frequency range (3000, 4000, and 8000 Hz) than in the low frequency range (250, 500, and 1000 Hz) in both patient groups with facial palsy (20.1 ± 11.7 dB vs. 14.0 ± 16.7 dB; P = 0.038) and without facial palsy (19.8 ± 11.2 dB vs. 10.5 ± 13.1 dB; P = 0.015). However, the difference in the pure tone average between affected and healthy ears is not significantly different between patients with facial palsy and those without facial palsy in both high (20.1 ± 11.7 dB vs. 19.8 ± 11.2 dB; P = 0.921) and low (14.0 ± 16.7 dB vs. 10.5 ± 13.1 dB; P = 0.382) frequency ranges.
3.4. VIN and HVIN in HZO patients with vertigo
Thirty-seven patients with HZO complained of vertigo. At initial examination, spontaneous nystagmus beating toward the unaffected side was observed in all 37 patients. Out of these patients, 34 underwent vestibular function tests. A bithermal caloric test revealed that 28 of 34 patients (82%) presented abnormal findings (canal paresis ≥25%). Twenty-seven of 34 HZO patients (79%) with vertigo who underwent vestibular function tests, showed abnormal VIN. The fast-phase nystagmus was always directed toward the healthy side. Abnormal HVIN was observed in 18 of 34 HZO patients with vertigo (52%). Ipsilesional HVIN beating toward the lesioned side occurred in 7 of 34 patients (21%), and contralesional HVIN beating toward the intact side occurred in 11 of 34 patients (32%).
4. Discussion
This study found that 76% of the patients with HZO exhibited hearing loss as a result of HZO, and that hearing loss was more severe in the high frequency range than in the low frequency range. While hearing impairment was more severe in patients with vertigo than those without vertigo in both the high and low frequency ranges (Fig. 3), the degree of hearing impairment was not significantly different between patients with and without facial palsy in either range (Fig. 4).
The incidence of hearing loss in patients with HZO has been shown to range from 6.5% to 85%.[4,6,8] Auditory function depends on distinct contributions of the cochlea and retrocochlear structures. Cochlear pattern of hearing loss has been reported to be caused by dysfunction of sensory hair cells of the inner ear, and retrocochlear pattern of hearing loss is known to be due to dysfunction of auditory nerve and/or the central auditory system.[3,6,9] Kaberos et al[3] applied auditory brainstem response (ABR) and otoacoustic emission tests to determine the sites of involvement in 15 RHS patients with hearing loss. Retrocochlear involvement was evident in 8 patients, 3 of whom exhibited pure retrocochlear involvement, while pure cochlear involvement was evident in 3 patients. Wayman et al[6] performed extensive audiologic work-up including PTA, speech discrimination, ABR, short increment sensitivity index (SISI), alternate binaural loudness test (ABLB), Bekesy tracing, and tone decay to determine the cochlear or retrocochlear pattern of hearing loss in 7 patients with RHS. Six patients showed audiological findings consistent with cochlear pathology, of which 1 patient exhibited both cochlear and retrocochlear findings, while a retrocochlear pattern was observed in 1 patient. Abramovich and Prasher[9] investigated 13 patients with RHS using electrocochleography and ABR, in addition to classic audiological tests: a retrocochlear pattern was demonstrated in 7 patients. The present study showed that speech discrimination score was significantly lower in the affected side than healthy side, but ABR and otoacoustic emission test were performed in a limited number of patients (9 of 72 patients for ABR and 11 of 72 patients for otoacoustic emission test), which made determination of the pattern of hearing loss difficult in this study.
The original description of RHS assumed that typical symptoms of CN VII and VIII dysfunction is caused by reactivation of VZV in the ganglion of CN VII and spread of infection from CN VII to CN VIII via vestibulofacial or vestibulocochlear anastomosis,[10] which was supported by the findings that VZV DNA was identified in the geniculate ganglion of CN VII[11] and in the vestibular and cochlear nerves.[12–14] Although the mode of transmission of VZV infection from CN VII to CN VIII or inner ear end organs is still unclear, transmission of VZV infection from a dehiscent facial canal to the inner ear end organs through the oval or round window has been suggested as a potential route of inner ear involvement.[15] For interneural transmission, the spread of VZV across the perineural tissues inside the internal auditory canal has been proposed as a possible route of infection.[5,8] Involvement of both inner ear end organs and CN VIII was demonstrated by histopathological studies which showed that inflammatory cell infiltration occurred in the vestibular and cochlear nerve ganglia, and a degeneration of inner ear end organs was observed in patients with RHS.[1,16,17] Studies of RHS patients with vestibular deficit have demonstrated that lesioned sites responsible for vestibular disturbance may reside in the vestibular nerve,[5,7,18,19] end organ,[20] or both.[21] Studies in RHS patients with hearing loss have reported that the pattern of hearing loss can be cochlear, retrocochlear, or both.[3,6,9] Therefore, the inflammation caused by VZV appears to be widely spread from CN VIII through inner ear end organs in RHS patients with vestibulocochlear dysfunction.
Our data demonstrate that the degree of hearing impairment is significantly more severe in the high frequency range than in the low frequency range. Based on the observations that the superior vestibular nerve is directly connected to the facial nerve in the internal auditory canal (IAC),[22] the vestibular deficit in the patients with RHS has been often postulated to be attributed to a direct spread of VZV via neural anastomosis.[5,7,18,19] In contrast, a direct connection between the facial nerve and cochlear nerve has not been reported, even though anastomosis between the cochlear nerve and saccular nerve has been observed.[23] Therefore, cochlear deficit may be caused by viral spread from the facial nerve into the cerebrospinal fluid (CSF) or perilymph within the IAC rather than via direction neural connection. If viral inflammation spreads from the IAC to the cochlea through CSF and perilymphatic fluid, tissues in the basal turn would be damaged earlier and more extensively than in the apical turn (Fig. 5A). If viral spread from the CSF occurs across the perineural tissue of the cochlear nerve (Fig. 5B), the outer circumference of the nerve that conveys high frequency range information would be damaged earlier and more extensively than the inner part of the low frequency range. Neural fibers of cochlear nerve are known to be orderly organized according to their frequency.[24]
Figure 5.

Assumed mechanisms behind the greater severity of hearing loss in the high frequency range compared with the low frequency range in patients with Ramsay Hunt Syndrome. (A) Following viral transmission from the facial nerve into the cerebrospinal fluid (CSF) or perilymph within the IAC, if inflammation spreads from the IAC to the cochlea through CSF and perilymphatic fluid, tissues in the basal turn are damaged earlier and more extensively than in the apical turn resulting in more severe hearing loss in the high frequency range. (B) If viral spread from the CSF occurs across the perineural tissue of the cochlear nerve, an outer part of nerve comprising nerve fibers with a high frequency range may be more severely impaired than the inner part according to tonotopic organization of the cochlear nerve.
The present study demonstrated that the severity of hearing impairment was greater in patients with vertigo than in those without vertigo, while the degree of hearing impairment was not significantly different between patients with and without facial palsy. In patients with RHS, the incidence of vertigo increases alongside an increase in the severity of facial palsy; however, this trend is not applicable to the incidence of hearing loss.[4] ENoG revealed more severe degeneration of facial nerve in RHS patients with vertigo than those without vertigo, which consequently suggested the poorer prognosis for facial recovery, even though ENoG values were not significantly different between RHS patients with and without hearing loss.[8] This finding may suggest that the mode of viral transmission may differ between vestibular and audiologic deficits, which is supported by the findings that most HZO patients with vertigo also had hearing loss (33 of 37; Fig. 1) whereas only 47% of patients with hearing loss had vertigo (34 of 72; Fig. 1), and while the severity of cochlear or facial nerve dysfunction is closely related to the presence of vertigo (Fig. 3)[8] the severity of hearing loss and facial nerve degeneration did not significantly related to each other (Fig. 4).[8]
5. Conclusion
Inpatients with HZO, hearing loss was more severe in the high frequency range than in the low frequency range. Hearing impairment is more severe in patients with vertigo than in those without vertigo in both the high and low frequency ranges, even though the degree of hearing impairment is not significantly different between patients with and without facial palsy. These findings indicate that the mechanisms of viral spread from CN VII to CN VIII may differ between vestibular and audiologic deficits.
Footnotes
Abbreviations: ABLB = alternate binaural loudness test, ABR = auditory brainstem response, CN = cranial nerve, CP = canal paresis, CSF = cerebrospinal fluid, ENoG = electroneuronography, HVIN = hyperventilation-induced nystagmus, HZO = herpes zoster oticus, IAC = internal auditory canal, PTA = pure tone audiometry, RHS = Ramsay Hunt syndrome, SCM = sternocleidomastoid, SISI = short increment sensitivity index, SPV = slow-phase velocity, VIN = vibration-induced nystagmus, VZV = varicella-zoster virus.
This paper was supported by Konkuk University in 2016.
The authors have no conflicts of interest to disclose.
References
- 1.Blackley B, Friedmann I, Wright I. Herpes zoster auris associated with facial nerve palsy and auditory nerve symptoms: a case report with histopathological findings. Acta Otolaryngol 1967; 63:533–550. [DOI] [PubMed] [Google Scholar]
- 2.Elliott KJ. Other neurological complications of herpes zoster and their management. Ann Neurol 1994; 35 (Suppl):S57–S61. [DOI] [PubMed] [Google Scholar]
- 3.Kaberos A, Balatsouras DG, Korres SG, et al. Audiological assessment in Ramsay Hunt syndrome. Ann Otol Rhinol Laryngol 2002; 111:68–76. [DOI] [PubMed] [Google Scholar]
- 4.Kim J, Jung J, Moon IS, et al. Statistical analysis of pure tone audiometry and caloric test in herpes zoster oticus. Clin Exp Otorhinolaryngol 2008; 1:15–19. [DOI] [PMC free article] [PubMed] [Google Scholar]
- 5.Kuhweide R, Van de Steene V, Vlaminck S, et al. Ramsay Hunt syndrome: pathophysiology of cochleovestibular symptoms. J Laryngol Otol 2002; 116:844–848. [DOI] [PubMed] [Google Scholar]
- 6.Wayman DM, Pham HN, Byl FM, et al. Audiological manifestations of Ramsay Hunt syndrome. J Laryngol Otol 1990; 104:104–108. [DOI] [PubMed] [Google Scholar]
- 7.Kim CH, Jeong KH, Ahn SH, et al. Vibration- and hyperventilation-induced nystagmus in patients with Ramsay Hunt syndrome with vertigo. Otolaryngol Head Neck Surg 2015; 152:912–918. [DOI] [PubMed] [Google Scholar]
- 8.Shin DH, Kim BR, Shin JE, et al. Clinical manifestations in patients with herpes zoster oticus. Eur Arch Otorhinolaryngol 2016; 273:1739–1743. [DOI] [PubMed] [Google Scholar]
- 9.Abramovich S, Prasher DK. Electrocochleography and brain-stem potentials in Ramsay Hunt syndrome. Arch Otolaryngol Head Neck Surg 1986; 112:925–928. [DOI] [PubMed] [Google Scholar]
- 10.Hunt JR. On herpetic inflammation of the geniculate ganglion: a new syndrome and its complications. J Nerv Ment Dis 1907; 34:73–96. [Google Scholar]
- 11.Van de Steene V, Kuhweide R, Vlaminck S, et al. Varicella zoster virus: beyond facial paralysis. Acta Otorhinolaryngol Belg 2004; 58:61–66. [PubMed] [Google Scholar]
- 12.Wackym PA. Molecular temporal bone pathology: II. Ramsay Hunt syndrome (herpes zoster oticus). Laryngoscope 1997; 107:1165–1175. [DOI] [PubMed] [Google Scholar]
- 13.Murakami S, Nakashiro Y, Mizobuchi M, et al. Varicella-zoster virus distribution in Ramsay Hunt syndrome revealed by polymerase chain reaction. Acta Otolaryngol 1998; 118:145–149. [DOI] [PubMed] [Google Scholar]
- 14.Furuta Y, Fukuda S, Suzuki S, et al. Detection of varicella-zoster virus DNA in patients with acute peripheral facial palsy by the polymerase chain reaction, and its use for early diagnosis of zoster sine herpete. J Med Virol 1997; 52:316–319. [PubMed] [Google Scholar]
- 15.Fujiwara Y, Yanagihara N, Kurata T. Middle ear mucosa in Ramsay Hunt syndrome. Ann Otol Rhinol Laryngol 1990; 99:359–362. [DOI] [PubMed] [Google Scholar]
- 16.Proctor L, Perlman H, Lindsay J, et al. Acute vestibular paralysis in herpes zoster oticus. Ann Otol Rhinol Laryngol 1979; 88:303–310. [DOI] [PubMed] [Google Scholar]
- 17.Zajtchuk JT, Matz GJ, Lindsay JR. Temporal bone pathology in herpes oticus. Ann Otol Rhinol Laryngol 1972; 81:331–338. [DOI] [PubMed] [Google Scholar]
- 18.Iwasaki H, Toda N, Takahashi M, et al. Vestibular and cochlear neuritis in patients with Ramsay Hunt syndrome: a Gd-enhanced MRI study. Acta Otolaryngol 2013; 133:373–377. [DOI] [PubMed] [Google Scholar]
- 19.Ohtani F, Furuta Y, Aizawa H, et al. Varicella-zoster virus load and cochleovestibular symptoms in Ramsay Hunt syndrome. Ann Otol Rhinol Laryngol 2006; 115:233–238. [DOI] [PubMed] [Google Scholar]
- 20.Nakata S, Mizuno T, Naganawa S, et al. 3D-FLAIR MRI in facial nerve paralysis with and without audio-vestibular disorder. Acta Otolaryngol 2010; 130:632–636. [DOI] [PubMed] [Google Scholar]
- 21.Ozeki H, Iwasaki S, Ushio M, et al. The lesion site of vestibular dysfunction in Ramsay Hunt syndrome: a study by click and galvanic VEMP. J Vestib Res 2006; 16:217–222. [PubMed] [Google Scholar]
- 22.Ozdogmus O, Sezen O, Kubilay U, et al. Connections between the facial, vestibular and cochlear nerve bundles within the internal auditory canal. J Anat 2004; 205:65–75. [DOI] [PMC free article] [PubMed] [Google Scholar]
- 23.Labrousse M, Leveque M, Ouedraogo T, et al. An anatomical study of the vestibulocochlear anastomosis (anastomosis of Oort) in humans: preliminary results. Surg Radiol Anat 2005; 27:238–242. [DOI] [PubMed] [Google Scholar]
- 24.Kiang NY-S, Watanabe T, Thomas EC, et al. Discharge Patterns of Single Fibers in the Cat's Auditory Nerve. Cambridge, Massachusetts:MIT Press; 1965. [Google Scholar]