Abstract
Objective
To correlate images from swept source optical coherence tomography microangiography (SS-OMAG) with images from fluorescein angiography (FA) and indocyanine green angiography (ICGA) performed on asymptomatic eyes with intermediate age-related macular degeneration.
Study Design and Methods
A retrospective, observational, consecutive case series of patients with asymptomatic, intermediate AMD in one eye and neovascular AMD in their fellow eye. The patients underwent SS-OMAG, FA, and ICGA, and the images obtained from these three angiographic techniques were compared.
Results
Three patients were identified with intermediate AMD in one eye and symptomatic, neovascular AMD in their fellow eye. The three asymptomatic eyes had drusen and pigmentary abnormalities in the central macula and no evidence of macular fluid on OCT imaging. One patient presented with minimal leakage on FA from the asymptomatic eye. ICGA revealed the presence of central macular plaques, and SS-OMAG revealed type 1 neovascularization corresponding to the plaques. The type 1 neovascularization was visualized using en face slabs that extended from the border of the outer retina to the choriocapillaris (CC), 8 μm beneath Bruch’s membrane.
Conclusions
SS-OMAG identified type 1 neovascularization within ICGA plaques. The ability of OCTA to provide non-invasive, fast, detailed, depth-resolved identification of non-exudative neovascular lesions in eyes with intermediate AMD suggests the need for new terminology that distinguishes between non-exudative intermediate AMD and non-exudative, neovascular intermediate AMD. This distinction should prove useful for managing AMD patients at risk for conversion to late, exudative AMD once natural history studies are performed to better understand disease progression.
Keywords: SSOCT, Angiography, OMAG, AMD, Neovascular, Drusen
INTRODUCTION
The detection of macular neovascularization (MNV) in age-related macular degeneration (AMD) defines the progression from intermediate non-exudative AMD to late, exudative AMD, and this neovascularization has been divided into three types.1 Type 1 and type 2 neovascularization are derived from the choroidal circulation and are referred to as choroidal neovascularization (CNV). Type 1 MNV resides beneath the RPE and type 2 MNV is found between the retina and the RPE. Type 3 neovascularization arises from the retinal circulation and is also referred to as retinal angiomatous proliferation (RAP).1
Over the past decade, the management of MNV has been revolutionized by the introduction of drugs that inhibit vascular endothelial growth factor (VEGF). 2–5 In a typical scenario, anti-VEGF therapy is initiated once symptomatic exudation from MNV is confirmed by one or more imaging modalities that include optical coherence tomography (OCT), fluorescein angiography (FA), and indocyanine green angiography (ICGA).
Historically, exudative AMD was diagnosed by the leakage of fluorescein from neovascularization.6, 7 Since fluorescein is a small molecule and 20% of circulating fluorescein remains unbound to albumin, it is free to leak out of immature vessels and this leakage serves as a useful marker for exudative neovascularization. Over the years, a detailed nomenclature has been developed to describe the different types of MNV based on their fluorescein leakage patterns, and their patterns tend to correspond to the aggressiveness of the lesions.7 In contrast to FA, ICGA uses a dye that is excited by near-infrared light, which is better at penetrating through the RPE. Thus, detailed imaging of the choroidal circulation and type 1 neovascularization is possible, but since ICG is 98% protein bound, the dye doesn’t usually leak from the neovascular lesion.8 ICGA allows for visualization of the actual type 1 neovascular network late in the recirculation phase, and these lesions are visualized as plaques during the late ICGA transit times. The exact incidence of plaques in asymptomatic eyes with presumed intermediate, non-exudative AMD is unknown since ICGA is not routinely performed in eyes with non-exudative AMD. Moreover, studies using ICGA as a screening tool for the early detection of MNV have not been performed since the risks associated with ICGA, which include an allergic or anaphylactic reaction, invasiveness, and discomfort along with the cost have far outweighed the potential benefit of early detection. However, histopathological studies of autopsy eyes with presumed non-exudative AMD have identified subclinical fibrovascular tissue beneath the RPE in these eyes.9, 10.
In contrast to FA and ICGA, OCT is easier to use, non-invasive, comparatively fast, safe, and provides a representative cross-sectional and en face anatomic depiction of macular anatomy. As a result, OCT is the most widely used imaging technique for the screening, diagnosis, and management of late neovascular AMD.6 OCT identifies MNV by the presence of structural changes within the macular layers that result from the leakage of fluid into the retina, under the retina, and under the RPE. OCT imaging has proved useful for the detection and management of MNV because of its ability to noninvasively follow the macular fluid and its response to anti-VEGF therapy. However, with the development of OCT angiography (OCTA), it is now possible to image the actual neovascularization rather than just the VEGF-mediated fluid that leaks into the macula.
OCTA performs multiple B-scans at the same position and detects erythrocyte movement based on changes in the intensity and/or phase information between B-scans. This imaging strategy is then repeated at multiple, closely spaced spatial positions within a defined area and dense volumetric datasets are generated that can be used to create en face and cross-sectional images of the macular microvasculature without a need of exogenous dyes.11–14 One distinct advantage of OCTA compared with traditional angiography and routine intensity-based OCT imaging is the ability to non-invasively detect MNV before the macular anatomy and the vision are disturbed. Early detection of MNV before leakage should result in better early monitoring of patients with intermediate AMD who are at high-risk of conversion to late neovascular AMD. After all, early detection and treatment of pathological neovascularization is thought to be important in preserving as much vision as possible in these patients who convert to late neovascular AMD. However, it is unclear at this time whether intervention before the lesion becomes symptomatic provides long-term visual acuity benefit.
In this retrospective report, we have performed swept source OCT microangiography (SS-OMAG) imaging of patients diagnosed with neovascular AMD in one eye and asymptomatic, non-exudative AMD in their fellow eye. These patients had undergone ICGA for the neovascular disease in one eye, but images of their asymptomatic fellow eyes were obtained as well. In their asymptomatic eyes, ICGA imaging revealed the presence of macular plaques, and these plaques were studied with SS-OCTA imaging.
PATIENTS AND METHODS
Patients were enrolled at the Bascom Palmer Eye Institute in a prospective OCT imaging study. The Institutional Review Board of the University Of Miami Miller School of Medicine approved the study and an informed consent to participate in the prospective OCT study was obtained from all patients. The study was performed in accordance with the tenets of the Declaration of Helsinki and compliant with the Health Insurance Portability and Accountability Act of 1996.
OCT angiographic imaging was performed by the use of a modified CIRRUS prototype provided by Carl Zeiss Meditec Inc., (Dublin, CA) containing a swept source laser with a central wavelength of 1050nm (1000–1100 nm full width) and a speed of 100,000 A-scans per second. The ZEISS 1050nm SS-OCT prototype had a full width at half maximum (FWHM) axial resolution of ~5 μm in tissue and a lateral resolution at the retinal surface estimated at ~14 μm. To image the retinal and choroidal vasculatures, a repeated B-mode scan protocol was used to acquire volumetric datasets, which were then processed using a method known as OCT microangiography (OMAG).15–19 The OMAG algorithm used variations in both the intensity and phase information between sequential B-scans at the same position when creating an en face blood flow image. The OMAG scan was centered on the fovea and measured 3 mm X 3 mm on the retina. In the fast, transverse, x-axis scanning direction, 300 A-lines were used to form one single B-scan. Four consecutive B-scans were performed at each fixed location before proceeding to the next transverse location on the retina. In the slow scanning direction (i.e. y-axis), there were 300 positions over a 3-mm distance. The spacing between adjacent B-scan positions was 10 μm. The time difference between two successive B-scans was roughly 3.8 ms, which corresponded to a B-scan acquisition rate of 263 B-scans per second.
The OMAG algorithm generates OCT angiograms that contain the retinal, choriocapillaris, and choroidal microvasculature, as well as the more usual OCT tomogram containing the structural intensity information. A semi-automated macular slab segmentation algorithm was used on the structural OCT volume, and the layer locations applied to the flow volumes to create an en face projection of the vascular networks in individual layers [REF]. One layer was segmented between the outer retinal layer (ORL), which was the bottom boundary of the outer plexiform layer, to the choriocapillaris (CC), which was about 8 um beneath Bruch’s membrane. This segmentation scheme has been previously described.19 Colors were used to code for different layers to give a better depth-encoded visualization of the neovascularization. The microvasculature from the outer retina to the CC was colored pink and the rest of the choroidal vasculature was colored green. It is possible to see some projection artifacts of the retinal vasculature that were colored in red. Structural B-scans were also generated in which each B-scan was averaged from the four repeated scans at the same position, shown as usual in grayscale. These could be overlaid with color-coded OMAG B-scans. On these images, the color red was used to represent both the superficial retinal vasculature and the choriocapillaris, green represented both the middle retinal vasculature and the choroidal vasculature, and pink represented the flow between the ORL and CC. The three-dimensional structure of the retina and its microvasculature were rendered and projected using Matlab software. The segmentation allowed for the visualization of the microvasculature in different layers of the retina and choroid, and a maximum projection method within each layer was used to create the en face images of interest. The projection artifacts were minimized for better visualization of the MNV using a technique described elsewhere.20
The qualitative OMAG en face images were compared with early and late-phase FA and ICGA images. Abnormalities in the OMAG images were identified qualitatively based on deviations from the expected location, shape, size, and distribution of the microvasculature in the various layers. The averaged OCT B-scans were also examined in the usual manner, and the cross-sectional retinal images were compared with the en face intensity and flow images.
Patients with AMD also underwent a comprehensive ocular examination and imaging tests as part of their routine evaluation. The imaging tests included color fundus imaging (Topcon, Tokyo, Japan), autofluorescence (AF), FA and ICG imaging (Heidelberg Engineering, Heidelberg, Germany), and spectral domain OCT (SD-OCT) imaging (Cirrus; Carl Zeiss Meditec, Dublin, CA). SD-OCT imaging included the 200×200 macular raster scan pattern. Asymptomatic eyes with subclinical MNV were identified by the presence of an ICGA plaque in the absence of visual symptoms. This finding was confirmed by at least two retina specialists (LR and PJR). Plaques were identified by ICGA imaging as well delineated areas of increased fluorescence measuring at least one-half disc area in the size within the central macula and most evident during the late transit frames of the ICGA imaging study.
RESULTS
Three eyes of three consecutive patients with neovascular AMD in one eye and asymptomatic AMD in the fellow eye underwent FA and ICGA imaging, in addition to research imaging using the Zeiss prototype 1-μm SS-OCT instrument. For each case, the early and late frames of the FA and ICGA are shown along with the en face subretinal flow images from the choriocapillaris. Two representative B-scans are shown, one depicting the typical intensity image and the layer-specific, color-coded microvascular flow information was superimposed on the B-scan.
Case #1
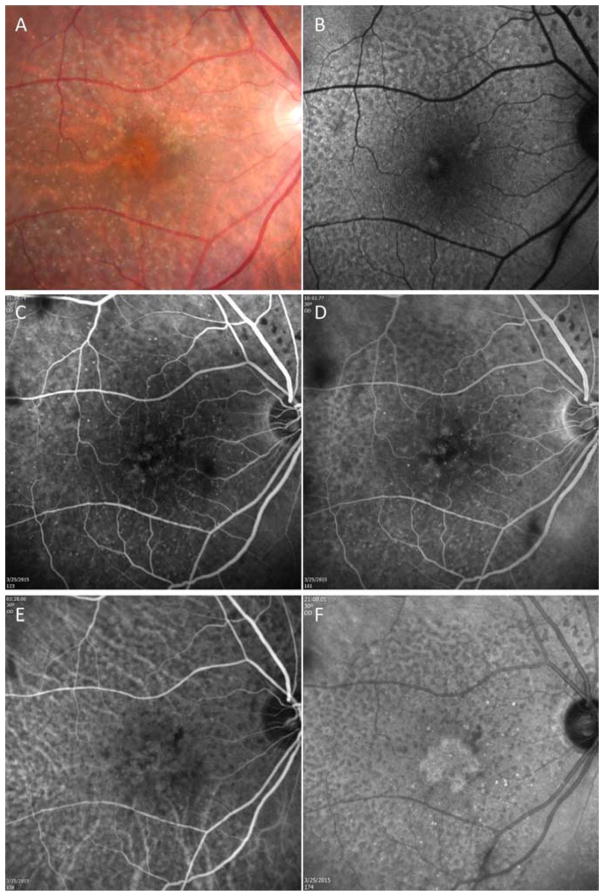
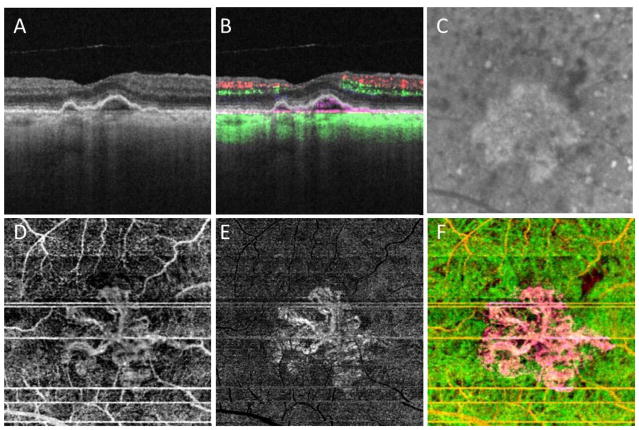
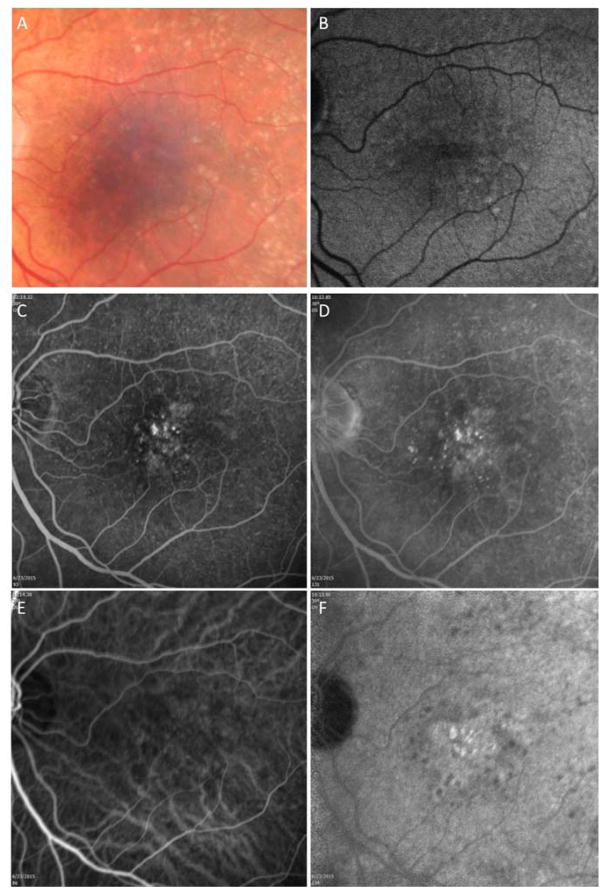
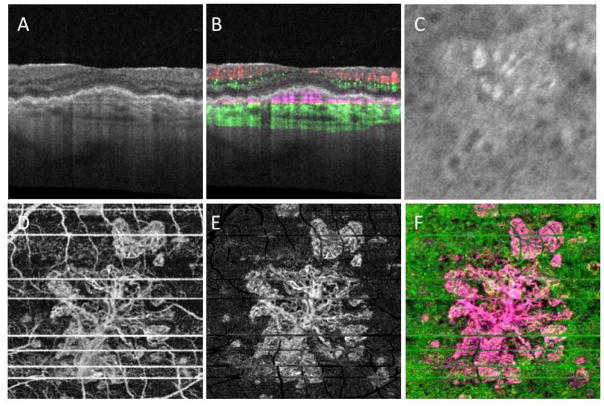
A 78 year-old man complained of blurred vision in his left eye. Best corrected visual acuity (BCVA) was 20/20 and 20/25 in the right and left eyes, respectively. On evaluation, the left eye was diagnosed with new onset MNV. The right eye was asymptomatic and on routine SD-OCT B-scan imaging there was no evidence of macular fluid. Color fundus, AF, FA and ICGA imaging were performed (Figure 1A–F). Color fundus imaging revealed central drusen and pigmentary changes along with perimacular reticular pseudodrusen (RPD), which are also evident on AF imaging (Figure 1A, B). FA imaging showed some punctate areas of hyperfluorescence without leakage (Figure 1C and D). ICGA imaging also confirmed the presence of RPD and revealed a subfoveal plaque (Figure 1E and F). SS-OCTA imaging was performed (Figure 2A–F). The typical cross-sectional intensity-based B-scan images revealed small retinal pigment epithelial elevations consistent with typical drusen (Figure 2A). However, the cross-sectional and en face SS-OCT angiographic images showed evidence of flow within the presumed drusen (Figure 2B) and the en face images revealed a multilobular neovascular lesion occupying the same position as the plaque (Figure 2D–F). The en face flow image corresponded well with the magnified image of the ICGA plaque from the same area of the macula imaged using SS-OMAG (Figure 2C).
Figure 1.
Case #1: Color fundus, autofluorescence (AF), fluorescein, and indocyanine green (ICG) angiography imaging of an asymptomatic eye from a patient with exudative age-related macular degeneration in their fellow eye. (A) Color fundus imaging of drusen, pigmentary abnormalities, and reticular pseudodrusen (RPD). (B) AF imaging of RPD. (C, D) Early and late frames from a fluorescein angiogram showing some early focal hyperfluorescence but no obvious late leakage and RPD surrounding the central macula. (E, F) Early and late frames from an ICGA showing a central plaque in the late frames and RPD surrounding the central macula.
Figure 2.
Case #1: Swept source optical coherence tomography microangiography (SS-OMAG) of an asymptomatic eye from a patient with exudative age-related macular degeneration in their fellow eye. (A) Standard OCT B-scan through the fovea showing elevations of the RPE consistent with typical drusen, but no evidence of macular fluid. (B) Standard OCT B-scan through the fovea with color-coded flow represented as red and green for the retinal microvasculature, pink for flow under the RPE and within the inner CC, and green for flow in the remainder of the choroid. Note the pink coloration under the RPE elevations that were thought to be a typical drusen on the routine OCT B-scan. (C) Magnified area of the plaque seen on late ICGA corresponding to the same area scanned by SS-OMAG. (D–F) SS-OMAG en face images of a slab between the outer retinal layer, which was the bottom boundary of the outer plexiform layer, to the choriocapillaris, which was about 8 um beneath Bruch’s membrane. (D) SS-OMAG en face image showing a multilobular neovascular complex best observed using a slab from outer retinal layer (ORL), just the RPE, to the inner portion choriocapillaris (CC). (E) The same en face image showed in panel D following removal of projection artifacts. (F) Composite, color-coded en face SS-OMAG flow image encompassing the outer retinal layer and the choroid revealing the multilobular type 1 neovascularization in pink.
Case #2
An 82-year-old woman complained of worsening vision in the left eye. She had a history of prior anti-VEGF injections in her left eye for neovascular AMD with the last injection given 5 months prior to this current complaint. BCVA was 20/20 and 20/300 in the right and left eyes, respectively. Color fundus, AF, FA, ICGA and OCT imaging were performed and recurrent neovascular activity was diagnosed in the left eye. On color fundus and AF imaging, the asymptomatic right eye showed evidence of macular drusen and pigmentary abnormalities along with RPD (Figure 3A, B). Early and late transit frames from FA revealed evidence of focal hyperfluorescence early with late staining consistent with non-exudative AMD (Figure 3C and D). Early and late transit frames from the ICGA revealed a central macular plaque with foveal sparing (Figure 3E and F). Both the FA and ICGA images show RPD surrounding the central macula. SS-OCTA imaging was performed (Figure 4A–F). The typical cross-sectional intensity-based B-scan images revealed small RPE elevations consistent with typical drusen (Figure 4A). However, the cross-sectional and en face SS-OCT angiographic images revealed evidence of flow within the presumed drusen (Figure 4B) and the en face images revealed a circular neovascular lesion with foveal sparing occupying the same position as the plaque (Figure 4D, E and F). The en face flow image corresponded well with the magnified image of the ICGA plaque from the same area of the macula imaged using SS-OMAG (Figure 4C).
Figure 3.
Case #2: Color fundus, autofluorescence (AF), fluorescein, and indocyanine green (ICG) angiography imaging of an asymptomatic eye from a patient with exudative age-related macular degeneration in their fellow eye. (A) Color fundus imaging of drusen, pigmentary abnormalities, and reticular pseudodrusen (RPD). (B) AF imaging of RPD. (C and D) Early and late frames from a fluorescein angiogram showing some early focal hyperfluorescence but no obvious late leakage and reticular pseudodrusen (RPD) surrounding the central macula. (E and F) Early and late frames from an ICG angiogram showing a central plaque in the late frames and RPD surrounding the central macula.
Figure 4.
Case #2: Swept source optical coherence tomography microangiography (SS-OMAG) of an asymptomatic eye from a patient with exudative age-related macular degeneration in their fellow eye. (A) Standard OCT B-scan through the fovea showing elevations of the RPE consistent with typical drusen, but no evidence of macular fluid. (B) Standard OCT B-scan through the fovea with color-coded flow represented as red and green for the retinal microvasculature, pink for flow under the RPE and within the inner CC, and green for flow in the remainder of the choroid. Note the pink coloration under the RPE elevations that were thought to be a typical, confluent drusen on the routine OCT B-scan. (C) Magnified area of the plaque seen on late ICGA corresponding to the same area scanned by SS-OMAG. (D–F) SS-OMAG en face images of a slab between the outer retinal layer, which was the bottom boundary of the outer plexiform layer, to the choriocapillaris, which was about 8 um beneath Bruch’s membrane. (D) SS-OMAG en face image showing a circular neovasculature complex best observed using a slab from outer retinal layer (ORL), just the RPE, to the inner portion choriocapillaris (CC). (E) The same en face image showed in panel D following removal of projection artifacts. (F) Composite, color-coded en face SS-OMAG flow image encompassing the outer retinal layer and the choroid revealing the circular type 1 neovascularization in pink.
Case #3
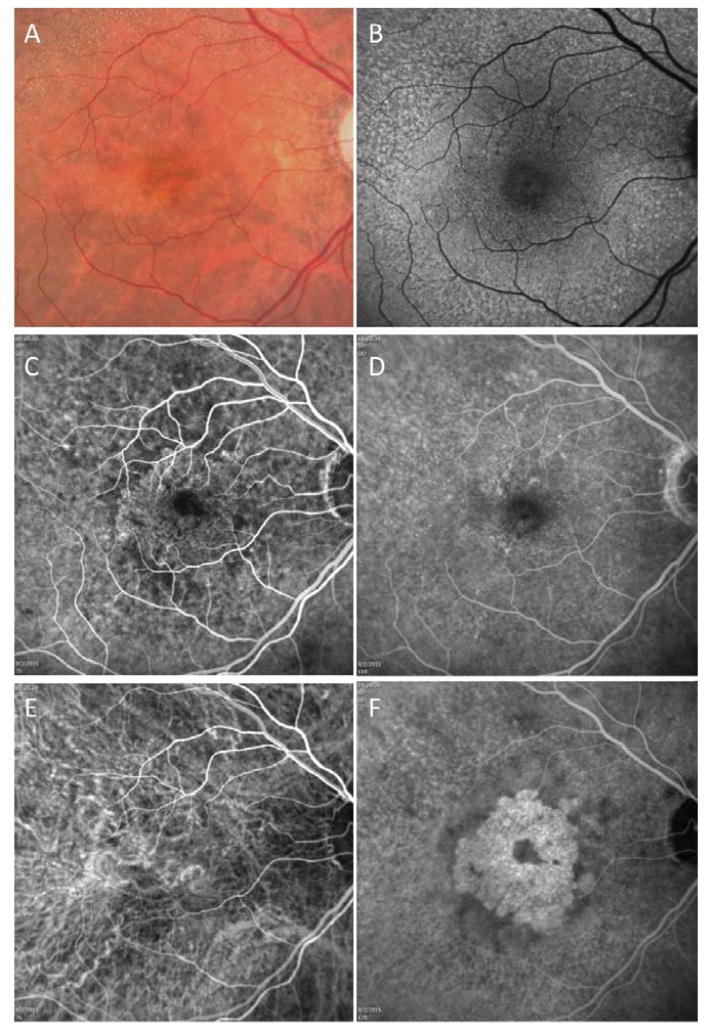
An 81-year-old man complained of blurred vision in his right eye. BCVA was 20/100 and 20/30 in the right and left eyes, respectively. Color fundus, AF, FA and ICGA imaging were performed. The right eye was diagnosed with MNV. Figure 5 shows the images of the asymptomatic left eye. Color fundus and AF imaging revealed some typical drusen and pigmentary changes and the left eye was diagnosed as intermediate AMD (figure 5A and B). Early and late transit frames from the FA revealed evidence of stippled hyperfluorescence with questionable late leakage (Figure 5C and D). Early and late transit frames from the ICGA revealed a central macular plaque (Figure 5E and F).
Figure 5.
Case #3: Color fundus, autofluorescence (AF), fluorescein, and indocyanine green (ICG) angiography imaging of an asymptomatic eye from a patient with exudative age-related macular degeneration in their fellow eye. (A) Color fundus imaging of drusen and pigmentary abnormalities. (B) AF imaging of reticular pseudodrusen (RPD) more evident around the superior arcade. (C and D) Early and late frames from a fluorescein angiogram showing some early stippled hyperfluorescence and subtle late leakage consistent with type 1 neovascularization. (E and F) Early and late frames from an ICG angiogram showing a central multilobular plaque in the late frames.
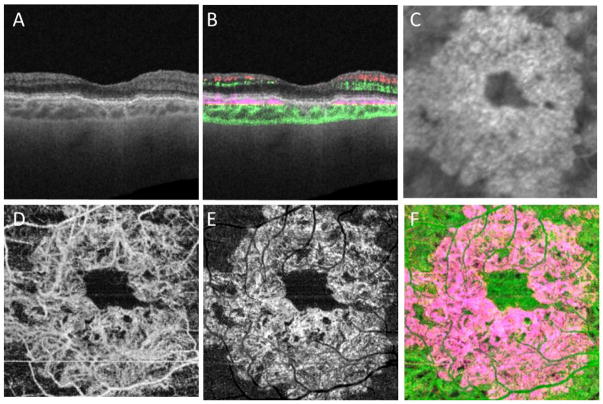
SS-OCTA imaging was performed (Figure 6A–F). The typical cross-sectional intensity-based B-scan images revealed small retinal pigment epithelial elevations consistent with typical drusen (Figure 6A). However, the cross-sectional and en face SS-OCT angiographic images revealed evidence of flow within the presumed drusen (Figure 6B) and the en face images revealed a multilobular neovascular lesion occupying the same position as the plaque (Figure 6D, E and F). The en face flow image corresponded well with the magnified image of the ICGA plaque from the same area of the macula imaged using SS-OMAG (Figure 6C).
Figure 6.
Case #3: Swept source optical coherence tomography microangiography (SS-OMAG) of an asymptomatic eye from a patient with exudative age-related macular degeneration in their fellow eye. (A) Standard OCT B-scan through the fovea showing elevations of the RPE consistent with typical, confluent drusen, but no evidence of macular fluid. (B) Standard OCT B-scan through the fovea with color-coded flow represented as red and green for the retinal microvasculature, pink for flow under the RPE and within the inner CC, and green for flow in the remainder of the choroid. Note the pink coloration under the RPE elevations that were thought to be a typical drusen on the routine OCT B-scan. (C) Magnified area of the plaque seen on late ICGA corresponding to the same area scanned by SS-OMAG. (D–F) SS-OMAG en face images of a slab between the outer retinal layer, which was the bottom boundary of the outer plexiform layer, to the choriocapillaris, which was about 8 um beneath Bruch’s membrane. (D) SS-OMAG en face image showing a multilobular neovasculature complex best observed using a slab from outer retinal layer (ORL), just the RPE, to the inner portion choriocapillaris (CC). (E) The same en face image showed in panel D following removal of projection artifacts. (F) Composite, color-coded en face SS-OMAG flow image encompassing the outer retinal layer and the choroid revealing the circular type 1 neovascularization in pink.
DISCUSSION
The presence of ICG plaques in the absence of obvious clinical, angiographic, or OCT signs of exudation in eyes with AMD has been described previously.21, 22 These subclinical ICG plaques have been reported to enlarge over time without significant changes in macular thickness, macular sensitivity, retinal anatomy, or visual acuity.21, 23 However, the detection of subclinical MNV required the use of ICGA, which is an invasive procedure associated with the rare but serious risk of an allergic or anaphylactic reaction. Moreover, ICGA is expensive, time consuming, resource intensive, and not routinely performed or reimbursed by insurances when performed on patients with non-exudative AMD. Due to these limitations, angiographic monitoring of eyes with intermediate AMD has never become routine; however, this is about to change with the availability of OCT angiography.
In the three cases presented in this series, asymptomatic eyes with intermediate AMD were imaged with ICGA because the patient was being evaluated for active, symptomatic neovascularization in their fellow eye. When imaged with the ZEISS 1050nm SS-OCT prototype system and the output processed using the OMAG algorithm, type 1 neovascularization was identified and its location corresponded to the central macular plaque seen on ICGA imaging. In our patients, the presence of MNV would have remained unnoticed if the FA and ICGA had not been done and confirmed by OCT angiography. On fundus examination and routine OCT imaging, the eye had been diagnosed with intermediate AMD; however OCTA revealed a subclinical MNV. This subclinical MNV was contained within the irregular elevations of the RPE that had been diagnosed as typical drusen.21 However, this landscape of typical drusen on routine exam and OCT imaging was actually a irregular, low-lying fibrovascular RPE detachment containing reflective material that corresponded to the neovascularization. This type of configuration on OCT imaging is likely to be indicative of subclinical MNV rather than just coalescent drusen. Thus, while it is not possible to identify with certainty whether a small, low-lying PED is vascularized using routine OCT imaging, SS-OMAG imaging should be able to distinguish between vascularized and non-vascularized lesions and replace ICGA for the identification of plaques in the central macula. Moreover, new terminology is needed to describe the different stages of AMD. One possibility would be to subdivide intermediate AMD into non-neovascular intermediate AMD and neovascular intermediate AMD with the development of exudative AMD signaling the progression to late AMD.
The use of SS-OMAG to diagnose subclinical type 1 neovascularization has some obvious advantages when following patients with all forms of AMD and for screening patients to be enrolled in clinical trials, particularly patients being included in trials designed to test new treatments for non-exudative AMD. The biggest advantage of SS-OMAG over ICGA is that it can be easily repeated at follow-up visits because it is fast, safe, and non-invasive. With the widespread availability of OCT angiography, it will be possible to answer many of the questions surrounding these subclinical neovascular lesions, such as their prevalence, their natural history before they become symptomatic, and their response to anti-VEGF therapy if the fellow eye is treated or even if the eye with the subclinical lesion is treated. While large studies are needed to better understand the natural history of these subclinical neovascular lesions, it seems reasonable to assume that these eyes are more likely to progress to active, symptomatic forms of exudative AMD than eyes with non-neovascular intermediate AMD. These eyes may need to be followed more closely than eyes with no evidence of subclinical MNV. When recruiting non-exudative AMD patients into clinical trials, it may be worthwhile to stratify patients at baseline with OCT angiography to determine if subclinical MNV is present to better understand the effect of new treatments on these lesions. After all, if these eyes with subclinical MNV are not balanced between treatment groups at baseline, then the results of these trials may be confounded, especially if subclinical neovascularization responds differently to emerging therapies, such as the next-generation sub-threshold laser treatments or drugs for non-exudative AMD. Moving forward, it seems reasonable to include OCT angiography as an imaging technique that needs to be performed at baseline and at follow-up visits for all trials enrolling patients with non-exudative AMD.
The limitations of this study include the small number of eyes, the lack of a commercially available swept-source OCT instrument capable of angiography, and the lack of a fully automated algorithm. It remains to be seen whether OCT angiography performed with spectral domain OCT instruments is as sensitive as swept source OCT in detecting these subclinical lesions. In addition, the high-density scans that were performed to obtain these angiographic images covered a scan area of only 3mm by 3mm within the central macula. As this technology evolves and faster scanning rates are achieved, the ability to scan larger areas and areas outside the central macula should become routinely available.
In summary, our results demonstrate the utility of swept-source OCT angiography for the diagnosis of subclinical type 1 neovascularization in asymptomatic eyes with presumed intermediate AMD. The ability to easily detect subclinical neovascularization in these eyes suggests that intermediate AMD needs to be classified as either non-neovascular or neovascular intermediate AMD. With the growing availability of OCT angiography, it seems likely that traditional fluorescein and ICG angiography will no longer be needed for AMD patients with central macular lesions. The ability to non-invasively acquire both structure and flow information from a single OCT dataset suggests that OCT imaging is all that will be needed in the future to manage a patient with AMD.
Summary Statement.
Swept source optical coherence tomography microangiography of asymptomatic eyes with intermediate age-related macular degeneration identified subclinical type 1 choroidal neovascularization corresponding to indocyanine green angiographic plaques.
Acknowledgments
Research supported by grants from Carl Zeiss Meditec, Inc. (Dublin, CA), the National Eye Institute (R01EY024158), the Macula Vision Research Foundation, the Emma Clyde Hodge Memorial Foundation, the Feig Family Foundation, an unrestricted grant from the Research to Prevent Blindness, Inc., New York, NY and the National Eye Institute Center Core Grant (P30EY014801) to the Department of Ophthalmology, University of Miami Miller School of Medicine
Footnotes
Disclosures:
Drs. Wang, Gregori, and Rosenfeld received research support from Carl Zeiss Meditec, Inc. Dr. Gregori and the University of Miami co-own a patent that is licensed to Carl Zeiss Meditec, Inc. Dr. Rosenfeld received research support from Acucela, Apellis, Genentech/Roche, GlaxoSmithKline, Neurotech, Ocata Therapeutics, and Tyrogenex. He is a consultant for Achillion, Acucela, Alcon, Bayer, Chengdu Kanghong Biotech, CoDa Therapeutics, Genentech/Roche, Healios K.K., Merck, Regeneron, Stealth, and Tyrogenex.
Dr. Wang and the Oregon Health & Science University co-own a patent that is licensed to Carl Zeiss Meditec, Inc. Dr. Wang received an innovative research award from Research to Prevent Blindness.
Dr. Zhang, Dr Chen and Dr. Luiz Roisman have no disclosures.
Drs. An, Durbin, and Stetson are employed by Carl Zeiss Meditec, Inc.
References
- 1.Freund KB, Zweifel SA, Engelbert M. Do we need a new classification for choroidal neovascularization in age-related macular degeneration? Retina. 2010;30:1333–49. doi: 10.1097/IAE.0b013e3181e7976b. [DOI] [PubMed] [Google Scholar]
- 2.Brown DM, Kaiser PK, Michels M, Soubrane G, Heier JS, Kim RY, et al. Ranibizumab versus verteporfin for neovascular age-related macular degeneration. The New England journal of medicine. 2006;355:1432–44. doi: 10.1056/NEJMoa062655. [DOI] [PubMed] [Google Scholar]
- 3.Rosenfeld PJ, Brown DM, Heier JS, Boyer DS, Kaiser PK, Chung CY, et al. Ranibizumab for neovascular age-related macular degeneration. The New England journal of medicine. 2006;355:1419–31. doi: 10.1056/NEJMoa054481. [DOI] [PubMed] [Google Scholar]
- 4.Comparison of Age-related Macular Degeneration Treatments Trials Research G. Martin DF, Maguire MG, Fine SL, Ying GS, Jaffe GJ, et al. Ranibizumab and bevacizumab for treatment of neovascular age-related macular degeneration: two-year results. Ophthalmology. 2012;119:1388–98. doi: 10.1016/j.ophtha.2012.03.053. [DOI] [PMC free article] [PubMed] [Google Scholar]
- 5.Yannuzzi LA, Freund KB, Takahashi BS. Review of retinal angiomatous proliferation or type 3 neovascularization. Retina. 2008;28:375–84. doi: 10.1097/IAE.0b013e3181619c55. [DOI] [PubMed] [Google Scholar]
- 6.Gess AJ, Fung AE, Rodriguez JG. Imaging in neovascular age-related macular degeneration. Seminars in ophthalmology. 2011;26:225–33. doi: 10.3109/08820538.2011.582533. [DOI] [PubMed] [Google Scholar]
- 7.Barbazetto I, Burdan A, Bressler NM, Bressler SB, Haynes L, Kapetanios AD, et al. Photodynamic therapy of subfoveal choroidal neovascularization with verteporfin: fluorescein angiographic guidelines for evaluation and treatment--TAP and VIP report No. 2. Archives of ophthalmology. 2003;121:1253–68. doi: 10.1001/archopht.121.9.1253. [DOI] [PubMed] [Google Scholar]
- 8.Flower RW. Extraction of choriocapillaris hemodynamic data from ICG fluorescence angiograms. Investigative ophthalmology & visual science. 1993;34:2720–9. [PubMed] [Google Scholar]
- 9.Green WR, McDonnell PJ, Yeo JH. Pathologic features of senile macular degeneration. Ophthalmology. 1985;92:615–27. [PubMed] [Google Scholar]
- 10.Spraul CW, Grossniklaus HE. Characteristics of Drusen and Bruch’s membrane in postmortem eyes with age-related macular degeneration. Archives of ophthalmology. 1997;115:267–73. doi: 10.1001/archopht.1997.01100150269022. [DOI] [PubMed] [Google Scholar]
- 11.Makita S, Hong Y, Yamanari M, Yatagai T, Yasuno Y. Optical coherence angiography. Optics express. 2006;14:7821–40. doi: 10.1364/oe.14.007821. [DOI] [PubMed] [Google Scholar]
- 12.Jia Y, Tan O, Tokayer J, Potsaid B, Wang Y, Liu JJ, et al. Split-spectrum amplitude-decorrelation angiography with optical coherence tomography. Optics express. 2012;20:4710–25. doi: 10.1364/OE.20.004710. [DOI] [PMC free article] [PubMed] [Google Scholar]
- 13.Moult E, Choi W, Waheed NK, Adhi M, Lee B, Lu CD, et al. Ultrahigh-speed swept-source OCT angiography in exudative AMD. Ophthalmic surgery, lasers & imaging retina. 2014;45:496–505. doi: 10.3928/23258160-20141118-03. [DOI] [PMC free article] [PubMed] [Google Scholar]
- 14.Nagiel A, Sadda SR, Sarraf D. A Promising Future for Optical Coherence Tomography Angiography. JAMA ophthalmology. 2015;133:629–30. doi: 10.1001/jamaophthalmol.2015.0668. [DOI] [PubMed] [Google Scholar]
- 15.Huang Y, Zhang Q, Thorell MR, An L, Durbin MK, Laron M, et al. Swept-source OCT angiography of the retinal vasculature using intensity differentiation-based optical microangiography algorithms. Ophthalmic surgery, lasers & imaging retina. 2014;45:382–9. doi: 10.3928/23258160-20140909-08. [DOI] [PMC free article] [PubMed] [Google Scholar]
- 16.An L, Subhush HM, Wilson DJ, Wang RK. High-resolution wide-field imaging of retinal and choroidal blood perfusion with optical microangiography. Journal of biomedical optics. 2010;15:026011. doi: 10.1117/1.3369811. [DOI] [PMC free article] [PubMed] [Google Scholar]
- 17.Wang RK, An L, Francis P, Wilson DJ. Depth-resolved imaging of capillary networks in retina and choroid using ultrahigh sensitive optical microangiography. Optics letters. 2010;35:1467–9. doi: 10.1364/OL.35.001467. [DOI] [PMC free article] [PubMed] [Google Scholar]
- 18.Wang RK, Jacques SL, Ma Z, Hurst S, Hanson SR, Gruber A. Three dimensional optical angiography. Optics express. 2007;15:4083–97. doi: 10.1364/oe.15.004083. [DOI] [PubMed] [Google Scholar]
- 19.Zhang Qinqin, PhD, Chen Chieh-Li, PhD, Legarreta Andrew D, BA, Durbin Mary K, PhD, An Lin, PhD, Sharma Utkarsh, PhD, Stetson Paul F, PhD, Legarreta John E, MD, Roisman Luiz, MD, Gregori Giovanni, PhD, Rosenfeld Philip J., MD, PhD Swept Source OCT Angiography of Neovascular Macular Telangiectasia Type 2. Retina Journal. 2015 doi: 10.1097/IAE.0000000000000840. In Press. [DOI] [PMC free article] [PubMed] [Google Scholar]
- 20.Zhang Anqi, Zhang Qinqin, Wang RK. Minimizing projection artifacts for accurate presentation of choroidal neovascularization in OCT micro-angiography. Biomedical optics express. 2015;6:14. doi: 10.1364/BOE.6.004130. [DOI] [PMC free article] [PubMed] [Google Scholar]
- 21.Querques G, Srour M, Massamba N, Georges A, Ben Moussa N, Rafaeli O, et al. Functional characterization and multimodal imaging of treatment-naive “quiescent” choroidal neovascularization. Investigative ophthalmology & visual science. 2013;54:6886–92. doi: 10.1167/iovs.13-11665. [DOI] [PubMed] [Google Scholar]
- 22.Hanutsaha P, Guyer DR, Yannuzzi LA, Naing A, Slakter JS, Sorenson JS, et al. Indocyanine-green videoangiography of drusen as a possible predictive indicator of exudative maculopathy. Ophthalmology. 1998;105:1632–6. doi: 10.1016/S0161-6420(98)99030-3. [DOI] [PubMed] [Google Scholar]
- 23.Querques G, Tran TH, Forte R, Querques L, Bandello F, Souied EH. Anatomic response of occult choroidal neovascularization to intravitreal ranibizumab: a study by indocyanine green angiography. Graefe’s archive for clinical and experimental ophthalmology. 2012;250:479–84. doi: 10.1007/s00417-011-1831-5. [DOI] [PubMed] [Google Scholar]


