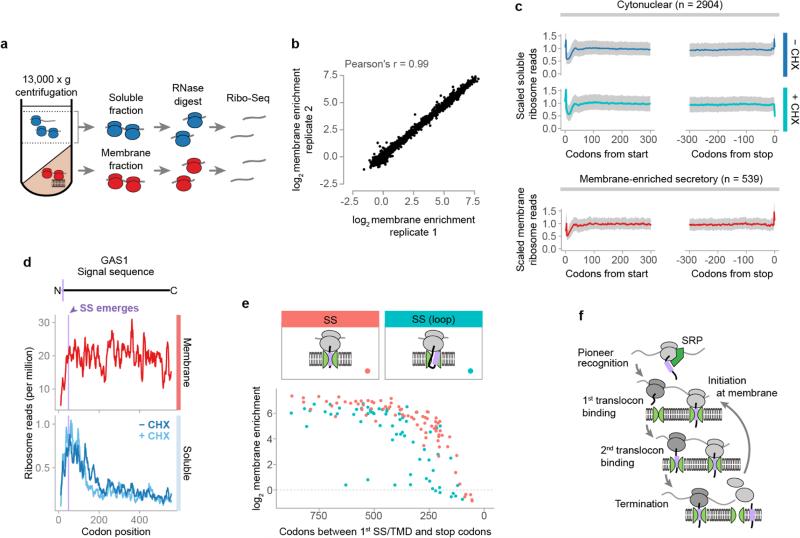
Extended Data Figure 1. Cotranslational membrane enrichment.
a, Crude lysates were fractionated, and then polysomes were recovered by sucrose gradient ultracentrifugation and used for ribosome profiling. b, Enrichment of ribosome-protected mRNA reads in the membrane polysome fractions over the soluble polysome fractions from two biological replicates. Every dot represents one ORF. c, Metagene plots of soluble polysome ribosome-protected reads of transcripts encoding proteins lacking ER targeting signals (top), or of membrane-bound polysome protected reads of transcripts encoding secretory proteins that were at least 2-fold membrane-enriched (bottom). For each ORF, ribosome-protected reads at each position were scaled by dividing by the mean reads per codon of the ORF, excluding first two and last two sense codons. The median scaled reads at each position are plotted as a line, and the interquartile range is shaded in gray. d, Ribosome-protected reads at each codon of an example secreted protein, β-1,3-glucanosyltransferase (GAS1), a model SRP-independent protein12. Topology is indicated above, with the signal sequence in lavender. The position where the signal begins to emerge from the ribosome exit tunnel is indicated. e, The number of codons remaining after the encoding of the first residue of a SS, and the corresponding membrane enrichment per SS containing ORF. Signal sequences were divided between those that bind Ssh1p directly upon exposure and those that require a looped conformation (>90 codons after the first SS codon) 16. f, Transcripts remain at the membrane by subsequent translocon binding, thus the small soluble fraction comprises mRNA undergoing initial targeting.

