

Abstract
Mechanical forces play critical roles in the function of living cells. However, the underlying mechanisms of how forces influence nuclear events remain elusive. Here, we show that chromatin deformation as well as force-induced transcription of a green-fluorescent-protein (GFP) tagged bacterial-chromosome dihydrofolate reductase (DHFR) transgene can be visualized in a living cell by using three-dimensional magnetic twisting cytometry to apply local stresses on the cell surface via an Arg-Gly-Asp-coated magnetic bead. Chromatin stretching depended on loading direction. DHFR transcription upregulation was sensitive to load direction and proportional to the magnitude of chromatin stretching. Disrupting filamentous actin or inhibiting actomyosin contraction abrogated or attenuated force-induced DHFR transcription, whereas activating endogenous contraction upregulated force-induced DHFR transcription. Our findings suggest that local stresses applied to integrins propagate from the tensed actin cytoskeleton to the LINC complex and then through lamina-chromatin interactions to directly stretch chromatin and upregulate transcription.
It is increasingly evident that both soluble growth factor-mediated chemical signaling and the physical microenvironment and niche-mediated mechanical signaling play critical roles in living cells and tissues1, 2. Yet we still know relatively little about how mechanotransduction actually regulates gene expression, protein synthesis, and other vital biological functions. One major challenge in understanding the role of mechanotransduction inside the nucleus is the intrinsic difficulty separating direct force-induced changes in proteins and genes from intracellular biochemical cascades induced by force-induced conformational change or unfolding of proteins such as integrin, talin, and vinculin at the cell surface3–6. From the findings of force-induced surface molecule activation and the presumed model that a local force only induces a local deformation, it is generally accepted that direct force impacts occur at the cell surface2 and that deep cytoplasmic or nuclear mechanotransduction only occurs via intermediate biochemical activities or regulatory proteins in the cytoplasm/nucleus. One example of such a biochemical pathway connecting cell surface deformation with nuclear biochemical signaling is the discovery of the matrix rigidity responsive element YAP/TAZ as a cytoplasmic mechanotransducer which translocates to the nucleus to regulate differentiation and proliferation7.
However, the activation of Src molecules on the endosomal membrane deep inside the cytoplasm ~100–300 ms after applying a local force via integrins demonstrates how a local force can generate a long-distance deformation impact in a living cell8. Subsequent work examining activation of a different enzyme, Rac1, demonstrated that Rac1’s activation by force is rapid (<300 ms), direct (no intermediate biochemical activities), long-distance (can be activated on the other side of the cell from the point of a local force), and does not depend on prior Src activation9. In sharp contrast, Platelet-derived-growth-factor (PDGF)-induced Rac activation depends on the activation of the upstream molecule Src10. In addition, a recent report has provided experimental evidence that the coilin-SMN protein complexes in a sub-nuclear structure, the Cajal body, can be directly dissociated by force (of physiologic magnitudes) applied via integrins at the cell surface11, extending published reports that external forces alter mechanical and biological responses in the nucleus12–16. More recent work has shown that Lamin A/C, a protein network that connects the LINC (linker of nucleoskeleton and cytoskeleton) complex with chromatin, is a mechanosensor, responds to tissue stiffness, and regulates differentiation17. Lamin A/C also regulates translocation and signaling of a mechanosensitive transcription factor18. In addition, chromatin decondensation is shown to depend on the degree of cell spreading, cell shape, and cytoskeletal contractility19. Applying force directly on an isolated nucleus through nesprin-1 phosphorylates inner nuclear membrane protein Emerin and stiffens the nucleus20, suggesting that forces might have a direct effect on nuclear structure and function. Together these reports suggest that it may be possible to directly alter the condensation status of the chromatin by local forces applied via integrins. However, evidence that a cell surface force can have a direct impact on chromatin structures is still lacking. Complicating the issue is the fact that chromosomes are stiff structures with Young’s modulus ranging from ~300 Pa21 in isolated chromosomes to 1–5 kPa in living cells22. Hence, it is not clear that interphase chromatin can be stretched by local surface forces of physiologic magnitudes even given the previously observed deformation of other intranuclear structures such as Cajal bodies11 or nucleoli13. Furthermore, even if chromatin could be decondensed or deformed by a surface force, it remains unclear if the force would alter gene expression. Previous work has demonstrated that tethering an acidic peptide to chromatin both decondenses large-scale chromatin structure and relocates chromosome loci towards the center of the nucleus without necessarily changing transcription23–25. Here we set out to test the hypothesis that a local surface force of physiologic magnitudes can directly stretch the chromatin and induce transcription upregulation in a living cell.
A strategy to visualize live cell chromatin stretching
We utilized a CHO DG44 (Chinese hamster ovarian) cell line containing a multi-copy insertion of a BAC with an ~180 kb mouse genomic insert containing the ~34 kb DHFR gene. The cell clone DHFR D10 stably expresses EGFP-dimer lac repressor (GFP-LacI), enabling visualization of the DHFR BAC, tagged with a 256mer lac operator repeat (~10 kb) (Fig. 1a)26. DHFR reduces dihydrofolate to tetrahydrofolate and is an essential enzyme for synthesizing thymidine. In order to allow for detection of local movements between chromatin regions, we used a cell clone that has multiple BAC copies in the same single chromatin without any intervening CHO genomic DNA26; the relative movement of multiple GFP spots (~2–7) therefore allows visualization of the relative motion of DHFR BAC chromatin26 (Fig. 1a, b, see Methods).
Figure 1. Strategy of visualizing chromatin under force.
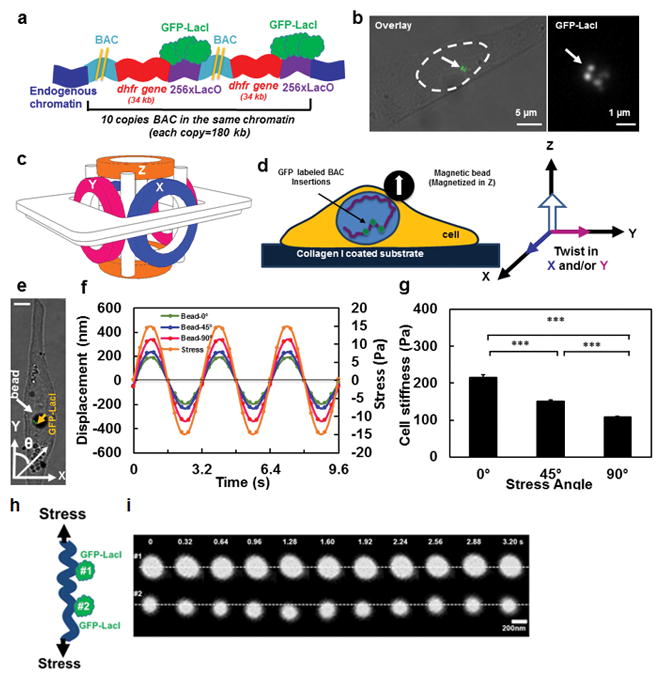
(A) Schematic representation of transgene insertions and fluorescence labeling of chromatin in live cells (Not drawn to scale) 26. Two yellow lines represent the long sequence of BAC. A stable cell line of DHFR D10 clone was used that had an insertion of 10 copies of the BAC into the same chromatin domain without any intervening CHO (Chinese Hamster Ovary) genomic DNA26. Here for visual simplicity only 2 copies of BAC (with DHFR gene and LacO) are drawn. (B) GFP tagged chromatin domains are shown inside the nucleus of a living CHO cell. Left image: nucleus is outlined by dashed lines; the brightfield image is overlaid with the fluorescent image. Right image: the magnified GFP-LacI image of the same cell; an arrow point to chromatin domains tagged with multiple GFP spots. (C) Schematic representation of the 3D Magnetic Twisting Cytometry (3D MTC). (D) A ferromagnetic bead was attached to the apical surface of the cells via integrins. A new strategy of altering stress angle but keeping stress amplitude constant was employed by which the bead was magnetized in Z direction and twisted in specified angles toward the X–Y plane by simultaneously modulating the amplitudes of the magnetic fields in X and Y directions. (E) A live CHO cell with a 4-μm ferromagnetic bead (a white arrow points to a solid black circle) with the GFP labeled chromatin (a yellow arrow points to the green spots). θ represents the angle of bead rotating direction with respect to the long axis of the cell (this notation applies to all cells in all figures). Scale bar, 5 μm. (F) Displacements of the center of the magnetic bead at the stress angle of θ=0º, 45º, or 90º in the same cell as in (E). Each displacement value is an average of data from 3 cycles. In all stress directions, the amplitudes of the sinusoidal magnetic fields (at 0.3 Hz) were modulated such that the peak stress amplitude remained constant at 15 Pa. The peak bead displacement was smaller along the long-axis of the cell than along the short axis. Note that due to a slight non-alignment between 0° stress angle (Y-axis) and the long axis of the cell in (D), thus 0° is in fact ~10°. Since the loading is cyclic and sinusoidal, a minus stress sign in (F) only represents the opposite direction of loading from the plus stress sign. (G) The dependence of cell stiffness (the ratio of the applied stress to the measured strain) on stress angles. Cell length to width ratio equals 2.84±0.377. Mean ± s.e.m.; n=30 cells, 21 independent experiments; *** P<0.001. (h) Schematic of two GFP spots of chromatin being deformed under stress. (i) Distance between two GFP spots (#1 and #2, corresponding to #2 and #3 GFP spots in Fig. 2d) in the same chromatin increases under a cyclic stress applied via integrins. Stress = 17.5 Pa at 0.3 Hz. Two white dashed lines are drawn only for visual aid.
To apply a local shear stress via integrins, we employed the technique of three-dimensional magnetic twisting cytometry (3D-MTC) that uses a magnetic bead (~4 μm in diameter), coated with saturating amounts of Arg-Gly-Asp (RGD) peptides27 (Fig. 1c, d; see Methods). To apply stresses to a focal adhesion on the cell surface in any specified direction, we first magnetized the magnetic bead along the Z-axis with a strong magnetic pulse (~1000 Gauss for <1 ms) and then turned on the weak magnetic field along the X-axis, Y-axis, or X- and Y-axis simultaneously to rotate the bead toward those directions (Fig. 1d). We used a strategy of combining different magnitudes of the twisting fields along X- or/and Y-axis such that the peak magnitude of the rotational shear stress on the bead (and to the cell surface) was constant while the stressing angle θ along the long axis of the cell was varied (Fig. 1e). Using this strategy, we were able to apply local sinusoidal shear stresses of a constant peak magnitude to cell surface via integrins in any desired direction.
For the constant peak stress magnitude of 15 Pa at 0.3 Hz, the bead displacement was much greater when the bead was displaced at 90° compared to at 0° (relative to the long axis of the cell) (Fig. 1f), with the shear stresses at an acute angle of 45° generating in-between bead displacements. As the peak stress amplitude was constant at 15 Pa, the computed cell stiffness was ~200 Pa at 0° stress angle, twice as much as that at 90° (Fig. 1g). Altering the sequence of the stress angles (e.g., 0° first or 90° first) did not the value of the cell stiffness probed at a particular stress angle (Supplementary Fig. 1a), suggesting that cell stiffening as a function of force duration was minimal in these CHO cells. These elongated cells exhibit extensive prestressed actin bundles (stress fibers) along the long axis of the cell (Supplementary Fig. 1b). Together with previously published findings that mechanical anisotropy of the cell disappears when cytoskeletal tension is inhibited or filamentous actin (F-actin) is disrupted27, these results suggest that prestressed actin bundles are an important contributor to mechanical anisotropy and thus stiffness of the cell.
Chromatin stretching depends on force directionality
First we measured movements of two GFP spots under a cyclic stress and found that the distance between them increased as a function of the stress cycle (Fig. 1h and i). Then we measured stress-induced displacements of individual GFP spots along the BAC insertions with a constant peak stress amplitude and with varying stress angles of 0°, 45°, and 90° (Supplementary Fig. 2a–c). All 3 GFP spots in the same chromatin were displaced synchronously with the bead displacement with phase lags (Supplementary Fig. 2a–c), indicating the viscoelastic features of the cytoplasm and the nucleus. To better visualize the dependence of GFP spot displacement on stress angles, we quantified Mean Squared Displacement (MSD) of each GFP spot as a function of stress angles. Each GFP spot exhibited highest MSDs when the stress was applied transverse cross the long axis (at 90°), followed by MSD amplitudes at 45° (diagonally) and at 0° (along the long axis) (Fig. 2a–d), showing strong dependence on stress angles. Since the increase of distance (Δ Distance) between any two GFP spots is a measure of the extent of chromatin stretching, we quantified Δ Distance as a function of stress angles. Interestingly, chromatin stretching at 90° is >3-fold larger than at 0° (Fig. 2e). Since cell stiffness at 90° was half of that at 0° (see Fig. 1g), these data suggest that for a given applied stress, chromatin stretching is inversely proportional to cell stiffness. Dividing Δ Distance by the original distance between GPF spots is a measure of % stretching; “apparent” chromatin stretching increased from 5% to ~18% when stress angles varied from 0° to 90° (Fig. 2f). Although the applied stress was applied along a particular direction on the cell surface, the resulting strains inside the nucleus could be complex. Using a published method13 to compute local chromatin strains from local chromatin GFP displacements, we found that both tensile strains and shear strains were stress-angle dependent, but tensile strains in the chromatin were ~2.5 times shear strains (Supplementary Fig. 3), suggesting that dilatational strains are the dominant mode of deformation in the chromatin. The differences between tensile strains and shear strains in the chromatin and their dependence on stress angles were supported by data from strain maps of the whole nucleus using histone 2B-green fluorescent protein (H2B-GFP) as a chromatin marker (Supplementary Figs. 4 and 5): peak bulk strain (both tensile and compressive strains) was ~4 times peak shear strain and both were stress-angle dependent, suggesting that a local surface stress of physiologic magnitudes could directly stretch chromatins and that BAC insertion did not cause any abnormal mechanical responses from the chromatin. Together, these results suggest that chromatin stretching is strongly dependent on how much the applied stress is propagated through the cell to extend the chromatin.
Figure 2. The extent of chromatin stretching depends on stress directions.
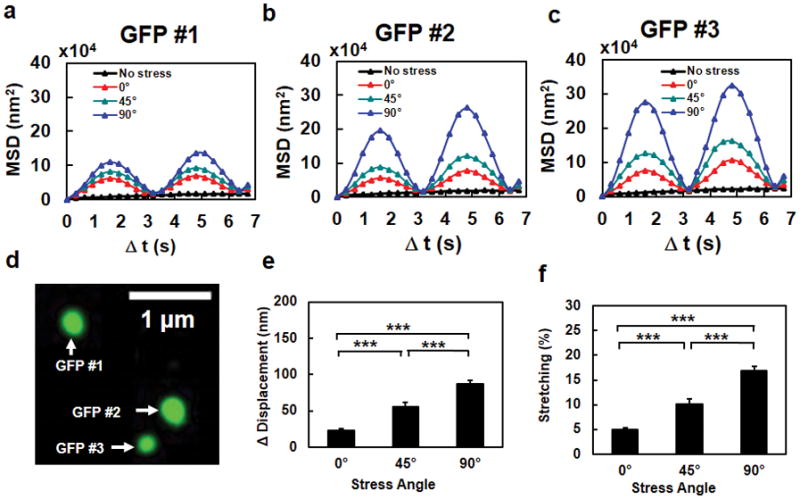
Mean Squared Displacement (MSD) of individual GFP spots #1 (a), #2 (b), and #3 (c) in a representative cell (the same cell as in Fig. 1e), when the stress (15 Pa at 0.3 Hz) was applied at 0º, 45º, or 90º. The black dashed lines in a, b, and c were the no stress control. It is apparent that the MSD was largest when the stress was applied along the transverse direction relative to the long axis of the cell. Data from 7 cycles of displacements are averaged in MSD curves. (d) The fluorescent image of the three GFP spots in the same chromatin of the cell. (e, f) Chromatin stretching (both peak stretching amplitude in (e) and % stretching in (f)) depends on stress angles. The increase of distance between any two GFP spots (Δ Distance) as a function of the stress angle at a constant peak stress (15 Pa at 0.3 Hz) represents the extent of chromatin stretching. Note that % stretching represents “an apparent stretching of the chromatin”, i.e., the distance between two spots on the chromatin is increased; it does not suggest that the chromatin molecule itself is stretched or elongated. The peak compressing amplitude and % compressing were similar to those of stretching. Mean ± s.e.m; n=90 GFP spots from 30 cells of 21 separate experiments; *** P<0.001.
Transcription upregulation by chromatin stretching
To determine if stress-induced chromatin stretching results in changes in gene expression, we used RNA Fluorescence in situ Hybridization (FISH) to quantify force-induced gene expression at the location of transgene insertions, using Cy3-conjugated mixed-probes to detect DHFR mRNA expression after stress application of 17.5 Pa at 0.3 Hz for 1 hr (Fig. 3a). DHFR gene expression always occurred at sites near the GFP spots (Fig. 3b). Since DHFR transcription could only be quantified in a fixed cell with FISH, a stress of 17.5 Pa at 0.3 Hz was applied to any given cell only once. The summarized results showed the strong positive dependence of DHFR gene expression on stress angles from 0° to 90° (Fig. 3c). Applying the stress nonspecifically with a Poly-L-Lysine (PLL) coated magnetic bead induced no stress-angle dependent bead displacements and no stress-angle dependent chromatin displacements (Supplementary Fig. 6), possibly because the PLL-bead did not directly attach to a focal adhesion and actin bundles. The PLL-bead at an 8.8-Pa or a 17.5-Pa stress resulted in only a 25% or a 50% increase in transcription respectively over the stress-free control cells, much less than the ~70% or the ~100% increase over the control observed for the RGD-coated bead at the same stresses (Fig. 3d), consistent with the data that no mechanical anisotropy was probed with the PLL-bead (Supplementary Fig. 6). However, treating the cells with Latrunculin A to disrupt F-actin completely blocked stress-induced transcription via the PLL-bead (Fig. 3d), suggesting that although the PLL-bead was not directly attached to the actin bundles, applied forces were able to propagate to the chromatin via F-actin, albeit much less effectively than those with the RGD-beads via the integrin receptors and actin bundles. These data indicate that transcription upregulation depends on stress amplitudes and thus is chromatin stretching-dependent, further supported by the data that chromatin stretching was stress-amplitude dependent (Supplementary Fig. 7).
Figure 3. Transcription increases with the extent of chromatin stretching.
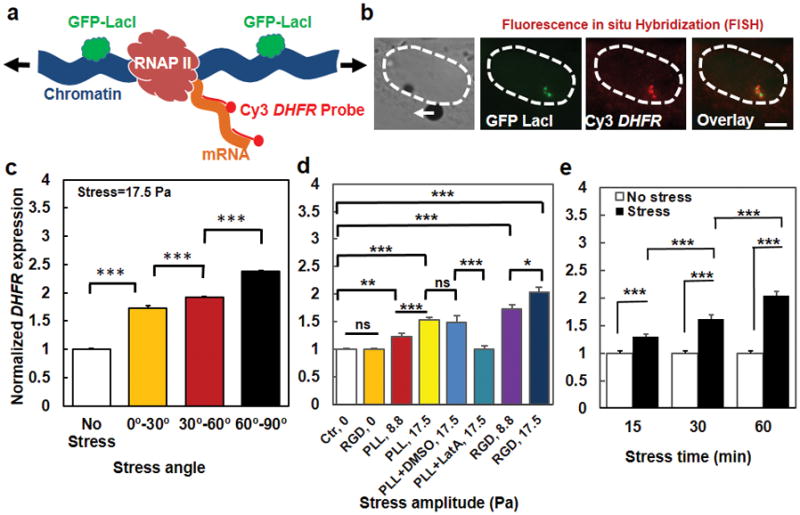
(a) A schematic of the process of Fluorescence in situ Hybridization (FISH) to quantify force-induced transcription at the location of transgene insertions with Cy3-conjugated mixed-probes (see Methods) to detect the expression of DHFR mRNA. Arrows represent stretching stress on the chromatin. (b) From the left, a brightfield image of a live CHO cell (its nucleus was highlighted with dashed lines) with a magnetic bead (black dot) (the white arrow represents the direction of the bead center displacement); middle left, GFP-LacI spots (green) were shown indicating the location of the transgene insertions; middle right, DHFR mRNA expression was quantified using Cy3-conjugated FISH probes (red); right, overlay of Cy3-FISH (red) with GFP-LacI (green) showing very close vicinity of the two. Stress was applied at 17.5 Pa at 0.3 Hz for 1 hour. Scale bar, 5 μm. (c) Summarized data of DHFR expression at transgene insertions as a function of the stress angles. Each cell was stressed only at one particular angle (this is the case for all FISH experiments). Controls (No Stress) were the cells in the same culture dish without attached magnetic beads so that they were exposed to the same magnetic field but no mechanical stress. The stress was applied for 1 hr at 0.3 Hz. Mean ± s.e.m.; n>50 cells per condition; *** P<0.001. (d) Gene upregulation depends on stress amplitudes. Ctrl, 0: cells in the same dish as those bound with beads (for plotting simplicity, all control cells data were lumped together). RGD, 0: cells bound with Arg-Gly-Asp peptides coated beads but no stress. PLL, 8.8 or PLL, 17.5: cells bound with poly-L-lysine coated magnetic beads (one bead per cell), applied with a 8.8-Pa or a 17.5-Pa stress. PLL+DMSO, 17.5: cells bound with PLL-beads, pretreated with 0.1% Dimethyl sulfoxide (DMSO) (a solvent for Latrunculin A (LatA)), applied with a 17.5-Pa stress. PLL+LatA, 17.5: cells bound with PLL-beads, pretreated with 1 μM LatA for 30 min, applied with a 17.5-Pa stress. RGD, 8.8 or RGD, 17.5: cells bound with RGD coated beads, applied with either an 8.8-Pa or a 17.5-Pa stress. All stresses were applied at 0.3 Hz for 1 hr. Mean ± s.e.m.; n=60 cells for Ctr, 0; 25 cells for RGD, 0; 33 cells for PLL, 8.8; 41 cells for PLL, 17.5; 19 cells for PLL+DMSO, 17.5; 26 cells for PLL+DMSO, 17.5; 43 cells for RGD, 8.8; and 31 for RGD, 17.5; 4 independent experiments. (e) Gene upregulation by stress depends on duration of stress application (17.5 Pa at 0.3 Hz). DHFR transcription increased in cells stressed via RGD-coated beads relative to controls. Mean ± s.e.m.; without stress: n=31, 32, and 30 cells at 15, 30, and 60 min, respectively; with stress: n=47, 30, and 31 cells at 15, 30, and 60 min, respectively. * P<0.05; *** P<0.001. Note that stress angles were lumped together in (d) and (e) for each condition.
DHFR transcription upregulation also depended on duration of the stress application (Fig. 3e). Because it takes ~10 min for complete transcription of one DHFR transcript (34 kb at ~50 bp per sec) 33, it is reasonable that transcription continued to increase from 15 min to 30 min after stress application (Fig. 3e). To determine more precisely when the first transcripts were synthesized after stress application, we synthesized fluorescently-labeled 5′-end-probes that specifically bind to the first ~1700 bps of the DHFR transcript (see Methods). We find that transcription upregulation was detected as early as 2 min after stress application and plateaued 6 min after stressing (Fig. 4a). In sharp contrast, when fluorescently-labeled 3′-end-probes that specifically bind to the last ~2000 bps of the DHFR transcript were used, transcription upregulation was only detected as late as 10 min after stress application and reached a plateau at 20 min (Fig. 4b). Since the transcription rate is ~50 bps per sec, we reasoned that it was possible to detect the transcription events even earlier than 2 min using the 5′-end-probes as long as the number of the chromatin-bound probes was enough for the fluorescence to be quantified above the baseline. We found that indeed that upregulation in DHFR transcription was detected as early as 15 sec after stress application when compared with the time-course controls (Fig. 4c). Remarkably, stress angles at the same stress magnitude impacted transcription as early as 15 sec, with angles of 60°–90° inducing higher upregulation than angles of 0°–30° (Fig. 4d). In addition, we estimated the number of 5′-probes bound to the transcribed region within 15 sec. At 15 sec, ~750 bps (at 50 bps per sec) of DHFR genomic DNA were transcribed, which included sequences that complementarily matched the sequences of the first 11 oligs of the 5′-probes, ~1/4 of the total number of forty-three 5′-probes (see Methods). Interestingly, the upregulated DHFR transcription at 15 sec was ~13% above baseline, which was also ~1/4 of the upregulated signals of DHFR detected using all the 5′-probes at 10 min (comparing Fig. 4c with Fig. 4a), Therefore, the detected DHFR transcripts signals at various times after stress application are consistent with the fraction of the number of mRNA-bound 5′-probes and the estimated speed of transcription. To further explore the possibility of recruiting transcription machinery to the GFP spots before transcription upregulation, we quantified RNA Polymerase (Poly) II binding to the BAC GFP spots 5 sec after stress application. There was a stress-angle dependent increase in RNA Poly II binding near the GFP spots (Supplementary Fig. 8), suggesting that RNA Poly II binding to GFP spots are chromatin-stretch dependent and that the transcription machinery is active and ready to access the force-unfolded chromatin to initiate DHFR transcription. Together these results strongly suggest that transcription processes started along the chromatin as soon as the force was applied on the cell surface to stretch the chromatin without delay in transcription initiation, excluding the possibility of a major role by the relay cascades in nuclear gene transcription.
Figure 4. Rapid initiation of force-induced gene transcription.
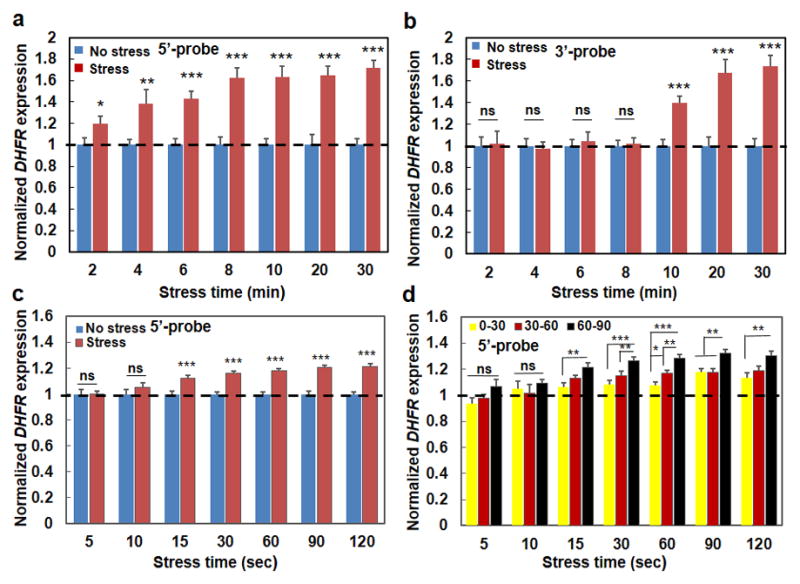
(a) Normalized transcription when fluorescently-labeled 5′-end-probes were utilized to probe the first 1700 bps of the DHFR transcripts (see Methods). Mean±s.e.m.; at 2, 4, 6, 8, 10, 20, 30 min, n=31, 29, 26, 20, 16, 13, 23 cells for Control conditions (cells in the same dish but no bead and applied stress); n= 21, 15, 32, 28, 21, 23, and 29 cells for Force conditions (stress=17.5 Pa at 0.3 Hz); 3 separate experiments; * P<0.05; ** P<0.01; *** P<0.001; in all cases the stressed cells were compared with their control counterpart cells at the same time. No statistically significant differences were observed between 6 min force with 8 min force (p=0.0883), or between 8 min force and 10 min force (p=0.9785). (b) Normalized transcription when fluorescently-labeled 3′-end-probes were utilized to probe the last 2000 bps of the DHFR transcripts (see Methods). Mean±s.e.m.; at 2, 4, 6, 8, 10, 20, 30 min, n=24, 22, 33, 15, 15, 16, 18 cells for Control conditions (no stress); n= 13, 19, 15, 16, 21, 16, and 18 cells for Force conditions (stress=17.5 Pa at 0.3 Hz); 3 separate experiments; *** P<0.001; ns=not statistically significant. There were significant differences between 10 min force and 20 min force (p=0.0351); no statistically significant differences were observed between 20 min force and 30 min force (p=0.7163). (c) Early time upregulation of transcription. 5′-end-probes were used. No stress: cells in the same dish but without the beads (no stress). Stress: stress applied at 17.5 Pa and 0.3 Hz. Bead binding alone did not have any effect on DHFR transcription (when comparing cells with beads and cells without beads). Mean±s.e.m.; at 5, 10, 15, 30, 60, 90, 120 sec, n=35, 25, 50, 56, 43, 44, and 45 cells for No stress; n=36, 37, 69, 59, 71, 51, and 61 cells for Stress conditions; three separate experiments. (d) Early time transcription is stress angle dependent. 5′-end-probes were used. Mean ± s.e.m.; at 5, 10, 15, 30, 60, 90, 120 sec, n=11, 15, 24, 20, 24, 27, 14 for 0°–30°, n=12, 11, 27, 22, 25, 22, 19 for 30°–60°, n=13, 11, 18, 17, 22, 12, 18 for 60°–90°, respectively. For (c and d); three separate experiments; * P<0.05, ** P<0.01, *** P<0.001; ns=not statistically significant. For simplicity, controls (No stress) data that are shown in (c) are not re-plotted in (d) and are only represented with a dashed line. All data in (d) at various stress angles 15 sec or more after stress application are significantly higher than No stress conditions (all P<0.001). Dashed lines in (a, b, d) are only for visual aid.
We found that applying forces resulted in the same percentage increase of DHFR transcription in serum-deprived cells as in those cells cultured in serum (Supplementary Fig. 9), suggesting that additional soluble factors in serum may not be necessary for force-induced gene upregulation. To further determine whether it is the extent of chromatin stretching or the total mechanical energy for a given time (mechanical power) that dictates gene transcription, we varied the forcing frequency. Elevating the mechanical power by a factor of 3 via a three-fold increase in frequency from 0.3 Hz to 1.0 Hz did not alter the amplitude of chromatin stretching (Supplementary Fig. 10) or the ensuing DHFR transcriptional increase in the cell (Supplementary Fig. 11), supporting the critical role of chromatin stretching in gene transcription. The strong dependencies of DHFR gene expression on stress angles, ligand specificity (integrin-specific vs nonspecific), stress amplitude, and stress duration all suggest that it is the degree of local chromatin stretching that leads to the local elevated DHFR transcription in the living cell.
Structural basis for force transfer from LINC to chromatin
Previously published works have shown that a matrix force is propagated to the nucleus via mechanical coupling from integrins to focal adhesion proteins to the cytoskeleton, and then into the nucleus through coupling with the LINC (linker of nucleoskeleton and cytoskeleton) complex including nesprins and SUN proteins, to nuclear lamins (Lamin A and Lamin B) and then to chromatin (reviewed in ref. 28). However, precisely how chromatin is physically connected to the lamins is unclear. We chose candidate proteins Emerin, BAF, and HP1, known to directly bind to chromatin and lamins. To determine if any of these proteins play significant roles in physically linking chromatin to the nuclear periphery, we specifically silenced these proteins one by one and quantified the spontaneous movements of chromatin.
We hypothesized that chromatin spontaneous movements should increase if the knocked-down protein is tethering the chromatin directly or indirectly to the nuclear lamina or other nuclear structures. Silencing Lmnb1 and Lmnb2 (genes expressing Lamin B protein) simultaneously led to an increase of spontaneous movements of the chromatin (Fig. 5a), consistent with a report that Lamin B is an elastic component of the nuclear lamina17. Silencing Lmna (gene expressing Lamin A protein) led to elevation of spontaneous movements of the chromatin (Fig. 5a), in accord with published reports that Lamin A is critical for nuclear mechanics and tissue differentiation14–16. Moreover, silencing Emd (gene expressing Emerin protein) led to increases of spontaneous movements, consistent with a published report that Emerin plays a role in stiffening the nucleus20. Interestingly, silencing cbx5 and cbx1 (genes expressing heterochromatin protein 1 (HP1) α and β) or BANF1 (gene expressing BAF protein) with siRNA led to significant elevation of chromatin spontaneous movements (Fig. 5a; Supplementary Fig. 12a), suggesting that both HP1 and BAF proteins might physically tether the chromatin with the nuclear lamins and/or other nuclear structures and knocking down either protein would lead to increased chromatin mobility. As expected, knocking down SUN1 and SUN2 (SUN1/2) simultaneously increased chromatin spontaneous movements (Fig. 5a; Supplementary Fig. 12a) since both are known to mediate physical signals to the nuclear lamina. Knocking down Lamin B receptor (LBR) has no effects on chromatin spontaneous movements (Fig. 5a; Supplementary Fig. 12a), suggesting that LBR is not important in tethering the chromatin to the nuclear lamina. Importantly, knocking down cbx5/1 or BANF1 resulted in downregulation of stress-induced chromatin deformation, similar to those from silencing Lamin A, Lamin B, Emerin, or SUN1/2, whereas silencing LBR has no effects (Fig. 5b, Supplementary Fig. 12b), suggesting that both HP1 and BAF play significant roles in mediating stress propagation from the LINC to the chromatin. Consistent with the results of the dependence on those nuclear proteins for force propagation, force-induced DHFR transcription upregulation was abolished when individual nuclear proteins were depleted except for LBR (Fig. 5c; Supplementary Fig. 12c), establishing the structural basis from the nuclear envelope to the chromatin for chromatin stretching dependent DHFR gene upregulation.
Figure 5. Structural basis of force transfer to stretch chromatin.
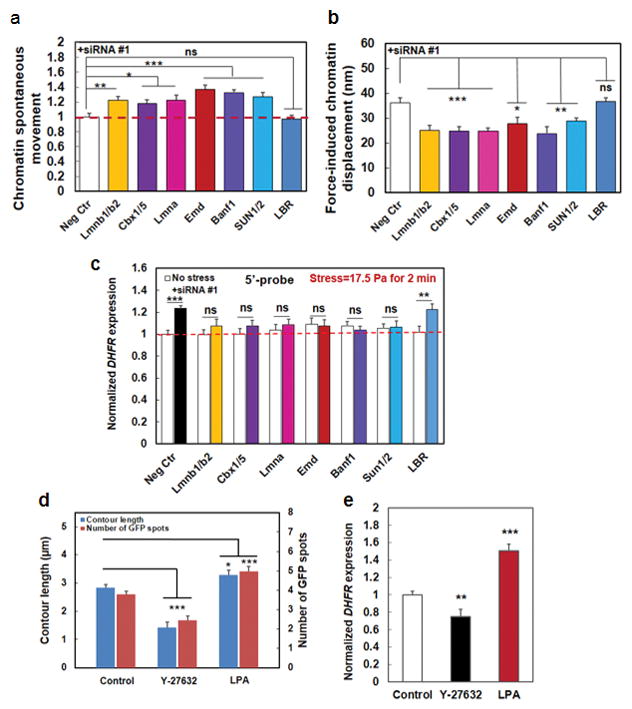
(a) Summarized data of quantification of the mean (frame-to-frame; 300 ms per frame) chromatin spontaneous movements without externally applied forces. All conditions were normalized to Neg Ctr; those that were treated with scrambled siRNA. Mean ± s.e.m.; n=36 (Control baseline movements=20.97±1.04 nm), 61 (Lmnb1/2, both Lmnb1 and Lmnb2 were silenced), 44 (cbx1/5, both cbx1 and cbx5 were silenced), 37 (Lmna), 56 (Emd), 41 (Banf1), 48 (SUN1/2, both SUN1 and SUN2 were silenced), 35 (LBR) cells, respectively; 3 separate experiments. * P<0.05; ** P<0.01; *** P<0.001. The red dashed line is drawn for visual aid only. (b) HP1 and BAF proteins, in addition to lamin A, lamin B, Emerin, and SUN1/2, transmit stresses from Lamins to chromatins. Lmnb1 and 2, Lmna, Emd, Banf1, HP1 (Cbx1 and 5), SUN1/2, and LBR genes were silenced using siRNA and local oscillatory forces are applied to the cell surface using MTC (8.8 Pa at 0.3 Hz). Force-induced displacements of GFP-LacI labeled chromatin transgenes were measured. Neg Ctr: force-induced displacements after scrambled siRNA treatment. Mean ± s.e.m.; n=10, 9, 9, 5, 10, 5, 28, 26 cells for Neg Ctr, Lmnb1&2, Cbx1&5, Lmna, Emd, and Banf1, SUN1/2, and LBR respectively; 3 separate experiments; * P<0.05; ** P<0.01; *** P<0.001; ns=not statistically significant. (c) Summarized data for normalized DHFR transcription after knocking down individual nuclear proteins. Stress was applied at 17.5 Pa at 0.3 Hz for 2 min to CHO cells bound with RGD-coated magnetic beads. DHFR partial transcripts were detected using 5′-probes and FISH. No stress: cells in the same dish but no stress was applied. Neg Ctr: treated with scrambled siRNA. Mean±s.e.m.; n=49, 19, 25, 19, 26, 27, 25, and 19 cells for Neg Ctr, Lmnb1/2, Cbx1/5, Lmna, Emd, Banf1, SUN1/2, and LBR silenced conditions under no stress; n=49, 18, 18, 17, 31, 32, 24, and 30, respectively for the corresponding conditions with applied stress. 3 separate experiments. ** P<0.01; *** P<0.001; ns=not statistically significant. Red dashed line is for visual aid only. (d) Summarized data for contour length (length of the line connecting GFP spots) and the number of GFP spots (number of active transgenes) without (Control) and with Y-27632 (20 μM for 30 min) or LPA (with 2 μgml−1 for 60 min) treatment. Y-27632 treated cells had shorter contour lengths and hence fewer GFP spots, indicating that the chromatin is more condensed; LPA treated cells exhibited opposite phenotypes, suggesting that the chromatin is more decondensed. Mean ± s.e.m.; n=48, 26, 28 cells (contour lengths and GFP spots) for Control, Y-27632, and LPA conditions, respectively; 3 separate experiments. * P<0.05; *** P<0.001. (e) Gene regulation by stress depends on actomyosin tension. Stress was applied via RGD-coated beads. Control: untreated cells stressed at 17.5 Pa and 0.3 Hz for 60 min; Y-27632: cells pretreated with 20 μM Y-27632 for 30 min before stress was applied for 60 min; LPA: cells pretreated with 2 μgml−1 LPA for 60 min before stress was applied for 60 min, Mean ± s.e.m.; n=31, 28, 53 cells for Control, Y-27632, and LPA conditions, respectively; n=3 separate experiments; ** P<0.01; *** P<0.001.
If the physical link between the matrix proteins and the chromatin is important in propagating matrix forces to deform the chromatin, we hypothesized that myosin II would be important in tensing the actin bundles and transmitting endogenous forces to decondense the chromatin and influence the ensuing gene expression. Treating the cells with a ROCK inhibitor (Y-27632, 20 μM for 30 min) significantly decreased chromatin contour lengths and the number of GFP spots while treating the cells with Lysophosphatidic Acid (LPA, 2 μg ml−1 for 1 hr) to activate RhoA significantly increased chromatin contour lengths and the number of GFP spots (Fig. 5d). Furthermore, the ROCK inhibitor attenuated (~25% reduction) stress-induced DHFR upregulation while activating RhoA significantly increased (~50% elevation) stress-induced DHFR transcription (Fig. 5e). Consistently, in the absence of external stresses, inhibiting ROCK with Y-27632 or F-actin with Latrunclin A downregulated endogenous DHFR transcription while treatment with LPA upregulated endogenous DHFR transcription (Supplementary Fig. 13a). In addition, inhibiting myosin light chain kinase with treatment of ML7, which causes a 50% decrease in cell-matrix tractions29, led to downregulation of chromatin contour lengths and the number of GFP spots (Supplementary Fig. 13b), suggesting chromatin became more condensed; in addition, DHFR gene expression was decreased by 25% after ML7 treatment (Supplementary Fig. 13c). Together these data suggest that cytoskeletal tension was important in propagating the applied forces to the chromatin to upregulate transcription. However, we cannot exclude the alternative possibility that chromatin decondensation contributes to stress propagation through flanking chromatin to the internally-located DHFR transgene chromatin. Consistently, we found that increasing matrix rigidity (and thus elevating endogenous active tension and cell-matrix tractions30, 31) increased the number of GFP spots and contour lengths (Supplementary Fig. 14a, b), and upregulated DHFR gene expression (Supplementary Fig. 14c). Together, these results reveal that both exogenous and endogenous forces can induce DHFR expression via chromatin stretching.
Previously, movement of genes from the nuclear periphery to interior has been correlated with gene activation of previously silent genes25. We find that there is no change in chromatin GFP spot location associated with stress application, suggesting that there is no gene relocation in response to force in these CHO cells (Supplementary Fig. 15). The DHFR BAC transgenes in these CHO cells could to be already partially active since they located 2–2.5 μm away from the nuclear periphery (Supplementary Fig. 15) prior to force application. The observed increase in transcription with force application therefore is not related to a change in nuclear position but rather to chromatin stretching.
A recent report on isolated nuclei20 has shown that Emerin can be phosphorylated by a force of ~30 pN applied directly to nesprins and the stiffness of the isolated nucleus is ~0.6 Pa. Since chromosomes of a living cell have a stiffness of 1–5 kPa22 and isolated chromosomes have a stiffness of ~300 Pa21, about 3 orders of magnitude higher than the 0.6 Pa in this report, it is likely that the 30 pN force applied to the isolated nuclei only deformed the nuclear envelope and not the underlying chromatins. Whatever the reasons for this large discrepancy between the stiffness of isolated nuclei versus chromosomes in living cells, this significant discrepancy suggests that isolated nuclei are not a good model system for dissecting how external forces might signal to chromatin in the nuclear interior.
Currently there are several models explaining how mechanotransduction can lead to changes in nuclear functions. Evidence of direct unfolding of integrins and focal adhesion proteins and the ensuing mechanical-chemical signaling support the model of cascade signaling2. The discovery of cytoplasmic YAP/TAZ and their nuclear translocation supports the model of relay in cytoplasmic and nuclear mechanotransduction and differentiation7. Long term application of tension to suppress protein degradation (e.g., structural proteins myosin II, collagen-1, and lamin A) prompts the new force-inhibited protein degradation model32. Our discovery of a direct chromatin stretching and ensuing gene expression complements these models.
The extent of the chromatin stretching appears to be critical in determining the magnitude of DHFR transcription upregulation: for the same amplitude of stress, the more the chromatin is stretched, the higher the transcription upregulation. Even when the stress is applied nonspecifically, via a PLL-bead, DHFR transcription can still be elevated as long as the chromatin is stretched. However, elevation of transcription via a PLL-bead is much less than via a RGD-bead for the same stress amplitude, which correlates with a reduced chromatin stretching produced using the PLL-bead. These results suggest that activation of focal adhesion proteins via integrins and the ensuing signaling cascades may not be required for the upregulation of DHFR under stress, as the PLL-bead bypasses integrin binding and down-stream signaling events. It is therefore difficult to interpret the PLL-bead induced activation of DHFR transcription result using the focal adhesion activation and ensuing signaling cascade model2. However, we cannot rule out the possibility that a few integrins and cytoplasmic molecules at the contact area between the PLL-bead and the plasma membrane might contribute to the transcription upregulation.
Our detection of stress-angle dependent DHFR 5′-end transcripts as early as 15 sec after stress application is not easily explained by either the YAP/TAZ translocation model7 or by the protein degradation inhibition model32, both of which would take too long (~hours) to have any impact. Moreover, the strong dependence of DHFR transcription on stress angles excludes models involving diffusion-mediated processes triggered by a force threshold, since the peak force (stress) amplitude is constant when the stress angles are varied.
We speculate that transient chromatin stretching of ~20–100 nm can open sufficient space to decondense the chromatin for increased accessibility of the transcriptional machinery transcription, leading to an increased rate of DHFR transcriptional initiation. It is noted that DHFR transcripts after completion of transcription will move/diffuse away from the GFP spots (BAC transgene) and therefore what we measure 1 hr after stress application could be an underestimate of the actual number of stress-induced new transcripts. However, assuming a constant probability of transport of newly synthesized messages away from the transcription site, at steady-state the size of the accumulated transcript pool adjacent to the transgenes should be proportional to the rate of transcription. We acknowledge that we have only examined a chromatin-stretch dependent DHFR transgene upregulation in the current study; however, previous work has shown that these DHFR BAC transgenes exhibit ~50% the expression levels of the endogenous DHFR gene33, suggesting that the transgene is physiologically relevant. It remains to be seen if other genes can also be upregulated by direct chromatin stretching and if our current findings can be extended to other cell types, but it is remarkable that a house-keeping gene like DHFR can respond to direct chromatin stretching, suggesting the potential generality of gene activation by force-induced direct chromatin stretching. It is likely that the DHFR transgene may be already active at baseline and molecules are ready to be recruited (e.g., RNA Poly II is active and ready to be recruited (Supplementary Fig. 8)); or the transgene site presumably has a partially open configuration and is located in the nuclear interior (Supplementary Fig. 15). It is possible that some endogenous genes that are not active at all may not be able to be activated by an applied force alone. This may be the reason that when an external force (either a stretching force or a shear force) is applied, only some genes are activated while other genes are not. However, we have found that DHFR transcription could still be elevated by force after serum deprivation, which is known to condense the chromatin and decrease DHFR gene expression26, suggesting that the applied force is potent enough to decondense the chromatin to elevate DHFR transcription in serum-deprived CHO cells. One possible interpretation of our current findings is that the DHFR gene, due to the BAC insertion, might be uniquely sensitive to this increase in transcription driven by mechanical forces. To test this possibility, we applied forces to these CHO cells and assayed a known mechanosensitive endogenous gene (egr-1, early growth response gene 1) expression34 under identical culture and mechanical conditions as the DHFR gene. We found that egr-1 gene is upregulated by >14-fold at 17.5 Pa at 0.3 Hz for 1 hr (Supplementary Fig. 16), much more than DHFR (~2-fold) under the same culture and stress conditions, suggestion that the DHFR gene is not particularly sensitive to the increase in transcription driven by mechanical forces. Since we have not been able to insert multiple fluorescent tags to the same chromatin that are near the egr-1 gene because it is a non-trivial task, we cannot say definitively that this gene upregulation is chromatin-stretch dependent. However, since the H2B-GFP mapping of the BAC CHO cells shows that the magnitudes of peak tensile strains of H2B are similar to what is observed with the BAC GFP spots under similar stress conditions, these findings suggest that egr-1 upregulation by the magnetic bead stress might be at least partially due to local stretching of the chromatin segment that contains egr-1 gene. It would be important to note that DHFR is used here as a model system to demonstrate that mechanical coupling of forces from the outside of the cell to the inside of the nucleus has the potential to directly activate gene expression. There is an advantage of this type of experimental designs, because it is unlikely that there would exist a biochemical signaling pathway to activate DHFR expression in the presence of force. Thus using DHFR is another argument supporting our conclusion that the observed increased expression of DHFR in response to stress is due to mechanical force transduction. We envision that known mechanically-responsive genes may have evolved mechanisms such that they are much more sensitive to force than other genes. The increased response of egr-1 to force suggests that this might be the case. In the future it would be interesting to determine if our conclusion that the extent of chromatin stretching is critical in determining the level of DHFR transcription applies to many other genes that are being actively transcribed. It is also of interest that the loading in this study is symmetric and thus transient compression is also induced in the chromatin GFP spots; it is not clear why these stretching and compressing impacts do not cancel each other. One possibility is on and off rates and kinetics of molecular binding are different such that transient compressing does not cancel transient stretching effects. The exact mechanisms need to be explored in the future. Nevertheless, our current findings, together with the reports on the established physical linkage from the ECM to the nucleus and the role of tensed actin bundles in long-distance force propagation28, support the model of a direct force impact on flanking chromatin to induce DHFR gene transcription at the nuclear interior (Fig. 6).
Figure 6. A model for direct force impact on gene activation.
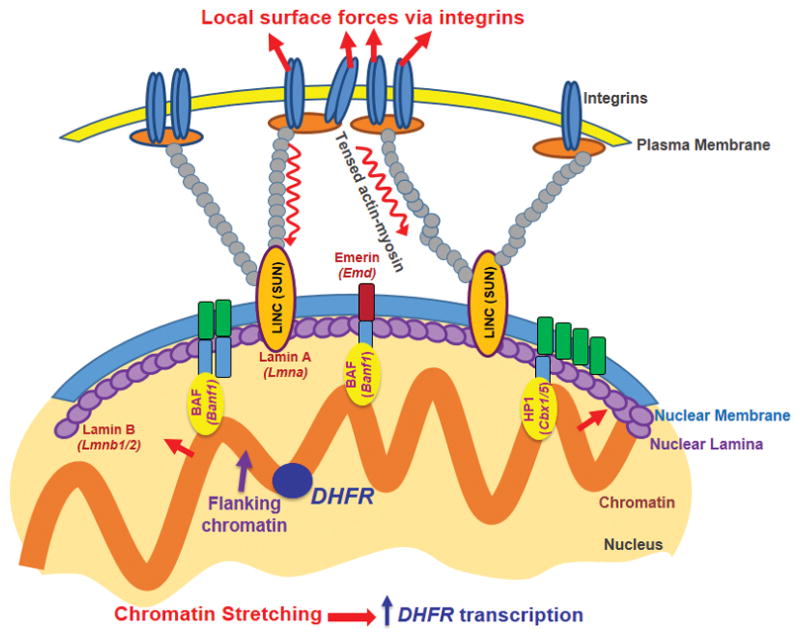
A local surface force via integrins is propagated though the myosin-II tensed actin cytoskeleton to the LINC (via SUN1 and SUN2) complex, to nuclear lamins, and then is transferred to the flanking chromatin through BAF and HP1 proteins and other molecules. The flanking chromatin transfers the force to deform and to stretch the chromatin segment containing the DHFR gene at the nuclear interior, facilitating binding of the RNA Polymerase II and transcription factors to upregulate DHFR transcription. Note that underneath each nuclear protein is its gene name. Not drawn to scale.
The proposed various models for how mechanotransduction of forces alters nuclear functions are not mutually exclusive. We suspect that their relative contributions vary at various time scales. It is remarkable, however, that stress angles have such a huge impact on the extent of chromatin direct stretching and the ensuing DHFR transcription upregulation. Since a living adherent cell interacts with its ECM via many adhesion sites (e.g., multiple focal adhesions) and with its neighboring cells via cell-cell adhesion molecules such as cadherins, it will be interesting to find out how forces from various sites of surface contacts intersect in the nucleus to cause local chromatin stretching, shearing, or compression to activate or repress transcription. In the future it will also be critical to understand how directional forces are integrated with signals from soluble factors inside living cells and tissues to generate a coherent biological response to perturbation in the microenvironment.
Methods
Cell culture and reagents
CHO DG44 cells containing DHFR BAC and stably expressing EGFP-LacI (DHFR BAC B9-2 Cell line) were cultured in Ham’s F12 media without thymidine and hypoxanthine (Hyclone) with 10% dialyzed FBS following procedures described previously26. Mouse DHFR gene were tagged with 256-mer Lac Operator (LacO) repeats and inserted into Bacterial Artificial Chromosome (BAC). A stable cell line of DHFR D10 clone was generated by insertion of 10 copies of the BAC into the genome of Chinese Hamster Ovary (CHO) cells26. EGFP-Lac Repressor (GFP-LacI) was stably expressed in these cells. High affinity binding of GFP-LacI to LacO was used to visualize transgene insertions in chromatin. Because of the distribution of the GFP spots in the z direction and the compact folding of some chromatin segments, for the same single chromatin in a CHO cell, one can only count 5–6 GFP spots with 2D epifluorescence, 7–8 GFP spots with 3D confocal microscopy, but one can count the full 10 GFP spots with 3D stimulated emission depletion (STED) nanoscopy (Supplementary Fig. 17). The BAC chromatin insertion was tandem and continuous with no evidence of endogenous genomic DNA, confirmed by BAC DNA FISH26. For serum deprivation, cells were cultured in the same media with 0.2% dialyzed FBS for 48 hours before experiments. Murine melanoma cell line B16-F1 was obtained from American Type Culture Collection (ATCC). Cells were seeded on rigid plastic in DMEM supplemented with 10% fetal bovine serum (Invitrogen), 1 mM sodium pyruvate, 2 mM L-glutamine (Invitrogen), and 0.1 mM penicillin/streptomycin at 37°C with 5% CO2. Cells were passaged every 3 days using TrypLE (Invitrogen). Cells were randomly allocated to various experimental groups. Y-27632 and Lysophosphatidic Acid and Latrunculin were from Sigma. ML7 was purchased from Enzo Lifesciences. H2B-GFP was from Life Technologies (Catalog, C10594) and transfected following protocols from the supplier. F-Actin was stained using Alexa Fluor 594 conjugated Phalloidin (Invitrogen, A12381). Antibodies for Western blots: Cbx1 (catalog #8676, Cell Signaling); Cbx5 (catalog #, SAB2500209, Sigma); Lmna (catalog #, SAB4200236, Sigma); Lmnb2 (catalog #, MA1-06104, Thermo Fisher Scientific); Lmnb1 (catalog #13435, Cell Signaling); Banf1 (catalog # NBP1-76751, Novus biological); Emd (catalog #, NBP1-87692, Novus biological); SUN1 (catalog #, H00023353-B01P, Novus biological); SUN2 (catalog #, ab124916, Abcam); LBR (catalog #, ab122919, Abcam). Anti-RNA polymerase II CTD repeat YSPTSPS (phosphor S5) antibody was from Abcam (Catalog #, ab5131).
The CHO DG44 cells used for derivation of BAC transgene array-containing subclones were received from the person who created them. These cells have a double knockout for DHFR, which was then used as selectable marker for the BAC transgene stable selection. The DHFR minus status of these cells was confirmed by the rescue of DHFR using a DHFR BAC transgene. The derivation of the DHFR D10 subclone was described and characterized previsouly26. The number of copies and nature of the BAC transgene array was observed directly by visualizing the GFP-lac repressor staining patterns of the cell line, thus authenticating the presence of the BAC transgene array in these cells. One of the most sensitive assays recommended for mycoplasma contamination is DAPI-staining and visual inspection by light microscopy. These cells are used for study of nuclear structure using light microscopy that routinely counter-stains with DAPI. Hence we are essentially continually monitoring these cells during the course of experiments for mycoplasma contamination.
3D Magnetic Twisting Cytometry
Three-Dimensional-Magnetic Twisting Cytometry (3D-MTC) has been described in detail previously27. In brief, three pairs of coils aligned in x, y, and z directions that could independently generate strong magnetizing fields (~1000 Gauss, <1 ms) and weak oscillatory (sinusoidal) twisting fields (0–25 Gauss; a magnetic field was converted to an applied stress knowing the magnetic moment of the bead (the bead constant, which was calibrated in a known viscosity standard) and the bead-cell contact area, which equaled 41±1% (Mean ± s.e.m.; n=15 cells) at the beginning of the experiments (30 min after bead binding) and did not change at the end of the experiments (90 min after beading binding). 3D-MTC can generate rotational shear stresses (via rotational moments) in any defined direction. The 3D-MTC works by the principle of magnetizing a bead in one direction and then applying a twisting field in an orthogonal direction such that the bead rotates in the plane of these two directions (two-axes). Since the bead is partially embedded, the bead not only rotates but also is pulled along the rotational direction (one analogy would be that it is somewhat like the tires of a car that rotate and linearly translocate/displace). This is why we are able to quantify the displacement of the bead center of mass to obtain cell stiffness as the bead rotates. It is known that focal adhesions generate out-of-plane rotational moments in addition to in-plane tractions35. As such, the magnetic bead twisting assay simulates the stresses generated at a focal adhesion and is biologically relevant. Stresses were applied at frequencies of 0.1, 0.3, or 1.0 Hz. Because two different batches of magnetic beads were used in two different labs in Urbana and in Wuhan (two 3D MTC devices that were of the same design and field strength were used in the 2 labs), the magnetic moments were slightly different in these two batches of beads. As a result, at the same twisting field of 25 Gauss in 3D MTC, the peak stress amplitude was slightly different: 17.5 Pa for batch 1 and 15 Pa for batch 2. However, chromatin stretching and its dependence on stress-angles were quantitatively reproducible in the 2 labs and the measured values were almost identical. The BAC chromatin generally is curved and is not taut or straight in the absence of external force; therefore, an increase in distance between two GFP spots indicates that the chromatin is more straightened, corresponding to an ‘apparent’ stretching of the chromatin molecule following the engineering definition of polymer deformation. The magnetic beads that were pre-coated with RGD peptide or poly-L-lysin (PLL) were incubated with the cells for 30 minutes to allow for sufficient time for formation of focal adhesions8 or for formation of tight attachment to the surface of the cell for the case of PLL. The specificity for RGD-bead binding to integrins was examined before8. The magnetic beads were added at a low concentration such that there was only one bead per cell in sparsely plated cells. For the sake of straight-forward calculation and analysis, those cells with were more than one beads were ignored for the current study, which could be examined in future studies to simulate impacts of forces via multiple focal adhesions on the cell. The distances from the bead edge to the chromatin GFP spots were in general in the range of 2 to 5 μm. Within this 2–5 μm distance, because of long-distance force transmission8, 11 in the elongated CHO cells that had numerous tensed actin bundles (stress fibers), the chromatin deformation did not vary much for the same magnitudes of stress at the same stress angles. When the distances were greater than ~10 μm, chromatin deformation at 0° (relative to the cell long axis) stress angle was too low to be quantified at the 15-Pa applied stress. The cells in the same dish without a bead bound to their surface were used as control cells as they were exposed to the same magnetic field and the same chemicals but no mechanical forces. In order to apply a given peak rotational shear stress at various directions, sinusoidal oscillatory magnetic fields were applied with chosen peak amplitudes by applying appropriate peak currents to the magnetic coils in X and Y directions after application of the strong magnetizing field in Z direction.
RNA FISH
Custom Sterllatis FISH Probes were designed against DHFR mRNA (http://www.ncbi.nlm.nih.gov/nuccore/NM_010049.3) by utilizing Stellaris RNA FISH probe Designer (Bioresearch Technologies Inc., Petaluma, CA). Cells were fixed in 3.7% paraformaldehyde and permeabilized overnight in 70% ethanol. Samples were hybridized with the DHFR Stellaris RNA FISH probe set labeled with Quasar® 570 Dye (bioresearch Technologies Inc.) following the manufacturer’s protocol and imaged in 2X SSC buffer immediately after hybridization. Please note that some of the early probes (e.g., the mixed probes) used in the study were labeled with Cy3. Stellaris® FISH Probes, 5′-end DHFR probes detect the first ~1700 bps (covering mRNA from bases 12 to 1706) and 3′-end DHFR probes detect the last ~2000 bps (covering mRNA from bases 3260 to 5233) of the transcripts. The total length of mouse DHFR mRNA is 5307 bps.
Mixed probes’ sequences
gggtattctgggagaagttt, ctttcttctcgtagacttca, ttgcaaatacactgccagtc, gggaggcaaacggttctaag, ttaggaggggagcagagaac, aatgctctataccctcattt, cgcgcattctatttgtgtag, accttgttagattactggga, gcaagaaagcgctattgctt, gtcaagtttggcgcgaaatc, tagctcctacttttatgagc, tggatattggtggctttcag, gataaaatcctaccagcctt, gctctgctgtttaaaacctg, tgagtcactgagtcctacaa, gacgatgcagttcaatggtc, attttctgtctgagtgagca, tttctggtagaaggttcagc, agtacttgaactcgttcctg, ttacataatcttccacctgc, aagatggtgagactggcaca, gaagaggttgtggtcattct, cttgttctgtcactgtacta, tagctctgggagatgtcaac, ccataatcaccagattctgt, cagtagctattatgcttgct, ttttggcatgtatgaggtgt, aatggagaaccaggttttcc, ttctctgacctgatgatctg, acgacaatttccttgtgtct, tccggttgttcaataagtct, actaatttacaaggccaggc, gggttgtcaatgggaatctg, accatgtctactttacttgc, aacacaaactggctcacctg, cagtgtggaacatcgtgcaa, taaacagaactgcctccgac, acagcttccttctaagacag, tttatgttagcagcttggga, cacaaagagtctgaggtggc, ctctataccgtcttatgtca, gctatgattatcacccttac, caaattcctgcatgatcctt, caaatgtctgttaaccccag, gtctccttttcagtatacac, ttccccaaatcaatttctgg, ctgccagggttacaaacata, cctcgccttctaacacaaaa.
5′-end probes’ sequences
tctgcgggaagcctaagatc, gggaggcaaacggttctaag, ctcttctgcacactgcaatg, cgcgcattctatttgtgtag, catcctatttgtgcagctaa, catcctatttgtgcagctaa, gtcaagtttggcgcgaaatc, cagccttcacgctaggattg, gatggcagcggggataaaat, tgcagttcaatggtcgaacc, atattttgggacacggcgac, agtacttgaactcgttcctg, agaggttgtggtcattcttt, agattctgtttaccttccac, aggttttcctacccataatc, ggtcgattcttctcaggaat, agtcttaaggcatcatccaa, tgccaattccggttgttcaa, tccaaaccatgtctacttta, taaacagaactgcctccgac, ctggttgattcatggcttcc, ccttgtcacaaagagtctga, gtcactttcaaattcctgca, ttccccaaatcaatttctgg, gggtattctgggagaagttt, ctttcttctcgtagacttca, ttaggaggggagcagagaac, agtcccatggtcttataaaa, ctcatagatctaaagccagc, accttgttagattactggga, gacatttcttaaggcacttt, gcactgagacctttatagca, cacttgaggtctcatgggag, cacagtaccctgtgcatatg, tacatcactggggtctcttg, tacttttatgagcccacaca, ctttggacttacctgcctag, ctctgctgtttaaaacctgt, ttctttatagtctgagttcc, agctttgctgcaagtgtgat, gattttctgtctgagtgagc, ttacataatcttccacctgc, gcagacaatttcagtgtttc.
For the experiments where the stress was applied for 15 sec, ~750 bps were transcribed from genomic DNA of DHFR into mRNA. The first 750 bps of the sense sequence of the genomic DNA is found at (http://www.ncbi.nlm.nih.gov/nuccore/NC_000079.6?report=genbank&from=92354783&to=92389053) and listed below:
AGGACGCGCTGGATCTTAGGCTTCCCGCAGACCTGAAGAACCGGCTTAGAACCGTTTGCCTCCCCGGGCCTGGGCCGGCGGCAGTAGAGCCTCCCGACGCGGATTTCCCGCGGGGCATTGCAGTGTGCAGAAGAGCCGGCCTGCTAGGAGCGCGAGCGCGCGGCCGCACTTTCTCGCGCCTGCGCGCGCGCACGCCTCAACCTGTGCGGGACCGGCCTTGGGGGCGGAGCCTTAGCTACACAAATAGAATGCGCGGCGGGCCTTGGTGGGGGCGGGGCCTTAGCTGCACAAATAGGATGCGCGGCGGGCCTTGGTAGGGGCGGAGCCTTAGCTGCACAAATAGGATGCGCGGCGGGCCTTGGTGGGGGCGGGGCCTAAGCTGCGCAAGTGGTACACAGCTCAGGGCTGCGATTTCGCGCCAAACTTGACGGCAATCCTAGCGTGAAGGCTGGTAGGATTTTATCCCCGCTGCCATCATGGTTCGACCATTGAACTGCATCGTCGCCGTGTCCCAAAATATGGGGATTGGCAAGAACGGAGACCTACCCTGGCCTCCGCTCAGGTATTGGCCGGGCTGGGCTCGGGAAACTGAGGCGGTTCACTGAGTAGGGTCATGCACTTGGCTTGGACGCGCGGGACGGGCGTGAGCGGTAGGCCTACCGGCCTCAGCCAGAGACCAAGCTACCGGTTCCCGCGGTGATCCCCCTGCTGTGCCAGCCTTTGCTCACAGGCTCCCTGGCCGGGAGCAAA. The underlined sequences complementarily match the sequences of the first 11 oligos (#5 and #6 have the same sequence) of the 5′-end probes.
3′-end probes’ sequences
tcatgggctagctcagcag, acacaaactggctcacctg, gaccttagaggaaactgct, Gcttccttctaagacaggt, cctctataccgtcttatgt, cccagatatggacgttcaa, gacaggagcaaatgtctgt, agcaccagggatccaaatc, actgccagggttacaaaca, agtctctcccataccacac, tggcttgcaaatacactgc, cacatccttttcaagtgct, ggctgtgacttaatagttt, atgctctataccctcattt, tgatgtgcaactgttctat, gaaagcgctattgctttat, tcaggttatgttcattgca, attctggatattggtggct, ctgagtcactgagtcctac, tgcattggccacttcaatt, tctggtagaaggttcagct, agatggtgagactggcaca, gctctgggagatgtcaaca, tgcgtgctgagcatagcat, ggtgttctcttggtcttat, gtctttcgttttggcatgt, tgtctagatttccagggtg, agccagacgacaatttcct, aactgtgctttctggtgca, ttcttgttttcccatatcc, ccgggttgtcaatgggaat, tcaggatctacacactcca, gtgtggaacatcgtgcaaa, cacagagcaacaagctggc, ttggcagttggagtgtgtc, atgttagcagcttgggac, gtgtttcgtattctttgca, atgattatcacccttaccc, acaatgctttggtggaagc, atcatgtctccttttcagt, cctcgccttctaacacaaa, cctcaaactcaatgagtct.
RNA extraction and qRT-PCR
Total mRNA was isolated using RNeasy Mini Kit (Qiagen) following the manufacturer’s protocol. cDNA was synthesized using iScript Advanced cDNA Synthesis Kit (Bio-Rad Laboratories Inc.). qRT-PCR was performed using SsoAdvanced Universal SYBR Green Supermix (Bio-Rad) using CFX Connect Real-Time PCR Detection System (Bio-Rad) following the manufacturer’s protocol. qPCR primers were purchased from Sigma. The primer sequences are as follows: Lmnb1 (F: 5′-CCTGAAGAACACTTCTGAAC-3′, R: 5′-TTTGCAGCCCATATTGTAAC-3′); Lmnb2 (F: 5′-CCAAGAAACAACTGGAGAAG-3′, R: 5′-GCCATCTTGAAGTCGTACTC-3′); Emd (F: 5′ AGGTTCTCAGACTTGGATTC-3′, R: 5′-CTTGCTCTGGTAAAGTAAGG-3′); Lmna (F: 5′-GCATCACAGAGTCTGAAGAG-3′, R: 5′-ACCCTCCTTCTTGGTATTTC-3′); Banf1 (F: 5′-GCTTTGACAAGGCTTATGTG-3′, R: 5′-TCCCCAGAGTACATTACAAG-3′); Cbx1 (F: 5′-ACAAGGCTTTATTGCTTCTC-3′, R: 5′-CCTCCACTTTCTTCTTGTTC-3′); Cbx5 (F: 5′-ATGGGAAAGAAAACCAAGAG-3′, R: 5′-CAGGACAATCCAAGTTCTTC-3′); LBR (F: 5′-GCATAGAGCTGTGTTATGTG-3′, R: 5′-GTAGACAGCATTTCCAGAAC-3′); SUN1: (F: 5′-GAGCGAGGCAGGAATTTCAG-3′, R: 5′-CCACCATCCCTGTCTTGTCT-3′); SUN2 (F: 5′-GCATGCTTTGGAGGACTGAG-3′, R: 5′-CCACAAGACCCCTAGCTCAA-3′); egr-1 (F: 5′-CTATGCCTCCGTTCCACCTG-3′, R: 5′-CGAAAGCCCAGTTGAAGTGC-3′).
siRNA transfection
Cells were transfected with siRNA using RiboCellin siRNA delivery reagent (Bulldog Bio) following the manufacturer’s protocol. Custom siRNA sequences specific to CHO cells were designed against CHO genome (www.CHOGenome.org). Custom siRNA were synthesized by Sigma. siRNA sequences are: GCAGACGAAACTTTACTTA for Lmnb1 siRNA #1; GCTTTCTAACCTGCAGAAA for Lmnb1 siRNA #2; CCCGGCTGCAGATTGAAAT for Lmnb2 siRNA #1; CCTCAACCCTCAGTGACAA for Lmnb2 siRNA #2; GCCAGAAGAGAACCTGGAT for Cbx1 siRNA #1; CCAAGGAAGCCAATGTCAA for Cbx1 siRNA #2; GGAGCACAATACTTGGGAA for Cbx5 siRNA #1; CCTGAGAAGAACTTGGATT for Cbx5 siRNA #2; GCAGCAGCTCGATGAGTAT for Lmna siRNA #1; GCCTTCGTACAGCTCTCAT for Lmna siRNA #2; CCAGTACAACATCCCGCAT for Emd siRNA #1; CCTGGTCTTTGCTGCCTTT for Emd siRNA #2; GGCAAGAAGCTGGAGGAAA for Banf1 siRNA #1; GGCCAGTTTCTGGTGCTAA for Banf1 siRNA #1; GCTATGAATCCAGAGCTTA for SUN1 siRNA #1; GGATTTGCCTCTGCACCAT for SUN1 siRNA #2; GGTTCCTTCTCCGAGATAA for SUN2 siRNA #1; GCAAGATCCTTGCCAGCAT for SUN2 siRNA #2; CCTGGGAGCTCCCTTTATT for LBR siRNA #1; CCTCCTGCCTTACTTCTAT for LBR siRNA #2. The knockdown efficiencies for mRNAs and proteins were listed in Supplementary Figs. 18 and 19.
Preparation of Polyacrylamide Gels
Polyacrylamide gels were prepared as described (8). The elastic Young’s modulus of the polyacrylamide gels used in this study was 0.6 kPa (0.06% bisacrylamide and 3% acrylamide), 2 kPa (0.05% bisacrylamide and 5% acrylamide), and 8 kPa (0.3% bisacrylamide and 5% acrylamide). The gel was coated with 100 μg ml−1 collagen-1.
Microscopy and live cell imaging
A Leica inverted microscope was used to image the cells. Cy3 cube was excited at 535–550 nm. Live cells were imaged in imaging buffer (20 mM HEPES, 140mM NaCl, 2.5mM KCl, 1.8mM CaCl2, 1mM MgCl2, pH 7.4). Leica DMI6000B and SP8-STED microscope was used to visualize and collect H2B-GFP images. Excitation was 488 nm for GFP. There were generally 2–7 GFP spots per cell. Collagen-1 (16 μg ml−1) was pre-coated and the cells were seeded overnight. For simplicity of % stretching calculation we chose cells that had 2–3 GFP bright spots per cell for imaging. Sometimes a few GFP spot appeared dim in the same cell, suggesting that they were out of focal view, which was confirmed by 3D confocal imaging; these GFP spots were not selected for quantification of displacements. Spontaneous movements of the chromatin were 3.26±0.25 nm (n=36 cells) after fixing the cells with 4% paraformaldehyde; these movements represented inherent microscopic stage drifts and stage vibration and thus were subtracted out. As a first attempt to measure displacements, we only quantified displacements in the x–y plane, although there were also displacements in the z direction, which could be tracked by stacking multiple x–y plane images in the future. Therefore, the change of distance between chromatin GFP spots is an underestimate of the actual change of distance in 3D.
RNA Poly II antibody staining
CHO cells were fixed with a buffer consisting of 4% formaldehyde (BioLegend) for 15 min at room temperature. Cells were then permeabilized with 0.5% Triton X-100 (BioLegend) for 15 min and treated with a blocking buffer consisting of 2% BSA in PBS for 4 h. To quantify distribution of RNA Poly II, we used an anti-RNA Poly II primary antibody. Detection of RNA Poly II was performed using Alexa-conjugated secondary antibodies (Abcam, Cat. No.150074). Cells were incubated with primary antibodies (diluted with 2% BSA buffer at a ratio of 1:100) overnight at 4 °C. After being washed to remove unbound primary antibodies, cells were incubated with the secondary antibody (diluted with 2% BSA buffer at a ratio of 1:1000) for 1 h under dark conditions. To quantify Poly II fluorescence, the images from the microscope were saved in the Tif format. Image J was used to invert the black and white color. The optical density of the inverted image was calibrated and set to scale. Thresholds were adjusted to get rid of auto-fluorescence background noise and fluorescence intensity in the area of interests was quantified.
3D imaging with confocal microscopy and STED nanoscropy
3D fluorescence imaging was performed using a Leica SP8-STED microscope to obtain 3D reconstructive images of the GFP spots in the single chromatin of a spread CHO cell. A × 100 oil immersion objective was used. Each nucleus was imaged using multiple z-stack images with each step of ~0.3 μm. Fluorescence was detected using a Hybrid Detector (HyD) or a photomultiplier tube.
Dynamic tracking and image analysis
MATLAB software (Mathworks) was used for data analysis and image processing. Fluorescent spots were tracked using a customized MATLAB code based on IDL Particle Tracking Software. All DHFR transcription was quantified using RNA FISH probes on single cells. Therefore, for each cell, the bead force direction relative to the cell long axis was known. Sometimes the data from various stress angles were pooled together for reporting measurements of DHFR transcripts. The background was calculated by averaging the fluorescent intensity of non-target areas of the cell image in each cell. After the background was subtracted from the image using ImageJ, the image was zoomed in several times until the boundary of target fluorescence could be visually distinguished. The fluorescent areas were then determined by using the freehand selections tool, and the integrated density was measured as the DHFR expression under various conditions (e.g., no bead and no stress, with bead but no stress, +stress, +drugs, after knockdowns, etc). For egr-1 gene expression experiments, qPCR (real time quantitative polyermerase chain reaction) was used to quantify expression of a cell population and thus the stress angles relative to the cell long axis were not able to be quantified.
Code availability
The customized MATLAB codes to calculate the mean displacements of GFP spots and magnetic beads are fully available and free of charge upon request to the corresponding authors.
Statistical analysis
Two-tailed Student’s t-test was used for all statistical analyses except when multiple comparisons were carried out within a given experiment, where Bonferonni correction was also performed.
Supplementary Material
Acknowledgments
This work was supported by NIH R01 GM072744 (to N.W.) NIH R01 GM58460 (to A.B.), and funds from Huazhong University of Science and Technology, and Ministry of Science and Technology of China grant 2016YFA0101100. A.T. acknowledges partial support from Natural Sciences and Engineering Research Council (NSERC) of Canada through PGS Doctoral Scholarship. R.S. acknowledges support from NSF IGERT program. N.W. acknowledges support from Hoeft Professorship at University of Illinois at Urbana-Champaign.
Footnotes
Author contributions. NW and AB conceived the project. NW, AB, AT, YZ, FW, and JS designed the project. AT, YZ, FW, JS, QJ, WZ, RS, and NK performed experiments and analyses. NW, AT, FW, JS, and AB wrote the manuscript with inputs from all other authors.
Conflict of Interest. The authors declare no conflict of interest.
References
- 1.Discher DE, Mooney DJ, Zandstra PW. Growth factors, matrices, and forces combine and control stem cells. Science. 2009;324:1673–1677. doi: 10.1126/science.1171643. [DOI] [PMC free article] [PubMed] [Google Scholar]
- 2.Vogel V, Sheetz M. Local force and geometry sensing regulate cell functions. Nat Rev Mol Cell Biol. 2006;7:265–275. doi: 10.1038/nrm1890. [DOI] [PubMed] [Google Scholar]
- 3.Friedland JC, Lee MH, Boettiger D. Mechanically activated integrin switch controls alpha5beta1 function. Science. 2009;323:642–644. doi: 10.1126/science.1168441. [DOI] [PubMed] [Google Scholar]
- 4.del Rio A, et al. Stretching single talin rod molecules activates vinculin binding. Science. 2009;323:638–641. doi: 10.1126/science.1162912. [DOI] [PMC free article] [PubMed] [Google Scholar]
- 5.Grashoff C, et al. Measuring mechanical tension across vinculin reveals regulation of focal adhesion dynamics. Nature. 2010;466:263–266. doi: 10.1038/nature09198. [DOI] [PMC free article] [PubMed] [Google Scholar]
- 6.Austen K, et al. Extracellular rigidity sensing by talin isoform-specific mechanical linkages. Nat Cell Biol. 2015;17:1597–606. doi: 10.1038/ncb3268. [DOI] [PMC free article] [PubMed] [Google Scholar]
- 7.Dupont SS, et al. Role of YAP/TAZ in mechanotransduction. Nature. 2011;474:179–183. doi: 10.1038/nature10137. [DOI] [PubMed] [Google Scholar]
- 8.Na S, et al. Rapid signal transduction in living cells is a unique feature of mechanotransduction. Proc Natl Acad Sci USA. 2008;105:6626–6631. doi: 10.1073/pnas.0711704105. [DOI] [PMC free article] [PubMed] [Google Scholar]
- 9.Poh YC, et al. Rapid activation of Rac GTPase in living cells by force is independent of Src. PLoS ONE. 2009;4:e7886. doi: 10.1371/journal.pone.0007886. [DOI] [PMC free article] [PubMed] [Google Scholar]
- 10.Ouyang M, Sun J, Chien S, Wang Y. Determination of hierarchical relationship of Src and Rac at subcellular locations with FRET biosensors. Proc Natl Acad Sci USA. 2008;105:14353–14358. doi: 10.1073/pnas.0807537105. [DOI] [PMC free article] [PubMed] [Google Scholar]
- 11.Poh YC, et al. Dynamic force-induced direct dissociation of protein complexes in a nuclear body in living cells. Nat Commun. 2012;3:866–875. doi: 10.1038/ncomms1873. [DOI] [PMC free article] [PubMed] [Google Scholar]
- 12.Maniotis AJ, Chen CS, Ingber DE. Demonstration of mechanical connections between integrins, cytoskeletal filaments, and nucleoplasm that stabilize nuclear structure. Proc Natl Acad Sci U S A. 1997;94:849–854. doi: 10.1073/pnas.94.3.849. [DOI] [PMC free article] [PubMed] [Google Scholar]
- 13.Hu S, Chen J, Butler JP, Wang N. Prestress mediates force propagation into the nucleus. Biochem Biophys Res Commun. 2005;329:423–428. doi: 10.1016/j.bbrc.2005.02.026. [DOI] [PubMed] [Google Scholar]
- 14.Lammerding J, et al. Lamins A and C but not lamin B1 regulate nuclear mechanics. J Biol Chem. 2006;281:25768–25780. doi: 10.1074/jbc.M513511200. [DOI] [PubMed] [Google Scholar]
- 15.Pajerowski JD, Dahl KN, Zhong FL, Sammak PJ, Discher DE. Physical plasticity of the nucleus in stem cell differentiation. Proc Natl Acad Sci U S A. 2007;104:15619–15624. doi: 10.1073/pnas.0702576104. [DOI] [PMC free article] [PubMed] [Google Scholar]
- 16.Lee JS, et al. Nuclear lamin A/C deficiency induces defects in cell mechanics, polarization, and migration. Biophys J. 2007;93:2542–2552. doi: 10.1529/biophysj.106.102426. [DOI] [PMC free article] [PubMed] [Google Scholar]
- 17.Swift J, et al. Nuclear lamin-A scales with tissue stiffness and enhances matrix-directed differentiation. Science. 2013;341:1240104. doi: 10.1126/science.1240104. [DOI] [PMC free article] [PubMed] [Google Scholar]
- 18.Ho CY, Jaalouk DE, Vartiainen MK, Lammerding J. Lamin A/C and emerin regulate MKL1-SRF activity by modulating actin dynamics. Nature. 2013;497:507–511. doi: 10.1038/nature12105. [DOI] [PMC free article] [PubMed] [Google Scholar]
- 19.Jain N, Iyer KV, Kumar A, Shivashankar GV. Cell geometric constraints induce modular gene-expression patterns via redistribution of HDAC3 regulated by actomyosin contractility. Proc Natl Acad Sci U S A. 2013;110:11349–54. doi: 10.1073/pnas.1300801110. [DOI] [PMC free article] [PubMed] [Google Scholar]
- 20.Guilluy C, et al. Isolated nuclei adapt to force and reveal a mechanotransduction pathway in the nucleus. Nat Cell Biol. 2014;16:376–381. doi: 10.1038/ncb2927. [DOI] [PMC free article] [PubMed] [Google Scholar]
- 21.Poirier MG, Eroglu S, Marko JF. The bending rigidity of mitotic chromosomes. Mol Biol Cell. 2002;13:2170–2179. doi: 10.1091/mbc.01-08-0401. [DOI] [PMC free article] [PubMed] [Google Scholar]
- 22.Houchmandzadeh B, Marko JF, Chatenay D, Libchaber A. Elasticity and structure of eukaryote chromosomes studied by micromanipulation and micropipette aspiration. J Cell Biol. 1997;139:1–12. doi: 10.1083/jcb.139.1.1. [DOI] [PMC free article] [PubMed] [Google Scholar]
- 23.Carpenter AE, Memedula S, Plutz MJ, Belmont AS. Common effects of acidic activators on large-scale chromatin structure and transcription. Mol Cell Biol. 2005;25:958–68. doi: 10.1128/MCB.25.3.958-968.2005. [DOI] [PMC free article] [PubMed] [Google Scholar]
- 24.Chuang CH, et al. Long-range directional movement of an interphase chromosome site. Curr Biol. 2006;16:825–31. doi: 10.1016/j.cub.2006.03.059. [DOI] [PubMed] [Google Scholar]
- 25.Therizols P, et al. Chromatin decondensation is sufficient to alter nuclear organization in embryonic stem cells. Science. 2014;346:1238–1242. doi: 10.1126/science.1259587. [DOI] [PMC free article] [PubMed] [Google Scholar]
- 26.Hu Y, Kireev I, Plutz M, Ashourian N, Belmont AS. Large-scale chromatin structure of inducible genes: transcription on a condensed, linear template. J Cell Biol. 2009;185:87–100. doi: 10.1083/jcb.200809196. [DOI] [PMC free article] [PubMed] [Google Scholar]
- 27.Hu S, et al. Mechanical anisotropy of adherent cells probed by a three dimensional magnetic twisting device. Am J Physiol Cell Physiol. 2004;287:C1184–C1191. doi: 10.1152/ajpcell.00224.2004. [DOI] [PubMed] [Google Scholar]
- 28.Wang N, Tytell JD, Ingber DE. Mechanotransduction at a distance: mechanically coupling the extracellular matrix with the nucleus. Nat Rev Mol Cell Biol. 2009;10:75–82. doi: 10.1038/nrm2594. [DOI] [PubMed] [Google Scholar]
- 29.Tan Y, et al. Matrix softness regulates plasticity of tumour-repopulating cells via H3K9 demethylation and Sox2 expression. Nat Commun. 2014;5:4619. doi: 10.1038/ncomms5619. [DOI] [PMC free article] [PubMed] [Google Scholar]
- 30.Engler AJ, Sen S, Sweeney HL, Discher DE. Matrix elasticity directs stem cell lineage specification. Cell. 2006;126:677–689. doi: 10.1016/j.cell.2006.06.044. [DOI] [PubMed] [Google Scholar]
- 31.Liu J, et al. Soft fibrin gels promote selection and growth of tumorigenic cells. Nat Mater. 2012;11:734–41. doi: 10.1038/nmat3361. [DOI] [PMC free article] [PubMed] [Google Scholar]
- 32.Dingal PC, Discher DE. Systems mechanobiology: tension-inhibited protein turnover is sufficient to physically control gene circuits. Biophys J. 2014;107:2734–2743. doi: 10.1016/j.bpj.2014.10.042. [DOI] [PMC free article] [PubMed] [Google Scholar]
- 33.Sinclair P, Bian Q, Plutz MM, Heard E, Belmont AS. Dynamic plasticity of large-scale chromatin structure revealed by self-assembly of engineered chromosome regions. J Cell Biol. 2010;190:761–76. doi: 10.1083/jcb.200912167. [DOI] [PMC free article] [PubMed] [Google Scholar]
- 34.Schwachtgen JL, Houston P, Campbell C, Sukhatme V, Braddock M. Fluid shear stress activation of egr-1 transcription in cultured human endothelial and epithelial cells is mediated via the extracellular signal-related kinase 1/2 mitogen-activated protein kinase pathway. J Clin Invest. 1998;101:2540–9. doi: 10.1172/JCI1404. [DOI] [PMC free article] [PubMed] [Google Scholar]
- 35.Legant WR, et al. Multidimensional traction force microscopy reveals out-of-plane rotational moments about focal adhesions. Proc Natl Acad Sci U S A. 2013;110:881–6. doi: 10.1073/pnas.1207997110. [DOI] [PMC free article] [PubMed] [Google Scholar]
Associated Data
This section collects any data citations, data availability statements, or supplementary materials included in this article.