

Abstract
DosS is a sensor in Mycobacterium tuberculosis that differentially responds to O2, NO, and CO, as well as to changes in the redox state of the prosthetic heme iron atom. The ferrous protein and its Fe(II)-NO and Fe(II)-CO complexes undergo autophosphorylation and subsequently transfer the phosphate group to DosR, a nuclear factor, to activate it. In contrast, autophosphorylation is negligible with the ferric protein and the Fe(II)-O2 complex. To clarify the basis for this differential response to gases, we have determined the crystal structures of the NO- and CO-complexes of the DosS GAF-A domain, which contains the heme to which the gases bind. Comparison of these crystal structures with those reported for the phosphorylation-inactive ferric GAF-A domain suggest that the GAF-A domain is in a dynamic equilibrium between active and inactive states, and that the position of Glu87 in the heme cavity, which depends on the which gas is bound, acts as a modulator of the equilibrium, and therefore of catalytic activity.
Keywords: Mycobacterium tuberculosis, DosS, gas sensor, hemoprotein, conformational selection, x-ray crystallography
Graphical abstract
1. Introduction
Mycobacterium tuberculosis (Mtb) is a rod-shaped bacterium that causes most cases of tuberculosis in humans and results in over 1.7 million deaths each year [1]. The high level of Mtb in developing nations and the emergence of multi-drug resistant strains pose a serious threat to public health [2]. This threat is exacerbated by an environment in which industrial antibiotic development is not a priority due to a low return on investment [3]. Infection initially occurs in alveolar macrophages, in which the bacteria can reside in a non-replicating dormant state for prolonged periods [4], only to reemerge at a later time in immune-compromised individuals. The entry into dormancy allows the mycobacteria to evade the killing action of most commonly used antimicrobials [5]. Slightly elevated nitric oxide (NO) and carbon monoxide (CO) levels, as well as low O2 concentrations in Mtb-engulfing granulomas, alter the expression of a 48-gene dormancy regulon (Dos) [1,3,4,6,7]. Two Mtb gas-sensing kinases, DosS and DosT, are important in turning on these genes and the consequent transition into dormancy [8,9]. DosS and DosT have four domains: a heme containing GAF-A domain, an adjacent GAF-B domain of unknown function, a histidine kinase domain, and finally an ATP binding domain. Both DosS and DosT undergo autophosphorylation at a conserved histidine in the kinase domain. This phosphate group is then transferred to an aspartate residue of DosR, the Dos regulon transcription factor. The heme groups in the GAF-A domains of both DosS and DosT have a histidine as the proximal iron ligand [10,11] and the kinase domain is catalytically active when the iron is reduced from the Fe(III) to the Fe(II) state, and more so when CO or NO is bound to the ferrous iron. Oxidation of the heme iron to the ferric state results in almost complete loss of activity. Although DosS and DosT are highly homologous (62% identity), UV-vis and EPR spectroscopy have shown that reduced ferrous DosS is prone to autooxidation to the ferric state in the presence of oxygen, whereas under the same conditions ferrous DosT forms a dioxygen complex that is stable for days [12,13]. The crystal structures of the ferric and ferrous DosS and DosT GAF-A domains have been reported [14,15]. However, they provide only limited insight into the structural accommodations caused by the binding of ligands to the iron atom. Here we investigate the molecular mechanism of gas signaling mediated by the DosS GAF-A domain by determining the structures of the ferrous NO- and CO-bound proteins, the first DosS structures with a physiologically relevant gas ligand bound to the iron atom.
2. Materials and methods
2.1. Cloning of DosS GAF-A domain
We designed a construct analogous to the pHIS-Parallel [16] construct used for previous DosS GAF-A domain crystal structure determinations [15]. The GAF-A domain consisting of nucleotides encoding amino acids 63–210 followed by a stop codon was synthesized by Genewiz, Inc. (Berkeley, CA) and was provided in a pUC57 plasmid. The insert, containing a 5’ histidine tag followed by a spacer, TEV cleavage site, and the GAF-A domain, was flanked by NdeI and EcoRI restriction sites. The resulting protein product was identical to that previously reported except for the loss of a Glu prior to amino acid 63, resulting in four additional amino acids (Met-Ser-Asp-Pro) rather then five (Met-Ser-Glu-Asp-Pro) preceding Asp63. The insert was amplified with pFU Ultra II (Agilent Technologies) using a standard protocol employing forward (5’-ATG TTC ATA TGT CGT ACT ACC ATC ACC AT -3’) and reverse primers (5’-TTG GAA TTC TCA CTT AGC CTG CTG GTA G -3’), then cut with NdeI/EcoRI, and ligated into similarly cut pET-22b(+) (Life Technologies), to give a plasmid hereafter referred to as pDG22b. The plasmid integrity was confirmed by DNA sequencing.
2.2. DosS GAF-A domain expression and purification
Fresh colonies of BL21-Gold (DE3) cells harboring the pDG22b plasmid were grown overnight on Luria-Bertani broth (LB) agar plates supplemented with 100 mg/ml ampicillin. Colonies were resuspended in ~5 ml of LB broth, inoculated into 100 ml of LB supplemented with 100 μg/ml ampicillin, and allowed to grow at 37 °C for 4 h. One liter flasks were inoculated with 10 ml of this starter culture and incubated at 220 RPM and 37 °C. When the culture reached O.D600 ~ 1.0, the temperature was turned down to 18 °C, followed by addition of 0.2 mM isopropyl β-D-1-thiogalactopyranoside and 200 μM δ-aminolevulinic acid (final concentrations). Shaking was continued at 220 RPM and the culture was harvested 38 h later, yielding a dark red cell pellet. The cells from 6 liters of culture were lysed in 50 mM Kpi, pH 7.5, that included 100 mM NaCl, 20 mM imidazole, 0.5 mg/ml lysozyme, 20 μg DNAse, 10 mM MgCl2, 50 mM phenylmethylsulfonylfluoride, and 2 tablets of EDTA-free protease inhibitors (Roche). The cells were lysed by sonication and spun down at 20,000 RPM for 40 min. The soluble fraction was passed over a Ni-NTA column equilibrated in 50 mM Kpi, pH 7.4, containing 300 mM NaCl and 20 mM imidazole. The column was washed with equilibration buffer before DosS was eluted with a gradient from 20–250 mM imidazole. Pooled fractions were dialyzed into TEV protease buffer (50 mM Tris pH 8, 0.5 mM EDTA, 1 mM DTT) and were cleaved with AcTEV™ (Life Technologies) for 3 days at 4 °C. The cleaved DosS GAF-A domain was passed through a Ni-NTA column, concentrated and loaded onto a 26/60 Superdex S200 gel filtration column (GE Health Sciences) equilibrated in 20 mM Tris pH 7.5. The enzyme, which ran as a dimer at approximately 36 kDa, was concentrated to 1 mM for crystallography.
2.3. DosS GAF-A domain crystallography
Crystals were grown under similar conditions as previously reported (15–18% PEG 4000, 100 mM Tris pH 7, 200 mM calcium acetate) except that a mixture of 1.5 μl protein and 0.5 μl well solution was used instead of a 1:1 ratio [15]. The crystals were then transferred to a cryo solution consisting of 20% PEG4K, 175 mM calcium acetate, 10% glycerol and 10% (wt/vol) sucrose. They were then transferred in 10 μl of cryo solution to an Eppendorf placed inside an airtight Wheaton glass vial followed by purging with nitrogen. The vials were moved to an oxygen free anaerobic chamber where the crystals were slowly diluted with 400 μl CO- or NO-purged cryo buffer containing 20 mM sodium dithionite (added after purging). The vials were resealed and removed from the glove box in preparation for freezing. Upon breaking the seal, crystals were transferred to a depression-well plate and frozen in liquid nitrogen as fast as possible (typically less than 1 min).
Diffraction data for the CO- and NO-bound DosS GAF-A domain proteins were collected at the Advanced Light Source (Lawrence Berkeley National Laboratory), beamline 8.3.1. For the CO-bound DosS GAF-A, 4 s exposures were collected in 0.8° oscillations from Φ = 48° to Φ = 152° with a crystal to detector distance of 250 mm. The NO-bound data were collected using 1° oscillations from = 79° to = 184° and 1 s exposures. Data were integrated and scaled in XDS [17]. Intensities were converted to structure factors using Truncate from the CCP4 suite [18] and 5% of the data was flagged for an Rfree test set. The unit cells (Table 1) differed enough from previously published structures that molecular replacement was necessary for phasing using pdb file 2W3D and Phaser [19]. Refinement was performed in the Phenix package [20] with a strategy that included individual coordinates, isotropic B-factors for individual atoms as well as TLS groups as outlined in Table 1.
Table 1.
Data collection and refinement statistics
| Data set | DosS-CO PDB ID: 4YNR | DosS-NO PDB ID: 4YOF |
|---|---|---|
| Radiation source | ALS 8.3.1 | ALS 8.3.1 |
| Space group | P212121 | P212121 |
| Unit cell dimensions (a,b,c) (Å) | 33.505, 79.247, 109.451 | 33.593, 78.847, 110.645 |
| Resolution Range (Å) | 30 – 1.92 (2.0033–1.9162) | 37 – 1.90 (1.9755–1.8995) |
| Wavelength (Å) | 1.115872 | 0.978550 |
| Total observations | 85,537 | 98,096 |
| Unique reflections(highest shell) | 22,480 (3,125) | 23,788 (3,757) |
| Completeness (%)(highest shell) | 96.9 (85.4) | 99.1 (98.8) |
| CC(1/2) (highest shell) | 99.9 (65.8) | 99.9 (79.4) |
| Rmeas (highest shell) | .062 (0.75) | .061 (0.62) |
| <I/σ> (highest shell) | 17.8 (1.7) | 16.7 (2.49) |
| Redundancy (highest shell) | 3.8 (2.9) | 4.1 (4.1) |
| B factor, Wilson plot (Å2) | 31.3 | 36.8 |
| Reflections used in refinement | 22,479 | 23,787 |
| Resolution range (Å) used in refinement | 19.01 – 1.92 | 37.14 – 1.90 |
| No. of protein atoms fit | 2,156 | 2,205 |
| No. of heteroatoms fit | 90 | 90 |
| No. of waters fit | 141 | 149 |
| Rwork % | 18.5 | 18.6 |
| Rfree % | 23.4 | 22.5 |
| RMSD Bond length (Å) | .008 | .008 |
| RMSD Bond angle ° | 1.31 | 1.25 |
| Standard Uncertainty Maximum Likelyhood (Å) | 0.21 | 0.21 |
| Average B, heteroatoms | 29.5 | 29.6 |
| Average B, protein atoms | 43.1 | 42.2 |
RMSD, root mean square deviation
3. Results
3.1. CO-Bound DosS GAF-A Domain Crystal Structure
The DosS GAF-A domain crystallizes as a dimer (Fig. 1A) with two monomers of the DosS GAF-A domain in the asymmetric orthorhombic space group (Table 1). The dimer interface involves the hydrophobic regions of the N and C-terminal helices. This dimer is probably also present in solution, as the GAF-A domain purifies at an approximate molecular weight of 30 kDa on a Superdex 200 column (see methods). The PDBe PISA (v.1.51) webserver also predicts the dimer to exist in solution with a buried surface area of 4120 Å2. Each monomer in the dimer is related by a non-crystallographic symmetry operator that rotates around the z-axis parallel to helices H1 and H6 (see Fig. 1B). There is an overall 0.46 Å RMSD between the two monomers.
Fig. 1.

Structure of the ferrous, CO-bound DosS GAF-A domain: (A) Crystallographic dimer interface and (B) structure of chain B of the crystallographic dimer with the structural elements differentially colored. The pseudo non-crystallographic 2-fold axis in the dimer is parallel to the H1 and H6 helices and is located between the two monomer structures perpendicular to the plane of the figure. According to convention, in B the N-terminus is blue and the C-terminus red, with each structural element in a color that transitions between these two extremes. The proximal histidine iron ligand is not shown for clarity.
Although speculative, one possible interpretation of the formation of the GAF-A dimer in solution and in the crystal is that the GAF-A and GAF-B domains form such an internal dimer interface in the full-length protein.
The general topology of the CO-bound crystal structure (chain B) is depicted in Fig. 1B. The GAF-A domain has four beta strands (β2, β1, β5 and β4) that provide the majority of the binding pocket residues. N-terminal and C-terminal helices (H1 and H6) are paired in hydrophobic contacts with each other and the active site β-strands. A heme-b moiety with a histidine as the proximal iron ligand forms the floor of the binding pocket. In Fig. 2B, monomer B of the CO bound structure is shown aligned at the heme against the reduced Fe(II) crystal structure (PDB ID: 2W3F). While the β4-β5 loop in chain B was modeled fully, in chain A the β4-β5 loop residues 163–165 could not be modeled due to poor electron density. The overall structure is shown to pivot almost as a unit counterclockwise about helix H3. This creates an offset in the H1 and H6 helices as well as the beta sheets running along the binding pocket. This rotation is particularly evident when viewed as color coded RMSD values as in Fig. 2B, where red shows deviations greater than 1.5Å. The greatest deviations occur at the N-terminus of helix H1 and the C-terminus of helix H6, and in the β4-β5 and β1-β2 loops.
Fig. 2.

Illustration of the changes undergone in conversion of the DosS GAF-A domain from: (A) the ferric to the ligand-free Fe(II) state; (B) the ligand-free Fe(II) to the Fe(II)-CO complex; and (C) the ligand-free Fe(II) to the Fe(II)-NO complex. The lower model in each pair is rotated relative to the upper model by 90° about a vertical axis through the iron atom. The structural elements are color coded to indicate RMSD changes, with red representing the largest changes and deep blue the lowest. The specific RMSD values are shown in Table 2. In (A), the N- and C-termini of the protein are labeled.
The CO ligand binds with an N-Fe-C angle of ~176° in molecule A and 178° in molecule B (Table 2), close to the theoretical value of 180° for heme-iron CO binding. In Fig. 3A the DosS GAF-A heme-CO (4YNR) complex is shown with the CO ligand inside positive omit-map density scaled to 3-sigma. The Fe-C atom distances are also close to the ideal value of 1.9 Å. In Fig. 4A, the CO ligand is depicted surrounded by hydrophobic pocket residues, including Ile121, which has an alternate conformation. In Fig. 5B, the Fe(II)-CO and unligated Fe(II) crystal structures are aligned, showing key residues and water molecules in the active site. The Tyr171 residue at 2.7 Å is within hydrogen-bonding distance to the CO oxygen atom. The water molecules present in the reduced structure (blue) have vacated in the CO bound structure (yellow). The counter clockwise rotation causes key active site residues to shift position. Phe98, Tyr95, Tyr171, His89, Glu87, Ile121, Ile125 and Pro115 also shift counter clockwise. However, the Glu87-His89 salt bridge present in the reduced structure is maintained upon binding CO. The translation of the H4 helix causes Ile125 and especially Ile121 to penetrate deeper into the active site. This entry of Ile121 into the active site in the CO bound structure increases the hydrophobic environment and causes loss of active site water that is present in the unligated Fe(II) crystal structure.
Table 2.
RMSD values for structural elements.
| 4YNR aligned on | 4YOF aligned on | |||
|---|---|---|---|---|
| Regiona | Monomer A | Monomer B | Monomer A | Monomer B |
| Loop β1-β2 | 5.32b | 4,66 | 4.06 | 3.08 |
| Loop β4-β5 | 4.20 | 2.57 | 2.47 | 1.18 |
| N-term H1 | 5.34 | 5.62 | 4.60 | 4.78 |
| C-term H6 | 4.68 | 5.14 | 4.15 | 4.52 |
Loop β1-β2 measured at GLN92; Loop β4-β5 measured at VAL161 (4YOF/A), VAL162 (4YNR/A), and ARG164 (4YOF/B and 4YNR/B); N-term H1 measured at ASP61 (monomer A) and ASP63 (monomer B); C-term H6 measured at ARG204 (4YOF/A) and ALA203 (others)
Monomers were aligned at the heme and the maximum rmsd of a given region in the other monomer was measured in Å
Fig. 3.

The DosS GAF-A (A) heme-CO (4YNR) and (B) heme-NO (4YOF) complexes, with the CO and NO ligands, respectively, shown inside positive omit-map density scaled to 3-sigma. For clarity, the surrounding protein atoms have been omitted. This figure was generated with UCSF Chimera [21].
Fig. 4.

DosS GAF-A domain active sites from the crystal structures of: (A) the Fe(II)-CO complex, (B) Chain A of the Fe(II)-NO complex, and (C) Chain B of the Fe(II)-NO complex.
Fig. 5.

The position of key residues and water molecules in alignments of the unligated Fe(II) DosS GAF-A domain (purple) with: (A) the Fe(III) protein (gray); (B) the Fe(II)-CO complex (yellow); and (C) the Fe(II)-NO (magenta) complex. Water molecules are shown as free-floating spheres.
3.2. DosS GAF-A NO-Bound Crystal Structure
The Fe(II)-NO bound GAF-A domain is similar in structure to that of the CO bound structure. As in the case of the CO-bound structure, residues 161–162 of the β4-β5 loop are missing from Chain A due to poor electron density. The dimer topology is analogous to that of the CO-bound crystal structure with an all-atom RMSD of 0.36 Å between the two monomers. In Fig. 2C, monomer B of the Fe(II)-NO crystal structure is shown aligned at the heme against the reduced Fe(II) bound structure. The counterclockwise rotation around helix H3 is analogous to that described above for CO bound DosS, although the degree of movement in all regions is noticeably reduced in both monomers. The H4 helix and Ile121 do not move as far into the active site as in the CO-bound structure, as seen when comparing Fig. 5B and Fig. 5C. In Fig. 4B, NO bends towards the Y171 ligand while in Figure 4C it bends away from it. In both cases the NO oxygen atom is within hydrogen bonding distance of the Tyr171 hydroxyl (2.5 Å and 2.9 Å, respectively). NO has one electron in it’s π* antibonding orbital giving maximal overlap with an empty iron 3d orbital at an Fe-N-O angle of ~ 140° [22] and Fe-N distance of 1.7 Å (Table 3 and Fig. 4C). The experimental Fe-N-O angles for chain A and B are about 153° and 155°, respectively. Deviations from ideal geometry are common in enzymes where active site amino acids interact with the distal atom of the gaseous ligand. Myoglobin, in particular, takes values from 109°–160° when binding NO [23]. In comparison to the CO-bound structure, the NO ligand tilt allows two water molecules into the active site. The two water molecules above the Tyr171 side-chain are actually alternate conformations of the same water entity. A hydrogen bond network is present between the active site water molecules and the Tyr171 OH group, the NO oxygen atom, and the heme propionate oxygen atom. The presence of these water molecules most likely prevents Ile121 from further entering the active site, in contrast to its behavior in the CO bound crystal structure.
Table 3.
Bond angles and bond lengths in the crystal structures of the DosS GAF-A domain Fe(II)-CO and Fe(II)-NO complexes
| Crystal structure | Nε-Fe-C/N angle Å | Fe-C/N distance Å | Nε-Fe distance Å |
|---|---|---|---|
| DosS GAF-A-CO chain A | 175.8 | 1.94 | 2.16 |
| DosS GAF-A-CO chain B | 178.1 | 1.84 | 2.08 |
| DosS GAF-A-NO chain A | 155.2 | 1.67 | 2.07 |
| DosS GAF-A-NO chain B | 153.7 | 1.71 | 2.08 |
These structures cannot be compared to that of the DosS GAF-A Fe(II)-O2 complex because autooxidation of this complex to the ferric state has prevented determination of its structure. Our earlier crystal structure of the DosT GAF-A domain contained two protein monomers in the unit cell, one in the unligated ferrous state and the other with a molecule of oxygen bound to the iron atom [14]. However, this structure is not suitable for comparison because (a) the critical hydrogen-bonding residues Glu87 and His89 of DosS are replaced in DosT by Gly85 and Arg89, (b) the bound oxygen molecule in DosT has an unusually long Fe-O bond distance (2.60 Å versus 2.37 Å for that in the Escherichia coli EcDos PAS domain) and thus may be abnormally ligated [24], and (c) the activations of DosS and DosT may not be mediated by identical mechanisms.
The structure of the DosS GAF-A Fe(III)-CN complex was determined by Cho et al. [15], who used it as a generic model for diatomic ligand coordination. The Fe(III)-CN complex of P450cam was used by others as a surrogate for the Fe(II)-O2 complex of that protein [25] and was found to mimic the O2 iron geometry and the structural changes found in the authentic P450cam Fe(II)-O2 complex [26,27]. The crystal structure of the DosS GAF-A Fe(III)-CN complex is aligned in Fig. 6 with the structures of the Fe(II)-CO and Fe(II)-NO complexes. This alignment shows that the crystal structures are largely similar with the greatest difference in the β1-β2 loop, where the CN- bound structure moves the furthest of the three (maximum of 3.9 Å) relative to the ferrous, unliganded structure. Glu87 in the Fe(III)-CN complex flips upward to approximately the same position as in the Fe(II)-CO and Fe(II)-NO structures.
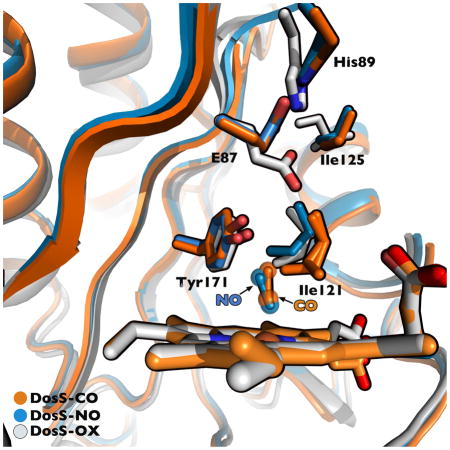
Fig. 6.

Superposition of the crystal structures of the DosS GAF-A domain in the Fe(II)-CO (yellow), Fe(II)-NO (magenta, and Fe(III)-CN (grey) states. The alignment was done by superposition of the heme groups.
4. Discussion
Full-length DosS is a four domain protein that must undergo some degree of conformational deformation to communicate the state of the GAF-A domain to the histidine kinase domain in order for histidine autophosphorylation to occur, an event that takes place nearly 200 amino acids away in the linear sequence. We report here the subtle changes that occur in the GAF-A crystal structure upon binding of NO and CO to the ferrous protein. Under anaerobic conditions, DosS has a robust autophosphorylation activity in both of these ligand-bound states, as well as in the ferrous state with no ligand coordinated to the heme iron atom [12, 28].
Only small structural shifts are required to accommodate the differences in the size and orientation of the iron ligands in DosS (and DosT). It is generally agreed that DosT is a gas and hypoxia sensor, whereas the role of DosS is less clear. In the ferrous state DosS, like DosT, responds to CO and NO, but its ready autooxidation in the presence of oxygen makes it unclear whether the very low autophosphorylation activity observed with oxygen is due to the ferrous dioxy complex or to the autooxidatively generated ferric state. In fact, DosS may have a dual function as both a gas and redox sensor [12].
Proteins in solution are flexible and constantly sample a range of conformations, among which there is a subset that enables autophosphorylation. Reducing the heme iron causes Glu87 to flip away from Tyr171, disrupting the cross-linked hydrogen-bonding network that is present in the ferric enzyme. Because the ferrous enzyme has robust autophosphorylation activity [12], it is likely that disruption of the interconnected hydrogen-bonding network is important for increased sampling of the catalytically productive conformations. From this perspective, anything that disrupts the hydrogen-bonding network might result in increased enzyme activity. Our molecular dynamics analysis of the ferric DosS GAF-A domain revealed a decreased flexibility, particularly in the H6 helix of the wild-type protein, compared to the E87G and E87A mutants [29]. The observation that the E87G and E87A mutants have some autophosphorylation activity in the presence of oxygen may be a result of the increased flexibility modeled by MD simulations. The binding of ligands to the iron may cause a shift in the equilibrium towards conformations that favor optimal enzyme activity. Furthermore, the NO and CO ligands will stabilize the ferrous, catalytically active state, by inhibiting autoxidation [12]. CO binding has specifically been shown to slow down the oxidation from Fe(II) to Fe(III) with a Koff of 0.6 s−1 for CO vs. 12.5 s−1 for O2 [30].
A low residual autophosphorylation activity of the ferric DosS protein is evidenced by the fact that the autophosphorylated protein slowly accumulates even in the presence of oxygen [12,28,30]. The equilibrium between enzymatically non-productive and productive conformations, albeit unfavorable, thus results in slow accumulation of the phosphorylated product. This requires that: (a) the rate of autooxidation in the presence of O2 is on the same time scale as the rate at which DosS samples productive conformations, and (b) reoxidation of Fe(II) to Fe(III) is accompanied by a Glu87 flip back to it’s position in the oxidized conformation. The ferrous DosS GAF-A domain autoxidizes with a t½ ~ 1.1 ms−1 in the absence of chelators [30], a time that is at the minimum end of the time range for large scale protein conformational changes [31]. Evidence that the second condition is met is provided by a previously published DosS GAF-A crystal structure in which the protein had been reduced and subsequently reoxidized, (PDB ID:2W3G) [15]. In this instance both the reduced and oxidized states have been frozen in time within the same DosS GAF-A dimer (Fig. 7). Molecule A (grey) shows the reoxidized state in which Glu87 has flipped back towards Tyr171 to complete the H-bond network characteristic of the oxidized state. Molecule A is aligned against molecule B (aqua), in which autooxidation has not yet occurred, and in which Glu87 is flipped upwards. Subtle differences can also be seen in the H4 helix and β1-β2 loops. The appearance of both oxidized and reduced conformations within a single dimer suggests that in solution the conformation characteristic of the oxidized enzyme is freely reversible. Therefore there is a competition between sampling molecular motions that induce autophosphorylation and oxygen binding/autooxidation of the Fe(II) iron, with the presence of oxygen favoring oxygen binding and return to the less flexible ferric state.
Fig. 7.

Superposition of the two structures of the DosS GAF-A domain occurring in a single crystallographic dimer. Molecule A (grey), which has been reduced and then undergone autooxidation to the ferric state, has Glu87 flipped downwards toward Tyr171. In Molecule B (aqua), autooxidation has not yet occurred and Glu87 is flipped upwards. The relevant residues are labeled. The structures are taken from PDB files 2W3E and 2W3G [15].
This view of ligand-assisted conformational selection, in which the inherent conformational equilibrium of the ferrous sensor is enhanced by binding of CO or NO, both of which disrupt the hydrogen bonding network and favor an upward swing of Glu87, is supported by the crystal structures reported here, as well as by earlier mutagenesis experiments, molecular dynamics simulations, and resonance Raman results [29]. However, an additional factor contributes to the promotion of DosS autophosphosphorylation. As discussed earlier, the crystal structure of the ferric DosS GAF-A domain with cyanide bound to the iron exhibits a conformation analogous, but not identical, to those of the ferrous CO- and NO-complexes (Fig. 6). Early microarray expression profiling showed that low levels of cyanide prevented induction of the dormancy regulon by NO and hypoxia [32]. This suggests indirectly that the ferric cyano complex has low autophosphorylation activity. We have directly measured the activity of DosS in the presence of cyanide by the protocol of Basudhar et al. [29] and shown it to have negligible autophosphorylation activity. The inactivity of the Fe(III)-CN complex, in view of the conformational similarities of the Fe(III)-CN with the Fe(II), Fe(II)-CO, Fe(II)-NO proteins, in all of which the hydrogen bond network is disrupted and Glu87 has flipped upwards, implies that a subtle difference enables autophosphorylation by the ferrous protein and the CO and NO complexes, but not the Fe(III)-CN complex. It is possible that the conformation of the Fe(III)-CN complex, in which the β1-β2 loop is less able than the other two to “search” for the precise conformation that is required for catalysis to occur.
Highlights.
M. tuberculosis DosS is a gas sensor that controls entry into the latent state.
DosS autophosphorylation occurs in the Fe(II)-CO and -NO, but not Fe(II)-O2, states.
DosS has a heme in the GAF-A domain 200 amino acids from the autophosphorylation site.
The active GAF-A conformations differ from that of the inactive Fe(III) state.
The crystal structures favor a conformational equilibrium signaling mechanism.
Acknowledgments
We thank Debashree Basudhar for measuring the autophosphorylation activity of the DosS Fe(III)-CN complex.
Funding:
This work was supported by National Institutes of Health grant AI074824. X-ray data was obtained at the Advanced Light Source (ALS) in Berkeley, CA. ALS is a national user facility supported by the Director, Office of Science, Office of Basic Energy Sciences, of the U. S. Department of Energy under Contract DE-ACO2-05CH11231.
Footnotes
Publisher's Disclaimer: This is a PDF file of an unedited manuscript that has been accepted for publication. As a service to our customers we are providing this early version of the manuscript. The manuscript will undergo copyediting, typesetting, and review of the resulting proof before it is published in its final citable form. Please note that during the production process errors may be discovered which could affect the content, and all legal disclaimers that apply to the journal pertain.
References
- 1.Lawn SD, Zumla AI. Tuberculosis. Lancet. 2011;378:57–72. doi: 10.1016/S0140-6736(10)62173-3. [DOI] [PubMed] [Google Scholar]
- 2.Migliori GB, Dheda K, Centis R, Mwaba P, Bates M, O’Grady J, Hoelscher M, Zumla A. Review of multidrug-resistant and extensively drug-resistant TB: global perspectives with a focus on sub-Saharan Africa. Tropical Med Internat Health. 2010;15:1052–1066. doi: 10.1111/j.1365-3156.2010.02581.x. [DOI] [PubMed] [Google Scholar]
- 3.Norrby SR, Nord CE, Finch R. Lack of development of new antimicrobial drugs: a potential serious threat to public health. Lancet Infect Dis. 2005;5:115–119. doi: 10.1016/S1473-3099(05)01283-1. [DOI] [PubMed] [Google Scholar]
- 4.Wayne LG, Sohaskey CD. Nonreplicating persistence of Mycobacterium tuberculosis. Annu Rev Microbiol. 2001;55:139–163. doi: 10.1146/annurev.micro.55.1.139. [DOI] [PubMed] [Google Scholar]
- 5.Wayne LG. Dormancy of Mycobacterium tuberculosis and latency of disease. Eur J Clin Microbiol Infect Dis. 1994;13:908–914. doi: 10.1007/BF02111491. [DOI] [PubMed] [Google Scholar]
- 6.Sherman DR, Voskuil M, Schnappinger D, Liao R, Harraell MI, Schoolnik GK. Regulation of the Mycobacterium tuberculosis hypoxic response gene encoding alpha-crystallin. Proc Natl Acad Sci USA. 2001;98:7534–7539. doi: 10.1073/pnas.121172498. [DOI] [PMC free article] [PubMed] [Google Scholar]
- 7.Kumar A, Deshane JS, Crossman DK, Bolisetty S, Yan BS, Kramnik I, Agarwal A, Steyn AJ. Heme oxygenase-1-derived carbon monoxide induces the Mycobacterium tuberculosis dormancy regulon. J Biol Chem. 2008;283:18032–18039. doi: 10.1074/jbc.M802274200. [DOI] [PMC free article] [PubMed] [Google Scholar]
- 8.Honaker RW, Leistikow RL, Bartek IL, Voskuil MI. Unique roles of DosT and DosS in DosR regulon induction and Mycobacterium tuberculosis dormancy. Infect Immun. 2015;77:3258–3263. doi: 10.1128/IAI.01449-08. [DOI] [PMC free article] [PubMed] [Google Scholar]
- 9.Roberts DM, Liao RP, Wisedchaisri G, Hol WGJ, Sherman DR. Two sensor kinases contribute to the hypoxic response of Mycobacterium tuberculosis. J Biol Chem. 2004;279:23082–23087. doi: 10.1074/jbc.M401230200. [DOI] [PMC free article] [PubMed] [Google Scholar]
- 10.Sardiwal S, Kendall SL, Movahedzadeh F, Rison SC, Stoker NG, Djordjevic S. A GAF Domain in the hypoxia/NO-inducible Mycobacterium tuberculosis DosS protein binds haem. J Mol Biol. 2005;353:929–936. doi: 10.1016/j.jmb.2005.09.011. [DOI] [PubMed] [Google Scholar]
- 11.Ioanoviciu A, Yukl ET, Moënne-Loccoz P, Ortiz de Montellano PR. DevS, a heme-containing two-component oxygen sensor of Mycobacterium tuberculosis. Biochemistry. 2007;46:4250–4260. doi: 10.1021/bi602422p. [DOI] [PMC free article] [PubMed] [Google Scholar]
- 12.Kumar A, Toledo JC, Patel RP, Lancaster JR, Steyn AJC. Mycobacterium tuberculosis DosS is a redox sensor and DosT is a hypoxia sensor. Proc Natl Acad Sci USA. 2007;104:11568–11573. doi: 10.1073/pnas.0705054104. [DOI] [PMC free article] [PubMed] [Google Scholar]
- 13.Ioanoviciu A, Meharenna YT, Poulos TL, Ortiz de Montellano PR. DevS oxy complex stability identifies this heme protein as a gas sensor in Mycobacterium tuberculosis. Biochemistry. 2009;48:5839–5848. doi: 10.1021/bi802309y. [DOI] [PMC free article] [PubMed] [Google Scholar]
- 14.Podust LM, Ioanoviciu A, Ortiz de Montellano PR. 2.3 Å X-ray structure of the heme-bound GAF domain of sensory histidine kinase DosT of Mycobacterium tuberculosis. Biochemistry. 2008;47:12523–12531. doi: 10.1021/bi8012356. [DOI] [PMC free article] [PubMed] [Google Scholar]
- 15.Cho HY, Cho HJ, Kim YM, Oh JI, Kang BS. Structural insight into the heme-based redox sensing by DosS from Mycobacterium tuberculosis. J Biol Chem. 2009;284:13057–13067. doi: 10.1074/jbc.M808905200. [DOI] [PMC free article] [PubMed] [Google Scholar]
- 16.Sheffield P, Garrard S, Derewenda Z. Overcoming expression and purification problems of RhoGDI using a family of ‘parallel’ expression vectors. Protein Express Purific. 1999;15:34–39. doi: 10.1006/prep.1998.1003. [DOI] [PubMed] [Google Scholar]
- 17.Kabsch W. XDS. Acta Crystallogr D Biol Crystallogr. 2010;66:125–132. doi: 10.1107/S0907444909047337. [DOI] [PMC free article] [PubMed] [Google Scholar]
- 18.Winn MD, Ballard CC, Cowtan KD, Dodson EJ, Emsley P, Evans PR, Keegan RM, Krissinel EB, Leslie AG, McCoy A, McNicholas SJ, Murshudov GN, Pannu NS, Potterton EA, Powell HR, Read RJ, Vagin A, Wilson KS. Overview of the CCP4 suite and current developments. Acta Crystallogr D Biol Crystallogr. 2011;67:235–242. doi: 10.1107/S0907444910045749. [DOI] [PMC free article] [PubMed] [Google Scholar]
- 19.McCoy AJ, Grosse-Kunstieve RW, Adams PD, Winn MD, Storoni LC, Read RJ. Phaser crystallographic software. J Appl Crystallogr. 2007;40:658–674. doi: 10.1107/S0021889807021206. [DOI] [PMC free article] [PubMed] [Google Scholar]
- 20.Adams PD, Afonine PV, Bunkóczi G, Chen VB, Davis IW, Echols N, Headd JJ, Hung LW, Kapral GJ, Grosse-Kunstieve RW, McCoy AJ, Moriarty NW, Oeffner R, Read RJ, Richardson DC, Richardson JS, Terwilliger TC, Zwart PH. PHENIX: a comprehensive Python-based system for macromolecular structure solution. Acta Cryst. 2010;D66(2010):213–221. doi: 10.1107/S0907444909052925. [DOI] [PMC free article] [PubMed] [Google Scholar]
- 21.Pettersen EF, Goddard TD, Huang CC, Couch GS, Greenblatt DM, Meng EC, Ferrin TE. UCSF-Chimera - a visualization system for exploratory research and analysis. J Comput Chem. 2004;25:1605–1612. doi: 10.1002/jcc.20084. [DOI] [PubMed] [Google Scholar]
- 22.Scheidt WR, Ellison MK. The synthetic and structural chemistry of heme derivatives with nitric oxide ligands. Acct Chem Res. 1999;32:350–359. [Google Scholar]
- 23.Zemojtel T, Rini M, Heyne K, Dandekar T, Nibbering ETJ, Kozlowski PM. NO-Bound myoglobin: Structural diversity and dynamics of the NO ligand. J Am Chem Soc. 2004;126:1930–1931. doi: 10.1021/ja039086x. [DOI] [PubMed] [Google Scholar]
- 24.Kurokawa H, Lee DS, Watanabe M, Sagami I, Mikami B, Raman CS, Shimizu T. A redox-controlled molecular switch revealed by the crystal structure of a bacterial heme PAS sensor. J Biol Chem. 2004;279:202186–20193. doi: 10.1074/jbc.M314199200. [DOI] [PubMed] [Google Scholar]
- 25.Fedorov R, Ghosh DK, Schlichting I. Crystal structures of cyanide complexes of P450cam and the oxygenase domain of inducible nitric oxide synthase-structural models of the short-lived oxygen complexes. Arch Biochem Biophys. 2003;409:25–31. doi: 10.1016/s0003-9861(02)00555-6. [DOI] [PubMed] [Google Scholar]
- 26.Schlichting I, Berendzen J, Chu K, Stock AM, Maves SA, Benson DE, Sweet RM, Ringe D, Petsko GA, Sligar SG. The catalytic pathway of cytochrome P450cam at atomic resolution. Science. 2000;287:1615–1622. doi: 10.1126/science.287.5458.1615. [DOI] [PubMed] [Google Scholar]
- 27.Nagano S, Poulos TL. Crystallographic study on the dioxygen complex of wild-type and mutant cytochrome P450cam: Implications for the dioxygen activation mechanism. J Biol Chem. 2005;280:31659–31663. doi: 10.1074/jbc.M505261200. [DOI] [PubMed] [Google Scholar]
- 28.Yukl ET, Ioanoviciu A, Nakano MM, Ortiz de Montellano PR, Moënne-Loccoz PA. A distal tyrosine residue is required for ligand discrimination in DevS from Mycobacterium tuberculosis. Biochemistry. 2008;47:12532–12539. doi: 10.1021/bi801234w. [DOI] [PMC free article] [PubMed] [Google Scholar]
- 29.Basudhar D, Madrona Y, Yukl ET, Sivaramakrishnan S, Nishida CR, Moënne-Loccoz P, Ortiz de Montellano PR. Distal hydrogen-bonding interactions in ligand sensing and signaling by Mycobacterium tuberculosis DosS. J Biol Chem. 2016;291:16100–16111. doi: 10.1074/jbc.M116.724815. [DOI] [PMC free article] [PubMed] [Google Scholar]
- 30.Sousa EHS, Tuckerman JR, Gonzalez G, Gilles-Gonzalez MA. DosT and DevS are oxygen-switched kinases in Mycobacterium tuberculosis. Protein Sci. 2007;16:1708–1719. doi: 10.1110/ps.072897707. [DOI] [PMC free article] [PubMed] [Google Scholar]
- 31.Karplus M, McCammon JA. Dynamics of proteins: elements and function. Annu Rev Biochem. 1983;52:263–300. doi: 10.1146/annurev.bi.52.070183.001403. [DOI] [PubMed] [Google Scholar]
- 32.Voskuil MI, Schnappinger D, Visconti KC, Harrell MI, Dolvanov GM, Sherman DR, Schoolnik GK. Inhibition of respiration by nitric oxide induces a Mycobacterium tuberculosis dormancy program. J Exp Med. 2003;198:705–713. doi: 10.1084/jem.20030205. [DOI] [PMC free article] [PubMed] [Google Scholar]