Abstract
Tree shrews possess an unusual segregation of ocular inputs to sublayers rather than columns in the primary visual cortex (V1). In this study, the lateral geniculate nucleus (LGN), superior colliculus (SC), pulvinar, and V1 were examined for changes in c-FOS, an immediate-early gene, expression after 1 or 24 hours of monocular inactivation with tetrodotoxin (TTX) in tree shrews. Monocular inactivation greatly reduced gene expression in LGN layers related to the blocked eye, while normal high to moderate levels were maintained in the layers that receive inputs from the intact eye. The SC and caudal pulvinar contralateral to the blocked eye had greatly (SC) or moderately (pul.) reduced gene expressions reflective of dependence on the contralateral eye. c-FOS expressions in V1 was greatly reduced contralateral to the blocked eye, with most of the expression that remained in upper layer 4a and lower 4b, and lower layer 6 regions. In contrast, much of V1 contralateral to the active eye showed normal levels of c-FOS expression, including the inner parts of sub-layers 4a and 4b, layers 2 and 3, and 6. In some cases, upper layer 4a and lower 4b showed a reduction of gene expression. Layers 5 and sub-layer 3c had normally low levels of gene expression. The results revealed the functional dominance of the contralateral eye in activating the SC, pulvinar, and V1, and the results from V1 suggest that the sublaminar organization of layer 4 is more complex than previously realized.
Keywords: ZIF268, tetrodotoxin, ocular dominance, in situ hybridization, Tupaia, striate cortex
Graphical Abstract Text
Tree shrews have unique organization of the visual system compared to other species. The expression of c-FOS, an immediate-early gene, reveals laminar arrangement of ocular dominance of tree shrews, which is mostly consistent with previous studies but also suggested more complex sublaminae in the primary visual cortex.
Introduction
In the present study, we used the expression patterns of immediate-early genes (IEGs), c-FOS and ZIF268, to determine which parts of thalamus, midbrain, and cortical visual structures are more activated after the inputs from one eye are blocked with tetrodotoxin (TTX) in tree shrews. While this procedure reveals features of ocular dominance in the visual system that are apparent from anatomical studies of retinal projections, the functionally activity-dependent gene expression additionally reveals aspects of monocular and binocular patterns that are not evident in such studies of anatomical connections, or the anatomical consequences of long term monocular deprivation (Adams and Horton, 2003; Kaas et al., 1976). In acute phase of deprivation, major changes in gene expression can occur in as little as half an hour of monocular inactivation. In such short recovery times, the ability of the visual system to compensate for the sensory loss is limited, and more of the normal organization of the visual system is revealed, such as layer 4 column “border strips” and expression of ocular dominance columns (ODC) into other cortical layers (Takahata et al., 2009; Takahata et al., 2014). As another example, gene expression patterns in the primary visual cortex (V1) of marmosets and owl monkeys provided clear evidence for functional ocular dominance columns (ODCs) that were largely cryptic to other methods of revealing them (Nakagami et al., 2013; Takahata et al., 2014). Most recently, IEG expression patterns after TTX eye injections revealed the existence of segregated contralateral and ipsilateral eye domains in the binocular territory of V1 of rats (Laing et al., 2015). While these examples are from V1, the potential of IEG expression patterns to reveal important aspects of functional organization in other visual structures clearly exists.
We chose to investigate IEG expression in the visual system of tree shrews for two main reasons. First, tree shrews are closely related to primates as members of the Euarchontoglires (Murphy et al., 2001). As such, tree shrews share the trait of having orientation selective columns in V1 (Bosking et al., 1997), and it is important to determine which traits are shared and which are not. Second, the visual system of tree shrews is already known to have a number of features that could be further studied with IEG expression after monocular inactivation (Figure 1). The lateral geniculate nucleus (LGN) of tree shrews has an unusual arrangement of six architectonically distinct layers, numbered 1-6 from medial to lateral after Glickstein (1967). Layers 2,3,4, and 6 derive inputs from the contralateral eye, while layers 1 and 5 dominantly receive inputs from the ipsilateral eye (Conley et al., 1984). However, layers 3 and 6 receive inputs from a different class of retinal ganglion cells than other geniculate layers, and this difference might affect gene expression. More specifically, layers 3 and 6 are part of a “koniocellular” or “W” ganglion cell pathway which have been described as “sluggish” in their responsiveness to visual stimulation, while the other layers receive mixed tonic “parvocellular” or “X” and phasic “magnocellular” or “Y” pathways in tree shrews (Conway and Schiller, 1983; Kretz et al., 1986; Norton et al., 1985). More uniquely, ON center ganglion cells activate geniculate layers 1 and 2, and OFF center ganglion cells activate layers 4 and 5 (Fitzpatrick et al., 1983). In V1 of tree shrews, layer 4 has upper and lower sub-layers separated by a narrow, cell-poor cleft. The upper sub-layer, 4a receives ON geniculate inputs, while the lower sub-layer, 4b, receives OFF geniculate inputs. Moreover, there is a laminar rather than a columnar segregation of contralateral and ipsilateral eye inputs, with ipsilateral geniculate inputs to the upper half of sub-layer 4a and the lower half of sub-layer 4b, with contralateral eye geniculate inputs distributed more broadly across the two sub-layers (Casagrande and Harting, 1975; Hubel, 1975). The konio/W all relay from the contralateral eye to LGN layers 3 and 6, distribute mainly to V1 layer 3, but also to other layers (Usrey et al., 1992). These different distributions are expected to influence gene expression pattern after TTX injection to one eye. Finally, the superior colliculus (SC) of tree shrews gets mainly inputs from the contralateral eye (Hubel, 1975), and projects most densely to a caudal nucleus of the visual pulvinar (Lyon et al., 2003a), suggesting that contralateral monocular inactivation would reduce gene expression in these structures.
Figure 1.
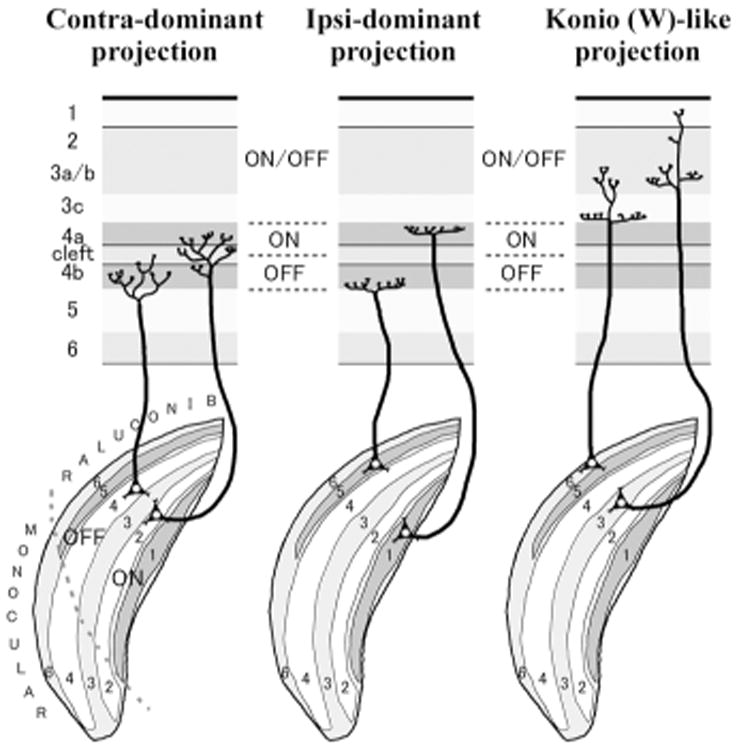
A schematic of geniculo-cortical connections for contra-dominant, ipsi dominant and koniocellular/W-like projections in tree shrews based on previous studies (Conley et al., 1984; Fitzpatrick and Raczkowski, 1990; Harting et al., 1973). The third channel, koniocellular/W-like projection appears contra-dominant in this species. LGN layers 1 and 2, and V1 layer 4a are known to be dominant to ON-center neurons, while LGN layers 4 and 5, and V1 layer 4b are known to be dominant to OFF-center neurons. LGN layers 3 and 6, and V1 layers 2/3 are reportedly active for both ON- and OFF-visual stimulus. Projection patterns in the monocular zones have not been fully studied.
Materials and methods
In the present study, five adult tree shrews (Tupaia belangeri) were deprived of vision in one eye with a treatment of TTX for a period of 1 or 24 hours so that their brains could be studied for changes in activity-dependent expression of c-FOS and ZIF268. The brains of three additional tree shrews were processed for testing normal architecture and gene expression. The animal protocol for this study was approved by the Animal Care and Use Committee at Vanderbilt University. The research was conducted in accordance with the animal care guidelines of the National Institutes of Health, USA. Procedures followed those used previously in owl monkeys (Takahata et al., 2014).
Monocular inactivation
Five adult tree shrews (120-160 g) of either sex were briefly anesthetized with 10-30 mg/kg of ketamine (i.m.) followed by 2% isoflurane. While anesthetized to a surgical level, 3-4 μl (1 mM) of TTX was slowly injected into the vitreous cavity of the left eye with a fine tipped glass pipette attached to a Hamilton syringe. Dilation of pupil was confirmed each case. The tree shrews were then allowed to recover from anesthesia, and then move freely about their home cage with normal daytime lighting for 1 or 24 hours. After that time, each tree shrew was anesthetized with ketamine again, followed by a lethal injection of pentobarbital (50-80 mg/kg, i.p.).
Tissue preparation
Animals were intracardially perfused with phosphate-buffered saline (PBS) under deep anesthesia of pentobarbital, followed by 4% paraformaldehyde (PFA)/0.1 M phosphate buffer (PB) for 10-20 min. The perfused brains were removed from the skull and cryoprotected in 30% sucrose/0.1 M PB at 4°C. In some cases, cortex was cut out and manually flattened for further processing. After 1-3 days, the brain tissues were frozen on the stage of a sliding microtome, and cut into 40 μm sections in the coronal plane of block tissue, or tangent plane to the cortical surface of the flattened cortex. The sections were maintained in a cryoprotectant solution [30% glycerol/30% ethylene glycol/40% 0.1 M phosphate-buffered saline (PBS)] at -20°C.
Preparation of in situ hybridization (ISH) probes
For colorimetric in situ hybridization (ISH), tree shrew-specific probes were prepared for c-FOS and ZIF268. The DNA sequences were cloned by a conventional TA cloning procedure with cDNA from tree shrew liver. The primer sequences for this cloning were: tgagccctttgatgacttcc (forward) and actccatgcgttttgctaca (reverse), targeting 970-1537 of XM_001098940 (human c-FOS) and cccaggacaattgaaatttgct (forward) and aaggcaccaagacgtgaaac (reverse), targeting 1878-2678 of NM_001964 (human ZIF268), respectively. The probe for RORβ is the same one that was used previously for a rat study, which has the sequence of rat RORβ (Laing et al., 2015). The digoxigenin (DIG)-labeled antisense and sense riboprobes were generated from the plasmids using a DIG dUTP labeling kit (Roche Diagnostics, Indianapolis, IN). The sense probes detected no signals stronger than background.
Histochemical Procedures
ISH of brain tissue was carried out as described previously (Takahata et al., 2014). Briefly, free-floating brain sections were soaked in 4% PFA/0.1 M PB (pH 7.4) overnight at 4°C and treated with 10 μg/ml proteinase K for 30 min at 37°C. After acetylation, the sections were incubated in the hybridization buffer [5 × standard saline citrate (SSC: 150mM NaCl, 15 mM Na citrate, pH 7.0), 50% formamide, 2% blocking reagent (Roche Diagnostics), 0.1% N-lauroylsarcosine (NLS), 0.1% sodium dodecyl sulphate (SDS), 20 mM maleic acid buffer; pH 7.5] containing 1.0 μg/ml DIG-labeled riboprobe at 60°C overnight. Hybridized sections were washed by successive immersion in wash buffer (2× SSC, 50% formamide, 0.1% NLS; 60°C, 20 min, twice). RNase A buffer [10mM Tris-HCl, 10 mM ethylenediamine-N,N,N′,N′-tetraacetic acid (EDTA), 500 mM NaCl; pH 8.0] containing 20 μg/ml RNase A (37°C, 30 min), 2 × SSC/0.1% NLS (37°C, 20 min) and 0.2 × SSC/0.1% NLS (37°C, 15 min). Hybridization signals were visualized by alkaline phosphatase (AP) immunohistochemical staining using a DIG detection kit (Roche Diagnostics). Sections were mounted onto glass slides, dehydrated through a series of increasing ethanol concentrations followed by xylene, and coverslipped with Permount.
For architectonically identifying brain structures, alternate series of brain sections were processed for cytochrome oxidase (CO) (Wong-Riley, 1979) or stained for Nissl substance. These sections were compared to the tree shrew sections that had been prepared for previous studies (Balaram et al., 2014; Wong and Kaas, 2009).
Brain sections were studied under an upright bright field microscope (Nikon Eclipse E800M, Nikon, Tokyo, Japan), and appropriate sections were photographed for illustration. Images were captured with a digital camera (Nikon Digital DXM1200F, Nikon) using Image software, and adjusted for brightness and contrast with Photoshop CS3 (Adobe Systems, San Jose, CA). The images were not altered in any other way. No quantitative analysis was performed.
According to a stereotaxic brain atlas of the tree shrew edited by J Tigges and TR Shantha, (1969. The Williams and Wilkins Company Baltimore MD USA), standard anterior-posterior (AP) coordinates for each nucleus are as follows: The SC runs between P 2.5 to A 2.0; The LGN runs between A2.5 to A3.5; The pulvinar runs between P1.5 to A 3.5. The approximate positions of each section are indicated in the figures and figure legends, although the tissues were not cut in the exact same stereotaxic plane as the atlas.
Results
We determined the effects of blocking the visual activity of one eye with TTX in tree shrews on the activity-dependent expression of c-FOS and ZIF268, in the LGN, SC, visual pulvinar, and V1. Reductions in gene expression were expected in the parts of those structures that were dominated by activity relayed from the blocked eye. Results were compared to the gene expression pattern for RORβ, which is preferentially expressed in layer 4 of V1 of rodents and primates (Hirokawa et al., 2008), CO activity patterns that are supposedly high in parts of structures with high levels of neuronal activity (Wong-Riley and Norton, 1988), and cytoarchitecture revealed by a Nissl staining. TTX monocular inactivation did not reveal any apparent differences between 1 hour and 24 hours in changes of c-FOS expression in these structures. Thus, the major effects of blocking the activity in one eye by TTX are illustrated in histological brain sections from brain structure after either 1 hour or 24 hours of deprivations without unnecessary duplication. In addition, we only show the results of c-FOS in this paper because very similar results were revealed by the reduction in the expression of c-FOS and ZIF268 in V1, while ZIF268 mRNA signals were hardly apparent in the subcortical structures.
Normal cytoarchitecture and expression patterns of c-FOS
In Nissl preparations, six narrow layers of neurons can be identified in the LGN (Fig. 2A). The full extents of the layers from central vision dorsally to peripheral vision ventrally are best seen in coronal sections. In both CO preparations and ISH for c-FOS, LGN layers 1, 2, 4 and 5 were more densely stained than layers 3 and 6, likely reflecting higher levels of activity in those layers. (Figs. 2B, C, D). Tree shrews have a relatively large SC with laminated cytoarchitecture (Baldwin et al., 2012) (Figs 2E, F). Moderate levels of c-FOS mRNA signals were observed throughout the SC (Fig. 2G). The pulvinar is a complex structure located right medial to the LGN that has two nuclei with inputs from the SC as well as from the temporal cortex (the dorsal nucleus, Pd) (Fig. 2A) or V1 and V2 (the central nucleus, Pc) (Fig. 2E) (Lyon et al., 2003a; b). The expression level of c-FOS was even lower than the SC, but mRNA signals were sparsely observed throughout the pulvinar complex.
Figure 2.
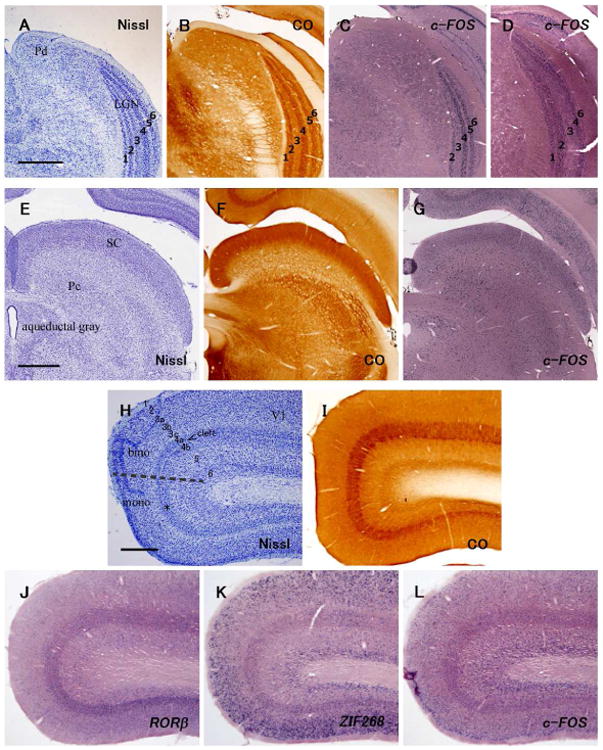
Cytoarchitecture (Nissl, CO histochemistry and ISH for RORβ, as indicated in the figure) and expression of IEGs in the visual domains of normal adult tree shrews. A-D: The six-layer pattern of the LGN and the dorsal part of pulvinar nucleus (Pd). The AP level of A-C is near A 2.5, and that of D is near A 3.0. Scale bar = 1 mm. E-G: SC and central pulvinar nucleus (Pc). The AP level of E is near A 0.5, and that of F and G is near A 1.0. Scale bar = 1 mm. H-L: Laminated structure of V1. A broken line in H indicates boundary between dorsal binocular (bino) and ventral monocular (mono) zones. RORβ mRNA signals are high in layer 4. Note that cell-sparse cleft between layers 4a and 4b is clear in the binocular zone, but not in the monocular zone (*).
Scale bar = 500 μm.
V1 of tree shrews has a very distinctive laminar and sublaminar pattern in Nissl and CO histochemistry brain sections (Figs. 2H, I). In Nissl stained coronal sections, V1 was easily identified by the dense packing of neurons in layer 4, which drops off sharply in adjoining visual areas, V2, over much of the V1 border, and area prostriata over the small portion of the ventral border of V1 (Wong and Kaas, 2009). Layer 4 has an upper sublayer 4a that is separated from the lower sublayer 4b by a narrow cell-poor cleft that is apparent in the dorsal, binocular portion of V1, but not in the monocular part of V1 that extends from the medial wall of the cerebral hemisphere dorsal to SC where layer 4 and cortex becomes thinner (Kaas et al., 1972). Layer 3 has three clear sublayers with the middle sublayer 3b having more densely packed neurons than sublayers 3a and 3c. Layer 4 is most densely stained in both CO preparations and ISH for RORβ (Figs. 2I, J). The mRNA signals of ZIF268 were abundantly observed in layers 2-3b, 4a, 4b, and 6 with moderate levels in the remaining layers except layer 1 (Fig. 2K). The expression level of c-FOS mRNA was moderate throughout layers in V1 (Fig. 2L).
c-FOS expression changes in subcortex following monocular inactivation
In the LGN ipsilateral to the blocked eye and contralateral to the functioning eye, neurons in LGN layers 1 and 5 showed lower levels of c-FOS mRNA signals than remaining layers related to the intact eye (Figs. 3A, C, E, I). The preserved levels of c-FOS expression, reflecting the cell bodies of LGN neurons, extended the full length of the nucleus from central vision to the peripheral monocular zone, as inputs from the eye contralateral extend. c-FOS signals appeared more intense in layers 2 and 4 than in layers 3 and 6, as normal tree shrews. On the other hand, only LGN layers 1 and 5 had high levels of c-FOS signals when they were sub-served by the ipsilateral active eye, and no difference in gene expression was apparent between these two layers (Figs. 3B, D, F, J). In the pulvinar contralateral to the functioning eye, moderate levels of c-FOS signals were observed as in normal tree shrews (Figs. 3M, Q). Although they were not abolished, there were less c-FOS signals in the pulvinar contralateral to the inactivated eye than contralateral to the functioning eye, both dorsal and central nuclei (Figs. 3N, R). No particular domain of higher expression was obvious. The SC represents the complete retina of the contralateral eye, including the temporal segment that projects ipsilaterally to the LGN (Kaas et al., 1974), and neurons throughout the SC are activated by the contralateral eye without any obvious activation from the ipsilateral eye (Lane et al., 1971). In the SC contralateral to the functioning eye, similar pattern of strong c-FOS signals as normal tree shrews was observed (Fig. 3Q). Throughout the SC, c-FOS signals were much more sparse in the superficial layers contralateral to the blocked eye (Figs. 3R).
Figure 3.
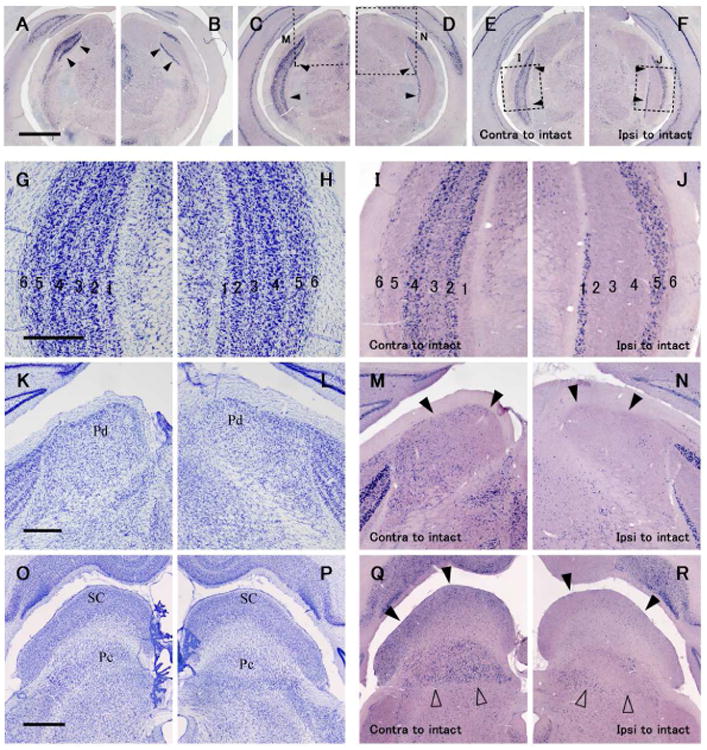
ISH for c-FOS in the LGN (A-F, I and J), dorsal pulvinar (M, N), central pulvinar and SC (Q, R) in a tree shrew case ID13-54 that had a monocular inactivation treatment for 1.5 hours by TTX eye injection. A and B are anterior, C and D are intermediate, and E and F are posterior LGN. A, C, E, I, M and Q are contralateral, and B, D, F, J, N and R are ipsilateral to the intact active eye. G, H, K, I, O and P are adjacent sections stained for Nissl substance for cytoarchitecture. Open squares in C-F show places that are magnified in I, J, M and N as indicated. Black arrowheads in A-F, M and N, and Q and R indicate the LGN, dorsal pulvinar (Pd), and SC, respectively. Open arrowheads in Q and R indicate the central pulvinar (Pc). The AP levels are near A 3.0 for A and B, near A 2.5 for C and D, near A 2.0 for E and F, near A 3.0 for K-N, and near A 1.5 for O-R. Scale bars in A, G, K and O = 1 mm, 500 μm, 500 μm and 1 mm, respectively.
c-FOS expression change in V1 following monocular inactivation
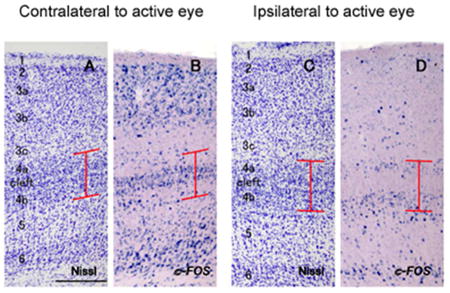
In case ID 13-54, laminar pattern of c-FOS expression was conspicuous after monocular inactivation (Fig. 4). Interestingly, ISH signals were abundantly observed in the cleft and small zone around the cleft, as well as layers 2, 3a, 3b, and 6, but they were sparse in upper layer 4a and lower layer 4b in binocular portion of the contralateral V1 to the intact eye (Figs. 4, 5B). Additionally, some signals were observed along the upper edge of layer 4a and lower edge of layer 4b. In binocular portion of the ipsilateral V1, c-FOS signals were observed in layers 4a and 4b, as well as layer 6, but not in the cleft (Figs. 4 and 5D). No columnar pattern of c-FOS signals was obvious in any part of V1. In the monocular portion of V1 contralateral to the active eye, c-FOS signals were intense in layers 2, 3a, 3b, 4a, 4b and 6 as normal tree shrew V1 (Figs. 4, 5F). In monocular portion of the V1 contralateral to the blocked eye, c-FOS signals were very sparse in layers 2-4, but some signals were observed in layers 5 and 6 (Fig. 4, 5H).
Figure 4.
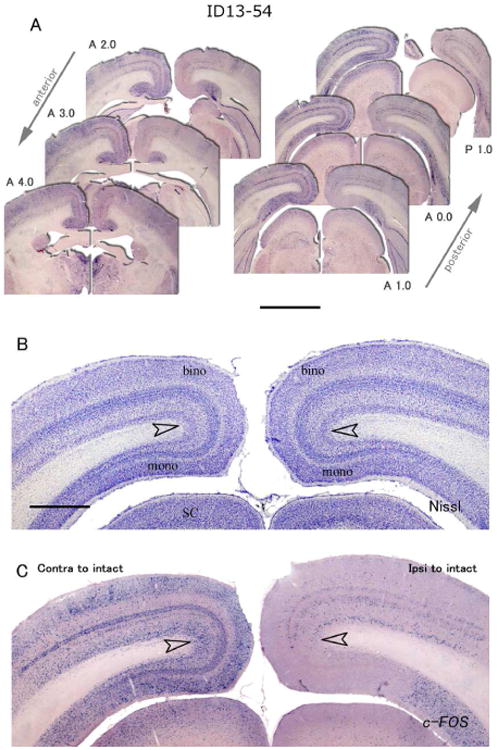
ISH for c-FOS in V1 of a tree shrew case ID13-54 that had a monocular inactivation treatment for 1.5 hours. A: Six serial sections from anterior to posterior. Left is contralateral, right is ipsilateral cortex to the intact active eye. The AP levels are indicated beside each panel. Scale bar = 3 mm. B: A section adjacent to C stained for Nissl substance. C: ISH for c-FOS. Open arrowheads indicate the boundary between binocular and monocular zones. Scale bar = 1 mm.
Figure 5.
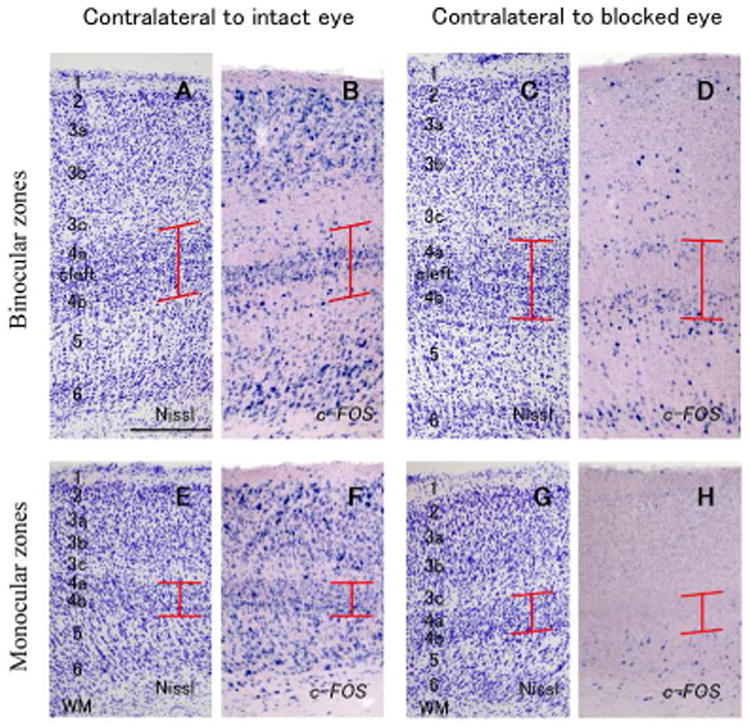
Higher magnifications of coronal sections of V1 (ID13-54). A-1 D are in binocular zones (dorsal V1) and E-H are in monocular zones (ventral V1). A, B, E and F are contralateral to the intact active eye, and C, D, G and H are contralateral to the blocked eye. A, C, E and G are adjacent sections stained for Nissl substance, and B, D, F and H are stained for c-FOS mRNA. Red lines indicate the extent of layer 4. Scale bar = 250 μm.
Some differences across cases were obscured in c-FOS expression. In case ID13-47, c-FOS mRNA signals in the ventral monocular portion of V1 contralateral to the responding eye were abundantly observed in layers 2, 3a, 3b, 4 and 6 as in normal tree shrews. In the dorsal binocular portion of V1 contralateral to the responding eye, c-FOS signals were observed in layers 2, 3a, 3b and 6, but c-FOS signals were much less intense in layers 3c, 4a, 4b and 5. Only in posterior V1, higher c-FOS signals were observed in layer 4 as well (Fig. 6A: posterior sections). In the contralateral hemisphere to the blocked eye, c-FOS signals were very scarce overall, but a few signals were observed in layers 4a and 4b in the binocular zone of posterior V1 (Fig. 6A: posterior sections). The posterior portion of dorsal V1 represents central vision of the lower upper visual field and the lower field is represented more rostrally (Kaas et al., 1972). Possibly, central vision was more activated in the unblocked ipsilateral eye in this tree shrew.
Figure 6.
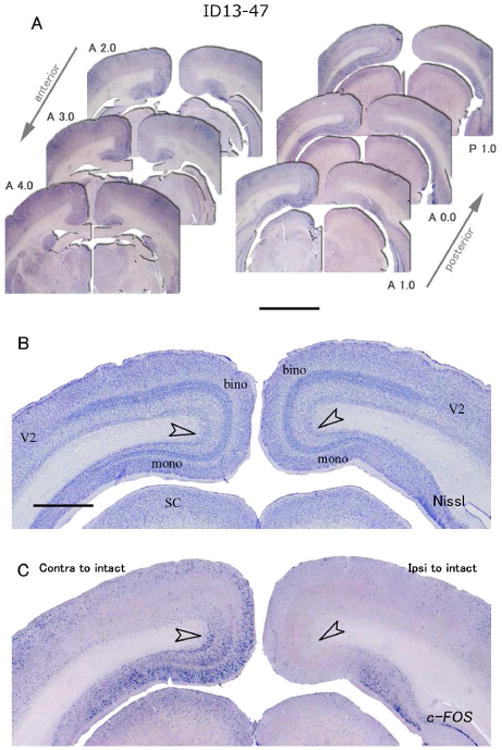
ISH for c-FOS in V1 of a tree shrew case ID13-47 that had a monocular inactivation treatment for 24 hours. A: Six serial sections from anterior to posterior. Left is contralateral, right is ipsilateral cortex to the intact active eye. The AP levels are indicated beside each panel. Scale bar = 3 mm. B: A section adjacent to C stained for Nissl substance. C: ISH for c-FOS. Open arrowheads indicate the boundary between binocular and monocular zones. Scale bar = 1 mm.
To address whether there is any vertical columnar arrangement of ocular dominance domains in tree shrews, as seen in primates and carnivores, we examined c-FOS expression in tangential sections of flattened visual cortex in case ID13-49. In these sections, no stripe pattern reflecting ODCs was observed in either left or right V1 (Figs. 7, 8, respectively). c-FOS signals were somewhat patchy in the upper layers (Figs. 7A-C), but this patchy pattern was not specific to the binocular part of the visual cortex or animals that were subjected to monocular inactivation. Thus, this patchy variation in c-FOS expression is not the result of monocular inactivation. There were almost no c-FOS signals in the V1 contralateral to the blocked eye (Fig. 8). On the edge of the flattened V1, the tissue was cut perpendicularly to the pial surface, and therefore all the six layers could be observed (Figs. 7I, J). Compared to the adjacent section stained for CO activity, we realized that the laminar pattern of c-FOS expression was basically similar to that of case ID13-54: In V1 contralateral to the active eye, signals were abundant in layers 2, 3a, 3b, 6, and around the cleft, but not in layers 4a or 4b. Overall, two cases exhibited a similar pattern as ID13-54, and two cases were similar to ID13-47 among tree shrews we examined. We had another case of monocular inactivation with flattened cortex, and it only showed weak c-FOS signals throughout V1, therefore it was difficult to examine laminar expression patterns.
Figure 7.
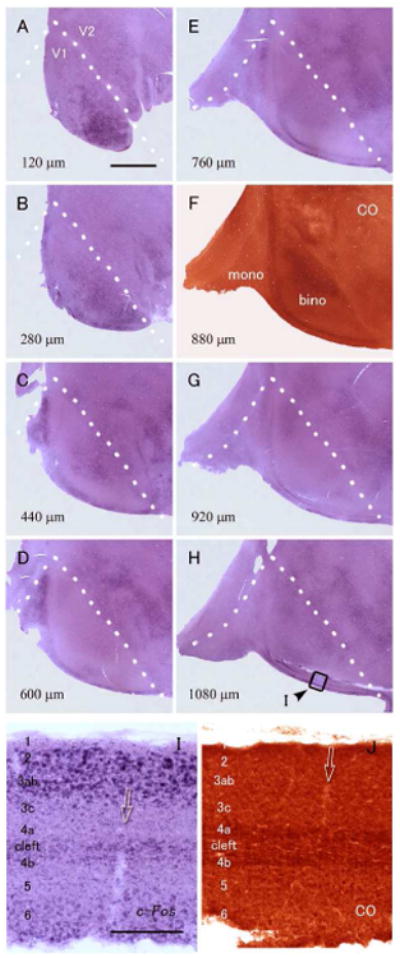
ISH for c-FOS in visual cortex of a tree shrew (ID13-49) that was subjected to 24 hour-monocular inactivation. The sections are contralateral (left) to the intact active eye. A-H: ISH for c-FOS (A-E, G and H) and CO staining (F) in tangential sections of the flattened visual cortex. Numbers on the bottom left shows depth from the pial surface. White broken lines indicate the V1/V2 border that was determined by the dense staining of CO activity in F. The monocular zone (mono) is left and the binocular zone (bino) is right in the pictures. Staining may appear irregular due to incomplete flattening resulting in sections containing the presence of parts of different layers in each flattened section. Although ISH staining pattern seems patchy in A-C, similar staining is observed in other areas, and even in normal tree shrews, and thus, they are not ocular dominance domains. Overall, no ODC-like pattern was observed. Scale bar = 3 mm. I, J: Higher magnifications of squared area in H (I), and the adjacent section stained for CO activity (J). At the edges of the flattened sections, the cortex was cut vertically, not tangentially, and therefore all layers can be seen in one section. The intense IEG band was thinner than the CO band in layer 4, indicating that upper layer 4a and lower layer 4b do not receive strong input from the contralateral eye, as in ID13-54. Arrows indicate the identical blood vessel. Scale bar = 300 μm.
Figure 8.
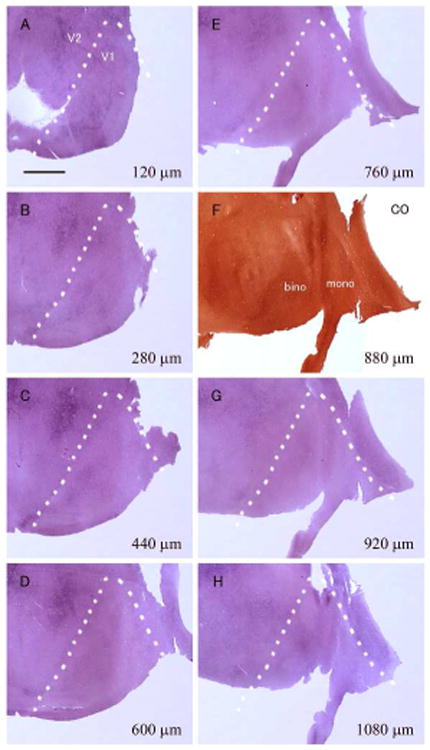
ISH for c-FOS in visual cortex of a tree shrew (ID13-49) that was subjected to 24 hour-monocular inactivation. The sections are ipsilateral (right) to the intact active eye, and from the other hemisphere of Figure 6. A-H: ISH for c-FOS (A-E, G and H) and CO staining (F) in tangential sections of the flattened visual cortex. Numbers on the bottom left shows depth from the pial surface. White broken lines indicate the V1/V2 border that was determined by the dense staining of CO activity in F. Monocular zone (mono) locates right and binocular zone (bino) locates left in the pictures. Staining may appear irregular due to incomplete flattening and containing different layers in each flattened sections, but no columnar staining pattern was observed overall. Scale bar = 3 mm.
In summary, columnar patterns of c-FOS expression related to monocular eye inactivation were not observed in any layers of V1. In ipsilateral to the intact eye, c-FOS expression was reduced across almost all parts of V1. However, some activation of layers 4a and 4b by the normal ipsilateral eye was apparent. c-FOS signals in layers 2/3 and 6 remained high in most cases. c-FOS signals were very sparse throughout all layers in the monocular part of V1 after blocking the contralateral eye. In contralateral to the intact eye, some reduction of c-FOS signals was observed along upper edge of layer 4a and lower edge of layer 4b. The summary of the results is illustrated in Figure 9.
Figure 9.
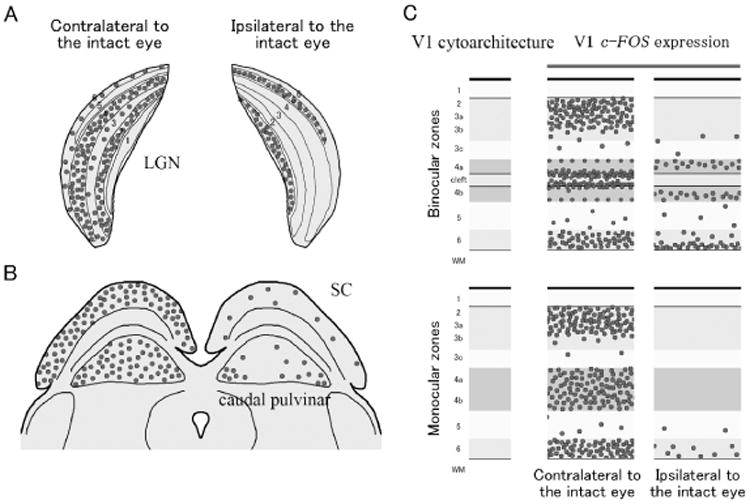
Schematic summaries of the cytoarchitecture and the c-FOS expression after monocular inactivation in tree shrew LGN (A), midbrain (B) and V1 (C). Circles represent neurons that express c-FOS. The cleft between layers 4a and 4b is not apparent in V1 of monocular zones.
Discussion
We studied the normal expression pattern of c-FOS and its changes after monocular inactivation to reveal functional ocular dominance domains in tree shrew visual structures, the LGN, SC, pulvinar, and V1 (Fig. 9). As the expression of c-FOS reflects the functional activation of visual structures, a functional comparison of visual systems to compliment previous anatomical studies of tree shrews was possible. We expected that c-FOS expression would reveal ODC-like domains and/or further ocular dominance compartments in tree shrews. In V1 of tree shrews, we observed laminar pattern of c-FOS expression, and reconfirmed previous anatomical findings that ocular segregation is laminar, not columnar.
c-FOS expression in the visual system of normal tree shrews and its changes after monocular inactivation
Our control, non-deprived, tree shrews demonstrated that c-FOS and ZIF268 are normally more expressed in some parts of early visual structures than others. We observed lower levels of c-FOS expression in layers 3 and 6 than in the other layers of the LGN, and in layers 5 and sublayer 3c of V1. LGN layers 3 and 6 are known to be innervated by the less active koniocellular- or W cell-like input from the retina, and thus expected to have lower levels of activity overall (Casagrande et al., 2007). In fact, lower levels of CO activity in LGN layers 3 and 6 have also been reported previously (Wong-Riley and Norton, 1988). Layers 3 and 6 are also characterized by a higher expression of the calcium binding protein calbindin D-28K (Diamond et al., 1993), which also marks the koniocellular layers of the LGN in primates (Rodman et al., 2001). No differences were obvious in c-FOS expression levels in LGN layer 2 with ON center cells and LGN layer 4 with OFF center cells (Conway and Schiller, 1983; Kretz et al., 1986). In addition, the level of c-FOS expression in the caudal pulvinar and in the SC were reduced by inactivation of the contralateral eye, but were not altered by an inactivation of the ipsilateral eye, and thus were identical to the expression levels in normal animals. These results are consistent with the previous observations that the SC almost exclusively receives inputs from the contralateral eye (Hubel, 1975), and that a relay from the SC dominates the caudal pulvinar via VGLUT2-positive projections (Balaram et al., 2014). However, neither SC showed obvious changes in c-FOS expression in macaques, owl monkeys or galagos after monocular inactivation in our experiments (data not shown), while the SC of mice did (Takahata et al., 2008). This species' difference suggests that primates depend more on cortical pathways for visual perception, whereas rodents and tree shrews use midbrain pathways more. In V1 of tree shrews, c-FOS protein expression was previously found to be expressed lower in sublayer 3c and layer 5 than other layers after exposure to white light (Poveda and Kretz, 2009), which is consistent with our data. In CO preparations, these same regions express less CO (Wong-Riley and Norton, 1988). Thus, less intense expression of c-FOS in layers 3 and 6 of the LGN and sub layer 3c and 5 of V1 in our non-deprived control case, and when these structures were contralateral to the functioning eye, reflect normally low levels of activity, and not only the effects of inactivating the ipsilateral eye. Layer 3c projects to extrastriate temporal cortex in tree shrews (Lyon et al., 2003b), and to the medial temporal area, MT, in primates by transient M (or Y) cell activity. Layer 5 projections are subcortical to the pulvinar and SC (Baldwin et al., 2012). Presumably, layer 5 and sublayer 3c normally have lower levels of neuronal activity in primates, as suggested by low CO expression (Condo and Casagrande, 1990) and levels of c-FOS expression (Takahata et al., 2009).
“Capricious” expression of ocular dominance columns
Adams and Horton (2003) reported that there were extreme cross-individual variation of ODC expressions in squirrel monkeys. Some individuals have stripe-like ODCs similar to macaques, some others have much finer ODCs, and some squirrel monkeys completely lack of ODCs. Intriguingly, they reported that some squirrel monkeys only possess ODCs in the peripheral visual field of V1 but not in the central visual field of V1. The apparent lack of ODCs in some New World monkeys may occasionally arise from limited capacity of CO staining for revealing ODCs, although this would need to be confirmed with transneuronal tracing and/or IEG expression. It remains true that existence of ODCs is a common feature of primate species (DeBruyn and Casagrande, 1981; Florence et al., 1986; Takahata et al., 2014). Nevertheless, there seems to be inter-individual differences in ODC expression within the same species.
Whereas ID13-47 (24 hour-monocular inactivation; Figure 3) appears overall ceasing in the contralateral V1 to the blocked eye, ID13-54 (1.5 hour-monocular inactivation; Figures 4, 5) clearly exhibited laminar pattern in c-FOS mRNA expression. One may think that it is time course difference, since we have previously reported interesting time course changes in IEG expression after monocular inactivation in macaques (Takahata et al., 2009). However, this is unlikely because another case, ID13-49, showed laminar pattern even though it had 24 hour-inactivation, and ID14-02 showed pattern similar to ID13-47 even though it had 1 hour-inactivation. Although 3 cases of this study showed apparent overall inactivation of the contralateral V1, some laminar pattern was weakly observed, and no columnar pattern was seen in all the cases, therefore, we concluded that tree shrews have laminar segregation of ocular dominance input. It was also possible that the apparent difference between ID13-47 and ID13-54 was due to artifact, because fixation of the tissue or staining stringency may not be the same between them. Thus, it is not clear how much cross-individual difference or what kind of time course change exists in this species.
In tangential sections of the visual cortex, some patchiness of c-FOS mRNA expression was observed (Figs. 7, 8). Nonetheless, we do not consider that this faint patchiness represents columnar ocular dominance segregation. When IEG mRNA expression represented ocular dominance in rats and primates, peripheral monocular zone was overall inactivation in the V1 contralateral, and was overall activation in the V1 ipsilateral to the blocked eye (Laing et al., 2015; Takahata et al., 2014). This patchiness in tree shrew V1, however, continued into peripheral monocular zones, and even observed in other cortical areas such as somatosensory areas and prefrontal cortex. Thus, we concluded that this patchy expression represents original cytoarchitecture or other functional unit, and is irrelevant to the monocular inactivation treatment.
Comparison with previous studies of ocular dominance in V1
Previous researchers have investigated connectivity of the early visual system of tree shrews by using a variety of anatomical and physiological techniques including tracer transport methods, CO histochemistry, restricted degeneration methods and electrical recordings (Casagrande and Harting, 1975; Conley et al., 1984; Fitzpatrick and Raczkowski, 1990; Harting et al., 1973; Hubel, 1975; Kretz et al., 1986; Wong-Riley and Norton, 1988). Here, we relate our current results to those of previous reports. First, there was some variation in the gene expression across cases as discussed above. Second, while previous studies suggested that layers 4a and 4b receive overlapping inputs from both eyes and only the layer 4 cleft is exclusively contralateral (Fitzpatrick and Raczkowski, 1990; Hubel, 1975; Kretz et al., 1986), the present c-FOS expression patterns indicated that activity driven by the contralateral eye is very high along the lower edge of layer 4a and upper edge of layer 4b, as well as inside the cleft, and that activation driven by the ipsilateral eye activates the upper part of layer 4a and lower part of layer 4b. Thus, there is a high level of functional segregation in layer 4. In this sense, the model of Conley et al. (1984) is most consistent with our data (Fig. 1). Third, we report a minor activation of c-FOS expression along the upper edge of layer 4a and lower edge of layer 4b related to the contralateral eye, which has not been described previously. Therefore, we provide evidence for further sub-laminae and the segregation of ocular inputs in V1. Fourth, c-FOS expression also showed ocular dominance segregation outside layer 4 (Fig. 9C). Layers 2, 3a and 6 appeared to be mostly activated by contralateral eye, in addition to layer 4, and layers 3b, 3c and 5 appeared to receive weak activation by both eyes. Projections from neurons in sublayers of layer 4 may account for these activation pattern. Briefly, ascending neurons in lower layer 4a and upper layer 4b, which receive inputs from the contralateral eye, project into layers 2 and upper layer 3, and neurons in upper layer 4a and lower layer 4b, which receive inputs from the ipsilateral eye, project into lower layer 3 (Muly and Fitzpatrick, 1992). These connections likely provide the anatomical substructure for the robust activation of layers 2 and 3a by the contralateral eye, and the weaker activation of layers 3b, 3c and 5 by both eyes. Finally, Wong-Riley and Norton (1988) examined CO activity in tree shrew LGN and V1 after two weeks of monocular inactivation to address neuronal activity changes in V1 layers. They reported that monocular deactivation reduced CO activity in contralateral V1, but a reduction was not clear in the ipsilateral V1. As Wong-Riley and Norton (1988) discuss, CO activity may not directly represent action potentials of cortical neurons, but synaptic efficiency in dendrites. In our material, we saw no clear changes in CO expression after 1 or 24 hours of monocular inactivation.
As for CO patterns, c-FOS expression does not necessarily reflect projection patterns from the thalamus. Transcription of c-FOS is upregulated when cytosolic calcium and cAMP level gets higher and CRE-binding protein (CREB) is phosphorylated after postsynaptic NMDA receptors are activated (Walton et al., 1999). Therefore, balance of excitatory and inhibitory local circuit significantly influences c-FOS expression, as well as primary input from the thalamus. Thus, the imbalance of neuronal activity that is induced by monocular inactivation treatment is visualized by our method, and not necessarily anatomical connectivity from the thalamus. In addition, sites of boutons of geniculo-cortical input are not necessarily sites of somas of neurons that receive geniculo-cortical input, as neurons may extend dendrites into other layers from the soma, while ISH only stains somas of neurons. As another possible reason for some levels of mismatching between studies of anatomical projections and c-FOS expression, the spatial and temporal resolutions of the c-FOS method are likely higher than previous tracer and CO methods.
In the previous studies, we have revealed the existence of ODCs in New World owl monkeys and rats (Laing et al., 2015; Takahata et al., 2014) by IEG expression, following the method originally introduced by Chaudhuri, et al. (1995) in Old World monkeys. Nakagami, et al. (2013) and Fonta, et al. (2000) also revealed ODCs by the expression of activity-dependent genes in marmosets. These studies expanded interpretation of ODCs, suggesting the idea that ODCs are rather widespread structures than exclusive to some carnivore and Old World primates. However, tree shrews are obviously exceptional in spite of close relationship to primates, together with the unique arrangement of ON- and OFF-center neurons in LGN and V1 layers. Thus, tree shrews provide another possible design of visual system organization besides well-studied ones in macaques and mice. Further studies of module formation and theoretical models of visual computational circuits may benefit from studies of the LGN and V1 in tree shrews.
Table 1.
Summary table of tree shrews.
| Tree shrew ID | Treatment | OD laminar pattern | V1 sectioning | Images |
|---|---|---|---|---|
| 13-19 | Normal | Not applied | Coronal | Figure 2 |
| 13-54 | TTX, 1.5 hours | Clear | Coronal | Figures 3, 4, 5 |
| 13-47 | TTX, 24 hours | Obscure | Coronal | Figure 6 |
| 13-49 | TTX, 24 hours | Clear | Flatmount | Figures 7, 8 |
| 14-01 | TTX, 24 hours | Obscure | Flatmount | Not shown |
| 14-02 | TTX, 1 hour | Obscure | Flatmount | Not shown |
Acknowledgments
We thank Dr. Troy A. Hackett, Vanderbilt University, for the use of their laboratory facilities. We also thank Laura E. Trice, Mary R. Feurtado and Emily C. Rockoff, Vanderbilt University, for their technical assistance, and Dr. Heywood M. Petry, University of Louisville, for providing tree shrews. This research was supported by Japan Society for Promotion of Science to TT, NIH grant EY002686 to JHK, and Key Construction Program of the National “985” Project, China, to TT.
Footnotes
Conflict of Interest: Authors declare no conflict of interest about this publication.
Roles of Authors: All authors had full access to all the data in the study and take responsibility for the integrity of the data and the accuracy of the data analysis. Study concept and design: TT and JHK. Acquisition of data: TT. Analysis and interpretation of data: TT and JHK. Drafting of the manuscript: TT and JHK. Critical revision of the manuscript for important intellectual content: TT and JHK.
References cited
- Adams DL, Horton JC. Capricious expression of cortical columns in the primate brain. Nat Neurosci. 2003;6(2):113–114. doi: 10.1038/nn1004. [DOI] [PubMed] [Google Scholar]
- Balaram P, Isaamullah M, Petry HM, Bickford ME, Kaas JH. Distributions of vesicular glutamate transporters 1 and 2 in the visual system of tree shrews (Tupaia belangeri) J Comp Neurol. 2014 doi: 10.1002/cne.23727. [DOI] [PMC free article] [PubMed] [Google Scholar]
- Baldwin MK, Wei H, Reed JL, Bickford ME, Petry HM, Kaas JH. Cortical projections to the superior colliculus in tree shrews (Tupaia belangeri) J Comp Neurol. 2012;521(7):1614–1632. doi: 10.1002/cne.23249. [DOI] [PMC free article] [PubMed] [Google Scholar]
- Bosking WH, Zhang Y, Schofield B, Fitzpatrick D. Orientation selectivity and the arrangement of horizontal connections in tree shrew striate cortex. J Neurosci. 1997;17(6):2112–2127. doi: 10.1523/JNEUROSCI.17-06-02112.1997. [DOI] [PMC free article] [PubMed] [Google Scholar]
- Casagrande VA, Harting JK. Transneuronal transport of tritiated fucose and proline in the visual pathways of tree shrew Tupaia glis. Brain Res. 1975;96(2):367–372. doi: 10.1016/0006-8993(75)90749-0. [DOI] [PubMed] [Google Scholar]
- Casagrande VA, Yazar F, Jones KD, Ding Y. The morphology of the koniocellular axon pathway in the macaque monkey. Cereb Cortex. 2007;17(10):2334–2345. doi: 10.1093/cercor/bhl142. [DOI] [PubMed] [Google Scholar]
- Chaudhuri A, Matsubara JA, Cynader MS. Neuronal activity in primate visual cortex assessed by immunostaining for the transcription factor Zif268. Vis Neurosci. 1995;12(1):35–50. doi: 10.1017/s095252380000729x. [DOI] [PubMed] [Google Scholar]
- Condo GJ, Casagrande VA. Organization of cytochrome oxidase staining in the visual cortex of nocturnal primates (Galago crassicaudatus and Galago senegalensis): I. Adult patterns. J Comp Neurol. 1990;293(4):632–645. doi: 10.1002/cne.902930408. [DOI] [PubMed] [Google Scholar]
- Conley M, Fitzpatrick D, Diamond IT. The laminar organization of the lateral geniculate body and the striate cortex in the tree shrew (Tupaia glis) J Neurosci. 1984;4(1):171–197. doi: 10.1523/JNEUROSCI.04-01-00171.1984. [DOI] [PMC free article] [PubMed] [Google Scholar]
- Conway JL, Schiller PH. Laminar organization of tree shrew dorsal lateral geniculate nucleus. J Neurophysiol. 1983;50(6):1330–1342. doi: 10.1152/jn.1983.50.6.1330. [DOI] [PubMed] [Google Scholar]
- DeBruyn EJ, Casagrande VA. Demonstration of ocular dominance columns in a New World primate by means of monocular deprivation. Brain Res. 1981;207(2):453–458. doi: 10.1016/0006-8993(81)90378-4. [DOI] [PubMed] [Google Scholar]
- Diamond IT, Fitzpatrick D, Schmechel D. Calcium binding proteins distinguish large and small cells of the ventral posterior and lateral geniculate nuclei of the prosimian galago and the tree shrew (Tupaia belangeri) Proc Natl Acad Sci U S A. 1993;90(4):1425–1429. doi: 10.1073/pnas.90.4.1425. [DOI] [PMC free article] [PubMed] [Google Scholar]
- Fitzpatrick D, Itoh K, Diamond IT. The laminar organization of the lateral geniculate body and the striate cortex in the squirrel monkey (Saimiri sciureus) J Neurosci. 1983;3(4):673–702. doi: 10.1523/JNEUROSCI.03-04-00673.1983. [DOI] [PMC free article] [PubMed] [Google Scholar]
- Fitzpatrick D, Raczkowski D. Innervation patterns of single physiologically identified geniculocortical axons in the striate cortex of the tree shrew. Proc Natl Acad Sci U S A. 1990;87(1):449–453. doi: 10.1073/pnas.87.1.449. [DOI] [PMC free article] [PubMed] [Google Scholar]
- Florence SL, Conley M, Casagrande VA. Ocular dominance columns and retinal projections in New World spider monkeys (Ateles ater) J Comp Neurol. 1986;243(2):234–248. doi: 10.1002/cne.902430207. [DOI] [PubMed] [Google Scholar]
- Fonta C, Chappert C, Imbert M. Effect of monocular deprivation on NMDAR1 immunostaining in ocular dominance columns of the marmoset Callithrix jacchus. Vis Neurosci. 2000;17(3):345–352. doi: 10.1017/s0952523800173031. [DOI] [PubMed] [Google Scholar]
- Glickstein M. Laminar structure of the dorsal lateral geniculate nucleus in the tree shrew (Tupaia glis) J Comp Neurol. 1967;131(2):93–102. doi: 10.1002/cne.901310203. [DOI] [PubMed] [Google Scholar]
- Harting JK, Diamond IT, Hall WC. Anterograde degeneration study of the cortical projections of the lateral geniculate and pulvinar nuclei in the tree shrew (Tupaia glis) J Comp Neurol. 1973;150(4):393–440. doi: 10.1002/cne.901500403. [DOI] [PubMed] [Google Scholar]
- Hirokawa J, Bosch M, Sakata S, Sakurai Y, Yamamori T. Functional role of the secondary visual cortex in multisensory facilitation in rats. Neuroscience. 2008;153(4):1402–1417. doi: 10.1016/j.neuroscience.2008.01.011. [DOI] [PubMed] [Google Scholar]
- Hubel DH. An autoradiographic study of the retino-cortical projections in the tree shrew (Tupaia glis) Brain Res. 1975;96(1):41–50. doi: 10.1016/0006-8993(75)90568-5. [DOI] [PubMed] [Google Scholar]
- Kaas JH, Hall WC, Killackey H, Diamond IT. Visual cortex of the tree shrew (Tupaia glis): architectonic subdivisions and representations of the visual field. Brain Res. 1972;42(2):491–496. doi: 10.1016/0006-8993(72)90548-3. [DOI] [PubMed] [Google Scholar]
- Kaas JH, Harting JK, Guillery RW. Representation of the complete retina in the contralateral superior colliculus of some mammals. Brain Res. 1974;65(2):343–346. doi: 10.1016/0006-8993(74)90047-x. [DOI] [PubMed] [Google Scholar]
- Kaas JH, Lin CS, Casagrande VA. The relay of ipsilateral and contralateral retinal input from the lateral geniculate nucleus to striate cortex in the owl monkey: a transneuronal transport study. Brain Res. 1976;106(2):371–378. doi: 10.1016/0006-8993(76)91032-5. [DOI] [PubMed] [Google Scholar]
- Kretz R, Rager G, Norton TT. Laminar organization of ON and OFF regions and ocular dominance in the striate cortex of the tree shrew (Tupaia belangeri) J Comp Neurol. 1986;251(1):135–145. doi: 10.1002/cne.902510110. [DOI] [PubMed] [Google Scholar]
- Laing RJ, Turecek J, Takahata T, Olavarria JF. Identification of Eye-Specific Domains and Their Relation to Callosal Connections in Primary Visual Cortex of Long Evans Rats. Cereb Cortex. 2015;25(10):3314–3329. doi: 10.1093/cercor/bhu128. [DOI] [PMC free article] [PubMed] [Google Scholar]
- Lane RH, Allman JM, Kaas JH. Representation of the visual field in the superior colliculus of the grey squirrel (Sciurus carolinensis) and the tree shrew (Tupaia glis) Brain Res. 1971;26(2):277–292. [PubMed] [Google Scholar]
- Lyon DC, Jain N, Kaas JH. The visual pulvinar in tree shrews I. Multiple subdivisions revealed through acetylcholinesterase and Cat-301 chemoarchitecture. J Comp Neurol. 2003a;467(4):593–606. doi: 10.1002/cne.10939. [DOI] [PubMed] [Google Scholar]
- Lyon DC, Jain N, Kaas JH. The visual pulvinar in tree shrews II. Projections of four nuclei to areas of visual cortex. J Comp Neurol. 2003b;467(4):607–627. doi: 10.1002/cne.10940. [DOI] [PubMed] [Google Scholar]
- Muly EC, Fitzpatrick D. The morphological basis for binocular and ON/OFF convergence in tree shrew striate cortex. J Neurosci. 1992;12(4):1319–1334. doi: 10.1523/JNEUROSCI.12-04-01319.1992. [DOI] [PMC free article] [PubMed] [Google Scholar]
- Murphy WJ, Eizirik E, Johnson WE, Zhang YP, Ryder OA, O'Brien SJ. Molecular phylogenetics and the origins of placental mammals. Nature. 2001;409(6820):614–618. doi: 10.1038/35054550. [DOI] [PubMed] [Google Scholar]
- Nakagami Y, Watakabe A, Yamamori T. Monocular inhibition reveals temporal and spatial changes in gene expression in the primary visual cortex of marmoset. Front Neural Circuits. 2013;7:43. doi: 10.3389/fncir.2013.00043. [DOI] [PMC free article] [PubMed] [Google Scholar]
- Norton TT, Rager G, Kretz R. ON and OFF regions in layer IV of striate cortex. Brain Res. 1985;327(1-2):319–323. doi: 10.1016/0006-8993(85)91527-6. [DOI] [PubMed] [Google Scholar]
- Poveda A, Kretz R. c-Fos expression in the visual system of the tree shrew (Tupaia belangeri) J Chem Neuroanat. 2009;37(4):214–228. doi: 10.1016/j.jchemneu.2009.03.006. [DOI] [PubMed] [Google Scholar]
- Rodman HR, Sorenson KM, Shim AJ, Hexter DP. Calbindin immunoreactivity in the geniculo-extrastriate system of the macaque: implications for heterogeneity in the koniocellular pathway and recovery from cortical damage. J Comp Neurol. 2001;431(2):168–181. doi: 10.1002/1096-9861(20010305)431:2<168::aid-cne1063>3.0.co;2-n. [DOI] [PubMed] [Google Scholar]
- Takahata T, Hashikawa T, Higo N, Tochitani S, Yamamori T. Difference in sensory dependence of occ1/Follistatin-related protein expression between macaques and mice. J Chem Neuroanat. 2008;35(1):146–157. doi: 10.1016/j.jchemneu.2007.09.001. [DOI] [PubMed] [Google Scholar]
- Takahata T, Higo N, Kaas JH, Yamamori T. Expression of immediate-early genes reveals functional compartments within ocular dominance columns after brief monocular inactivation. Proc Natl Acad Sci U S A. 2009;106(29):12151–12155. doi: 10.1073/pnas.0905092106. [DOI] [PMC free article] [PubMed] [Google Scholar]
- Takahata T, Miyashita M, Tanaka S, Kaas JH. Identification of ocular dominance domains in New World owl monkeys by immediate-early gene expression. Proc Natl Acad Sci U S A. 2014;111(11):4297–4302. doi: 10.1073/pnas.1401951111. [DOI] [PMC free article] [PubMed] [Google Scholar]
- Usrey WM, Muly EC, Fitzpatrick D. Lateral geniculate projections to the superficial layers of visual cortex in the tree shrew. J Comp Neurol. 1992;319(1):159–171. doi: 10.1002/cne.903190113. [DOI] [PubMed] [Google Scholar]
- Walton M, Henderson C, Mason-Parker S, Lawlor P, Abraham WC, Bilkey D, Dragunow M. Immediate early gene transcription and synaptic modulation. J Neurosci Res. 1999;58(1):96–106. [PubMed] [Google Scholar]
- Wong-Riley MT, Norton TT. Histochemical localization of cytochrome oxidase activity in the visual system of the tree shrew:normal patterns and the effect of retinal impulse blockage. J Comp Neurol. 1988;272(4):562–578. doi: 10.1002/cne.902720409. [DOI] [PubMed] [Google Scholar]
- Wong P, Kaas JH. Architectonic subdivisions of neocortex in the tree shrew (Tupaia belangeri) Anat Rec (Hoboken) 2009;292(7):994–1027. doi: 10.1002/ar.20916. [DOI] [PMC free article] [PubMed] [Google Scholar]


