Abstract
The purpose of this study was to investigate the changes that occur in the lacrimal glands (LGs) in female thrombospondin 1 knockout (TSP1−/−) mice, a mouse model of the autoimmune disease Sjogren’s syndrome. The LGs of 4, 12, and 24 week-old female TSP1−/− and C57BL/6J (wild type, WT) mice were used. qPCR was performed to measure cytokine expression. To study the architecture, LG sections were stained with hematoxylin and eosin. Cell proliferation was measured using bromo-deoxyuridine and immunohistochemistry. Amount of CD47 and stem cell markers was analyzed by western blot analysis and location by immunofluorescence microscopy. Expression of stem cell transcription factors was performed using Mouse Stem Cell Transcription Factors RT2 Profiler PCR Array. Cytokine levels significantly increased in LGs of 24 week-old TSP1−/− mice while morphological changes were detected at 12 weeks. Proliferation was decreased in 12 week-old TSP1−/− mice. Three transcription factors were overexpressed and eleven underexpressed in TSP1−/− compared to WT LGs. The amount of CD47, Musashi1, and Sox2 was decreased while the amount of ABCG2 was increased in 12 week-old TSP1−/− mice. We conclude that TSP1 is necessary for maintaining normal LG homeostasis. Absence of TSP1 alters cytokine levels and stem cell transcription factors, LG cellular architecture, decreases cell proliferation, and alters amount of stem cell markers.
Keywords: Lacrimal gland, Progenitor cells, Myoepithelial cells, Cytokines, Sjogrens syndrome
1. Introduction
Dry eye and associated ocular surface diseases affect more than 40 million Americans. Aqueous deficiency dry eye (ADDE) results from alterations in lacrimal gland (LG) secretion that can lead to ocular surface inflammation causing irritation and pain (Dartt, 2009; Mantelli et al., 2013; Stevenson et al., 2014). Dysfunction of the LG has been documented in a variety of conditions such as aging, the autoimmune disease Sjögren’s syndrome, and post-refractive surgery (Ang et al., 2001; Batista et al., 2012; Contreras-Ruiz et al., 2014; Reksten and Jonsson, 2014; Rocha et al., 2008). However, the mechanisms that cause this disruption of function are not well understood. As there are no cures for ADDE and current topical treatments offer limited relief. Repair or regeneration of the LG potentially with stem cells would alleviate this suffering.
The LG is an exocrine gland whose main function is to produce the aqueous component of the tear film consisting of proteins, water and electrolytes (Dartt, 2009). The LG fluid not only helps to lubricate the eye, but also aids in bringing nutrients and oxygen to the cornea and removing waste products and preventing infection. LGs are comprised of acinar and ductal epithelia, myoepithelial cells, nerves, plasma cells, vascular and stromal cells, which are necessary to produce and secrete tear film components (Batista et al., 2012). Acinar cells, which comprise about 80% of the gland, form acini comprised of pyramidal shaped cells that lead into the duct system. Acinar cells secrete the majority of proteins, water, and electrolytes produced by the gland. The primary fluid from acini is then secreted into the ducts where it is modified by ductal cells before being released onto the surface of the eye. Myoepithelial cells surround the acinar cells on the basal side and because they contain α-smooth muscle actin (αSMA), it is believed that they contract to help expel the secretory products, as in the salivary and mammary glands (Ohtomo et al., 2011). More recently we demonstrated that a population of myoepithelial cells could serve as stem/progenitor cells for the LG (Shatos et al., 2012a).
Many reports have indicated that exocrine glands such as the salivary gland, exocrine pancreas, salivary, and mammary glands have the ability to regenerate (Chuong et al., 2014; Holmberg and Hoffman, 2014; Migliorini et al., 2014) (Arany et al., 2011; Burford-Mason et al., 1993; Nagai et al., 2014). The LG also exhibits repair mechanisms. Zoukhri et al. showed that a single injection of the pro-inflammatory cytokine interleukin (IL)-1 into the mouse LG led to a severe inflammatory response, impaired release of secretory protein, decreased tear output and increased acinar cell death (Zoukhri et al., 2007). Within 3–7 days, the LG regenerated and normal function was restored. This injury increased the number of BrdU labeled cells demonstrating a population of cells that are mobilized to regenerate LG acinar, ductal, and myoepithelial cells.
Several possible types of cells could be used in LG repair. One possible cell type is the mesenchymal cell recruited by epithelial mesenchymal transition (EMT) (You et al., 2012). A second possible cell type is the epithelial progenitor cell. A third possibility is the myoepithelial cell. In rat LG and injured mouse LG, myoepithelial cells are positive for stem/progenitor cell markers (Shatos et al., 2012a; You et al., 2012). No published evidence has eliminated any of these cell types, mesenchymal, epithelial, or myoepithelial, from being stem/progenitor cells in the LG.
The role of stem/progenitor cells in LG repair in chronic dry eye has not been published to date. To determine if stem/progenitor cells are altered in chronic dry eye we used thrombospondin 1 null mice (TSP1−/−) that spontaneously develop autoimmune dry eye as they age (Turpie et al., 2009). TSP1 is a large matricellular protein found both intra- and extracellularly (Resovi et al., 2014). Multiple domains of TSP1 allow its interactions with cell surface receptors, growth factors, cytokines, or extracellular matrix proteins thereby supporting a variety of functions within the cell including modulation of cell migration, proliferation, and cell death (Masli et al., 2014). Therefore, TSP1 can regulate both extracellular and intracellular signaling complexes.
Turpie et al. and Contreras Ruiz et al. have reported both lacrimal gland and ocular surface abnormalities associated with dry eye in TSP1−/− mice (Contreras-Ruiz et al., 2013; Turpie et al., 2009). This mouse model offers the advantage of comparing the appearance of inflammatory infiltrates with the development of functional defects in the LG, unlike other mouse models of dry eye syndromes in which the lacrimal gland infiltration is secondary to the disease. To further support the use of TSP1−/− mice as a model of chronic dry eye, a recent study showed that a TSP1 polymorphism that causes a decrease in conjunctival TSP1 levels and an increase in IL-1β expression predisposes individuals to chronic dry eye after refractive surgery (Contreras-Ruiz et al., 2014).
To determine if degenerative changes in TSP1−/− LG are associated with regenerative abnormalities we evaluated changes in cellular turnover and progenitor cell population in TSP1−/− mice. As ADDE and Sjögren’s syndrome in humans are more common in females than males, we characterized LG disease progression in female TSP1−/− mice. We investigated the cytokine and stem cell transcription factor expression, architecture of the LG, proliferation, and localization of stem cell markers with increasing age in the LGs of TSP1−/− and age matched wild type (WT) mice. In female TSP1−/− compared to WT mice we found a change in cytokine expression, cellular infiltrates, cellular morphology, a decrease in cellular proliferation, and an alteration in progenitor cell markers occurred with increased disease progression.
2. Materials and methods
2.1. Materials
Antibodies directed against Sox 2, Pax 6, CHX10, ABCG2, ΔNP63, CD47, and anti-rabbit secondary antibody conjugated to horse-radish peroxidase (HRP) were purchased from Santa Cruz Biotechnology (Santa Cruz, CA) while antibodies directed against Musashi 1, nestin, heparin sulfate and anti-mouse secondary antibody conjugated to HRP were purchased from EMD Millipore (Billerica, MA). α-Smooth muscle actin (αSMA) was from Diagnostic Biosystems (Pleasanton, CA). Antibody directed against β-actin was purchased from Sigma-Aldrich (St. Louis, MO). Antibody against E-cadherin (mouse monoclonal, clone 36) was from BD Biosciences (San Jose, CA) while anti-bromodeoxyuridine (BrdU) and aquaporin (AQ) 5 were obtained from Abcam (Cambridge, MA).
2.2. Animals
All experiments conformed to the National Institutes of Health guide for the care and use of laboratory animals (NIH Publications No. 8023, revised 1978) and were approved by the Schepens Eye Research Institute Animal Care and Use Committee. Female C57BL/ 6J served as the wild type mice and were purchased from The Jackson Laboratory (Bar Harbor, ME). TSP1−/− mice were originally obtained from Dr. J. Lawler (BIDMC, Harvard Medical School, Boston, MA) and bred at the Schepens Eye Research Institute Animal Facility. These mice were made on the C57BL/6J background. Only female mice were used in this study. All mice were maintained in constant temperature rooms with fixed light-dark intervals of 12 h and were fed ad libitum. Mice were anesthetized in CO2 and cervical dislocation was performed. Both exorbital LGs were removed immediately. When possible, studies were carried out on mice at 4, 12, and 24 weeks of age that represent no-disease, early disease, and late disease, respectively.
2.3. Real-time PCR and RT2 profiler PCR array
Total RNA was isolated from the LG of 4, 12, and 24 week old WT or TSP1−/− mice using RNA Isolation kit (SA Biosciences, Valencia, CA). cDNA was synthesized by reverse transcription of the RNA using oligo dT and M-MLV RT (Promega, Madison, WI). Sequences of primers were as follows: IFN-γ: 5′-TCAGCAACAACATAAGCGT-CAT-3′, 5′-GACCTCAAACTTGGCAATACTCAT-3′; IL-1β: 5′-TCTGAAG-CAGCTATGGCAACTGTT-3′, 5′-CATCTTTTGGGGTCCGTCAACT-3′; IL-17: 5′-AGTGAAGGCAGCAGCGATCAT-3′, 5′-CGCCAAGGGAGT-TAAAG-3′; IL-6: 5′-AGTCAATTCCAGAAACCGCTATGA-3′, 5′-TAGG-GAAGGCCGTGGTTGT; TNFα: 5′-GGCCTCCCTCTCATCAGTTCTATG-3′, 5′-GTTTGCTACGACGTGGGCTACA-3′; Ki67: 5′-CTCCACGAACCT-CAAAGA-3′, 5′-TGTGGATTCCTTCACACCTT-3′; CD47: 5′-TGGTATC-CAGCAAGCCTTAG-3′, 5′-AAGACACCAGTGCCATCAAT-3′; GAPDH: 5′-CGAGAATGGGAAGCTTGTCA-3′, 5′-AGACACCAGTAGACTCCACGA-CAT-3′. Amplification reactions were performed using qPCR kit (Kappa Biosystems, Woburn, MA) in triplicate with the following cycles: 50 °C for 2 min for 1 cycle; 95 °C for 15 min for 1 cycle; 52–55 °C for 1 min for 40 cycles; 72 °C for 30 s for one cycle on an ABI Prism analyzer (Applied Biosystems Inc, Foster City, CA). Fluorescence was analyzed after each cycle and relative quantification of gene expression relative to GADPH was determined. Gene expression in TSP1−/− mice was then compared to gene expression in WT mice.
To study expression of stem cell transcription factors in diseased and healthy LGs, RNA was isolated from TSP1−/− and WT glands using RNeasy Mini kit (Qiagen, Valencia, CA); cDNA was made using RT2 First Strand Kit (Qiagen) and applied to The Mouse Stem Cell Transcription Factors RT2 Profiler PCR Array (Qiagen). Quantitative RT-PCR was performed on the ABI 7300 system (Life Technologies, Grand Island, NY) and the threshold cycle (Ct) for each well was determined by the real-time cycler software.
Data was analyzed using online normalization and analysis tools (http://sabiosciences.com/pcrarraydataanalysis.php) and statistically significant differences in mean Ct values were determined. The difference was considered significant when both p < 0.05 and >1.5 fold change were present. Genes with undetermined Ct values in both TSP1−/− and WT samples were excluded from the final tables.
2.4. Histology
Excised LGs from 4, 12, and 24 week-old WT and TSP1−/− female mice were fixed for 24 h in 4% formaldehyde made in phosphate buffered saline (PBS, 145 mM NaCl, 7.3 mM Na2PO4 at pH 7.2) and cryopreserved overnight in 30% sucrose in PBS. Glands were embedded in optimal cutting temperature compound (OCT) and 6 μm sections were cut, and placed on glass slides. Slides were stained with hematoxyline/eosin (H&E) and photographed using a Nikon Eclipse microscope 80i.
2.5. Determination of acinar cell size
H&E stained sections from WT and TSP1−/− mice at 4, 12 and 24 weeks were analyzed. The size of acinar cells and size of area occupied by acinar cells were determined. For acinar cell area, images were converted to 8-bit images and the contrast was enhanced to the same extent on all images. Confocal images for nuclei were unmodified. Using the Region of Interest (ROI) manager in Image J, 30 acini from each micrograph were picked at random, outlined, and the acinar cell area was determined. Data from nuclear size from TSP1−/− is expressed relative to nuclear size of WT mice.
A second method to determine acinar cell size was also used. A total of 63 images were processed by Fiji software (Schindelin et al., 2012) in random order by one investigator blinded for the experimental groups. The largest possible section in the image that contained no obvious ducts or accumulation of fibrous tissue was chosen for analysis. The images were adjusted for brightness by various approaches to ease the counting. The size of this area was determined. The Fiji software also allowed for the counting of the number of nuclei automatically by applying the following commands for each of the images: “process →find maxima →exclude edges → noise tolerance 13 (most often) → single points → preview”. To get an indirect measure of the average area of the acinar cells in the experimental groups, the area within each section chosen from the original image was calculated in pixels. The area was divided by the number of nuclei identified in each section. Nuclei that were cut by the frames of the sections were automatically excluded to ensure consistency.
2.6. Cell proliferation
In vivo cell proliferation was determined by injecting 12 week old WT and TSP1−/− female mice intraperitoneally with 100 mg/kg body weight BrdU which was dissolved in saline. The mice were injected 4 times 2.5 h apart. Sixteen hours after the last injection, the LGs were removed and processed as described in Histology section. LG sections were cut and incubated with anti-BrdU antibody. The BrdU positive cells were viewed using diaminobenzidine and hydrogen peroxide. Positive cells were counted in a blind fashion in 5 fields per gland by two independent investigators.
2.7. Western blotting analysis
LGs from 12 or 24 week old WT and TSP1−/− mice were homogenized in RIPA buffer (50 mM Tris-HCl pH 7.4, 1% NP-40, 0.1% SDS, 150 mM NaCl, 0.5% sodium deoxycholate, and 1 mM EDTA containing a protease inhibitor cocktail, 100 μg/mL phenyl-methylsulfonylfluoride, 30 μg/mL aprotinin, and 1 mM sodium orthovanadate). The proteins were separated by SDS-PAGE and transferred from the gel onto a nitrocellulose membrane. The membrane was then blocked in 5% non-fat dried milk in buffer containing 10 mM Tris-HCl, pH 8.0,150 mM NaCl, and 0.05% Tween-20 (TBST) for 1 h at room temperature, and incubated with the primary antibody diluted in 5% dried milk-TBST overnight at 4 °C with the appropriate primary antibody (1:500 dilution for all antibodies except CHX10 which was 1:100 and β-actin which was 1:1000) followed by secondary antibody conjugated to HRP for 1 h. Detection was performed with the SuperSignal West Pico Chemiluminescent Substrate (Thermo Scientific, Rockford, IL) and the immunoreactive bands were analyzed by Image J (Rasband, W.S., ImageJ, U. S. National Institutes of Health, Bethesda, Maryland, USA, http://imagej.nih.gov/ij/, 1997–2012.). The amount of protein was standardized to the amount of β-actin.
2.8. Immunofluorescence microscopy
Excised LGs from female TSP1−/− and WT mice 4, 12 and 24 weeks of age were removed, fixed, frozen, and 6 μm sections cut. Frozen sections were rinsed with PBS and blocked with 0.3% BSA in PBS. Sections were incubated with primary antibodies specific for progenitor cells in combination with anti-αSMA, which identifies myoepithelial cells. All primary antibodies were used at a dilution of 1:100. Isotype negative controls consisted of either normal goat IgG, normal mouse IgG2a or normal rabbit IgG at dilutions of 1:100. Secondary antibodies were used at 1:100 or 1:300 dilutions. Sections were mounted with coverslips using polyvinyl alcohol (PVA) and 1,4 diazabicyclo[2.2.2] octane (DABCO). Sections were evaluated for the expression of progenitor cell markers using a Leica TSC-SPC2 upright scanning confocal microscope.
2.9. Statistical analysis
Data were analyzed by Student’s t-test and p ≤ 0.05 was considered statistically significant.
3. Results
3.1. Expression of pro-inflammatory cytokines is altered with age in TSP1−/− compared to WT LGs
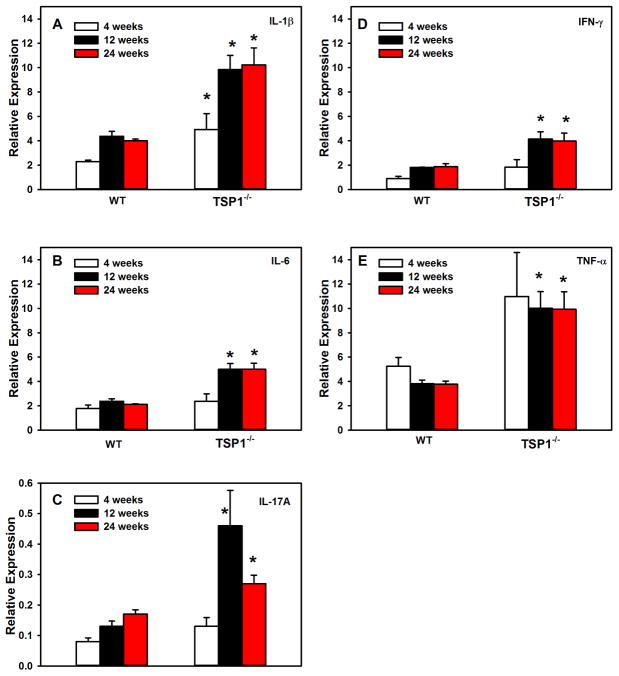
Pro-inflammatory cytokines increase with disease progression in chronic inflammatory diseases including Sjogren’s syndrome. To determine when pro-inflammatory cytokines changed in female mouse LGs, RNA was isolated from the LGs of 4, 12, and 24- week old WT and TSP1−/− female mice and qPCR was performed using primers for the pro-inflammatory cytokines IL-1β, IL-6, IL-17A, IFN-γ, and TNF-α. In 4 week-old mice, the expression of IL-1β was significantly increased to 4.9 ± 1.3 fold in TSP1−/− mice compared to 2.3 ± 0.1 fold in WT mice (Fig. 1A). No other cytokine expression was significantly altered at this age. In 12 week-old mice, the expression of all cytokines tested was significantly increased in TSP1−/− over WT mice (Fig. 1A–E). The increased expression of cytokines persisted to at least 24 weeks of age (Fig. 1A–E). These results indicate that by 12 weeks, the expression of IL-1β, IL-6, IL-17A, IFN-γ, and TNF-α are increased in LGs of 12 week old mice that persisted until at least 24 weeks.
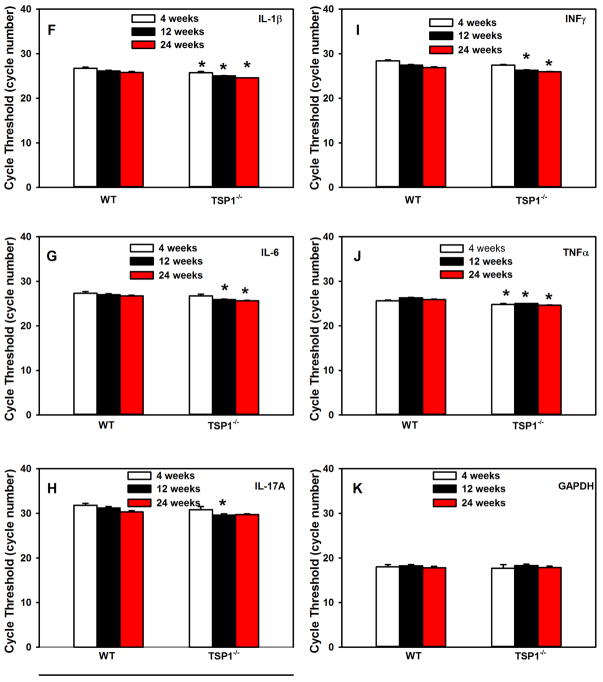
Fig. 1. Changes in Cytokine Expression in Lacrimal Glands of TSP1−/− Compared to WT Mice.
RNA was isolated from LGs of female TSP1−/− and WT mice and cDNA generated. qPCR was performed using primers for interleukin (IL)-1β (A), IL-6 (B), IL-17A (C), interferon γ (IFN-γ, D), and transforming growth factor (TGF)-α (E) in 4, 12, and 24 week old mice. Data are expressed as mean ± SEM from 3 mice. The number of cycles required to detect a fluorescent signal (cycle threshold, Ct) was measured and plotted for IL-1β (F), IL-6 (G), IL-17A (H), IFN-γ (I), and TGF-α (J) and GAPDH (K) at 4, 12, and 24 weeks old. * indicates significance from WT expression at the same age.
The cycle threshold (Ct) was also determined for each cytokine as well as the control GAPDH (Fig. 1F–K). All genes were abundantly expressed. At 4 weeks of age, the Ct values for IL-1β, and TNFα in TSP1−/− mice were significantly decreased from that observed in WT mice (Fig. 1F, I, and J). At 12 weeks, the Ct values for all cytokines were significantly decreased from that observed in WT mice (Fig. 1F–K). Ct values for all cytokines in TSP1−/− mice except IL-17A were significantly decreased at 24 weeks of age. The decrease in Ct values suggests that there is an increase in the expression of the cytokines in the TSP1−/− mice with age. And confirms the results shown in Fig. 1A–E. The Ct values for GAPDH were not altered at any time and were not different between WT and TSP1−/− mice.
3.2. TSP1−/− LG morphology and, proliferation, are altered with age compared to WT glands
3.2.1. Lymphocytic infiltration of the LGs of TSP1−/− mice
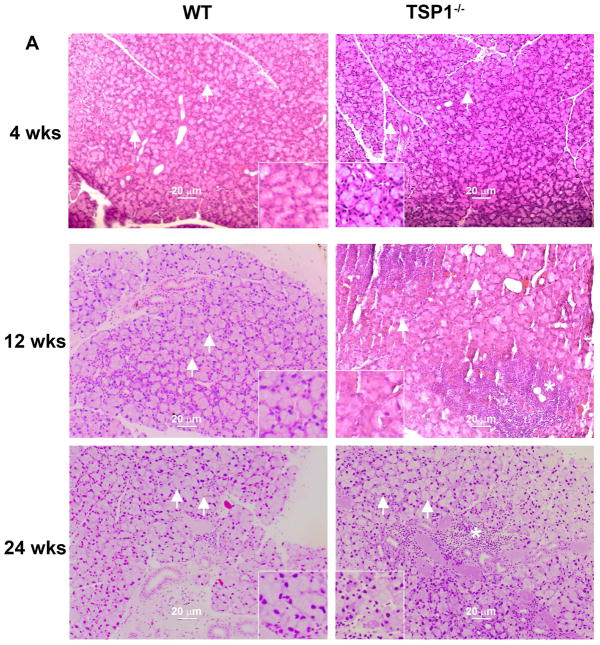
The LGs of WT and TSP1−/− mice at 4, 12, and 24 weeks old were removed, fixed, sectioned and stained with H&E as described in the Methods. At 4 weeks of age, there were no signs of lymphocytes in the glands of either strain (Fig. 2A). Lymphocytes were present at 12 and 24 weeks of age in LGs from TSP1−/− mice but not WT mice (Fig. 2A).
Fig. 2. Structural Changes in Lacrimal Glands of TSP1−/− Compared to WT Mice.
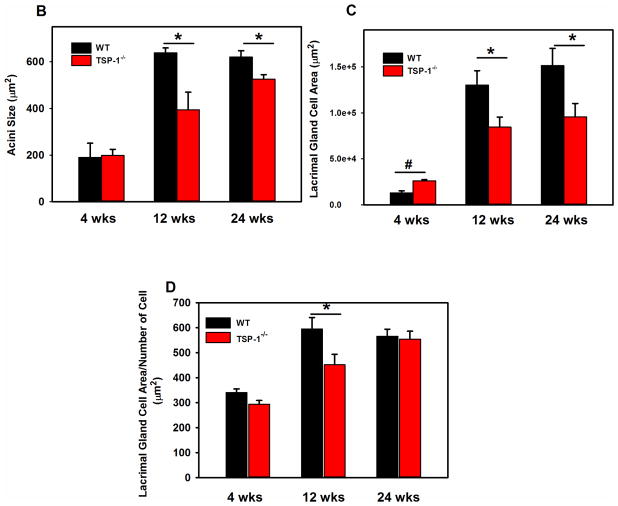
LGs of female WT and TSP1−/− mice at 4, 12, and 24 weeks of age were fixed, sectioned, and stained with hematoxyline/eosin (H&E). Representative micrographs of 4, 12 and 24 week old mice are shown in A. * indicates lymphocytic loci. Magnification 200×. Inset magnification 400×. Using these micrographs, 30 acinar cells were randomly identified (as shown by the arrows) in A and the area of the cell determined using Image J. Data in B is mean ± SEM from 5 mice for each age. The largest lacrimal gland area containing only acinar cells for each section is shown in C. In D, acinar cell area was also measured using Fuji. The largest lacrimal gland area containing only acinar cells was measured along with the number of nuclei in that area. The average area of acinar cells was calculated. Data are mean ± SEM from 5 mice for each age.* indicates significance difference from WT mice. Methods are described in detail in text.
3.2.2. Acinar cell area and acinus area changes with age in TSP1−/− LGs
In H&E staining, acini from the LGs of 12 week old TSP1−/− mice appeared smaller than those from the LGs of WT animals (Fig. 2A). To determine if this was the case and if the structure of the LGs of TSP1−/− compared to WT mice is altered with increasing age and disease progression, the size of acinar cells were determined by two different methods using H&E stained sections of LGs from WT and TSP1−/− mice at 4, 12, and 24 weeks of age (Fig. 2A). In the first method, thirty acini were selected at random from H&E stained micrographs of LGs of WT and TSP1−/− animals at the three ages indicated above. The area of each acinar cell was determined using Image J and the average acinar area calculated for each age. There was no difference in acinar cell size in LGs of WT and TSP1−/− from 4 week-old animals (Fig. 2B). However, at 12 weeks of age, the acinar cell area was significantly smaller in TSP1−/− compared to WT mice with an average acinar cell area in TSP1−/− mice of 394.3 ± 75.8 μm2 compared to 638.3 ± 21.2 μm2 (Fig. 2B). Similarly at 24 weeks, acinar cell area from TSP1−/− mice was significantly smaller than WT mice and was 525.5 ± 19.7 μm2 compared to 620.4 ± 27.3 μm2 (Fig. 2B). When comparing 4, 12, and 24 week-old mice, acinar cell size in WT mice increased from 4 to 12 weeks of age and remained stable at 24 weeks of age. In contrast, LG acini of TSP1−/− compared to WT mice LGs grew more slowly. Although acinar cell size continued increasing in TSP1−/− LGs, these cells remained smaller than WT at older ages.
A second method was used to determine if the size of LG acinar cells is altered with increasing age and disease progression in TSP1−/− compared to WT mice. Areas of LG occupied by only acinar cells (no ducts or connective tissue) was selected in H&E stained sections TSP1−/− and WT mouse LG and analyzed using Fiji software. When the size of the areas of LG occupied by only acinar cells was plotted, the area of the acini was slightly but significantly increased in TSP1−/− compared to WT mice at 4 weeks (Fig. 2C). However, at 12 and 24 weeks of age, the area occupied by acini was significantly decreased in TSP1−/− compared to WT mice at 12 and 24 weeks of age.
The size of the acinar cell was determined by dividing the area by the number of nuclei present. A larger the ratio indicates larger cells. The size of acinar cells in TSP1−/− mice was not significantly different from WT mice at 4 weeks of age but significantly decreased by the time the animals reached 12 weeks of age (Fig. 2D). At 24 weeks of age, there was no difference in acinar cell size between WT and TSP1−/− mice. As in Fig. 2B, WT LG acinar cell size plateaued at 12 weeks whereas TSP1−/− LG cell size continued to increase until they reached the size of WT acini at 24 weeks.
3.2.3. Structure of the LG cells is altered in TSP1−/− mice
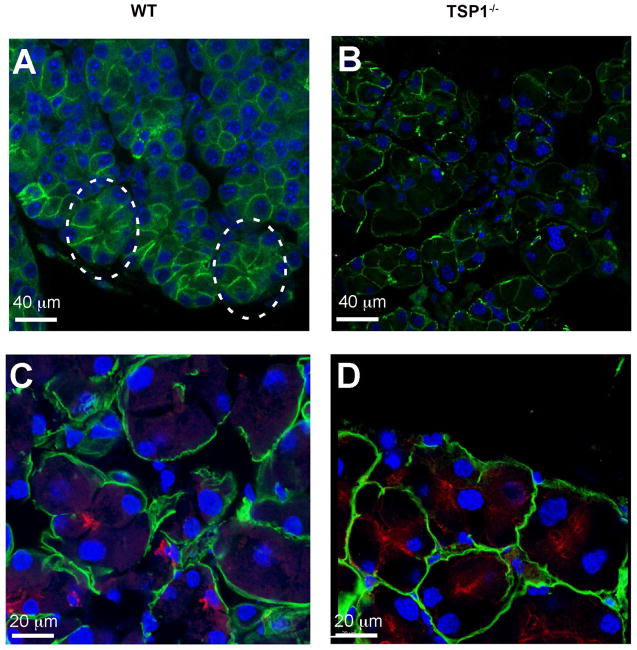
E-cadherin is a member of the cadherin protein family and is an important in cell-cell adhesion molecule and mechanically couples cells in a tissue (Guillot and Lecuit, 2013). E-cadherin molecules help maintain epithelial cell polarity and barrier function as well as tissue plasticity. These junctions are remodeled in cell division (new cell junctions are formed), live cell extrusion, cell death (remove cell junctions), and cell migration. The absence of E-cadherin may lead to an accumulation of free beta-catenin and changes in gene expression. In LG of 24 week-old WT mice, E-cadherin binding demonstrates well-defined, organized, trapezoid-shaped acini (as indicated by circles in Fig. 3A). Compared to WT, acinar cells of TSP1−/− mice are more circular and less organized suggesting a loss of cell-cell contact and communication (Fig. 3B).
Fig. 3. Localization of E-Cadherin in Lacrimal Glands in TSP1−/− Compared to WT Mice.
Lacrimal glands of female WT (A and C) and TSP1−/− (B and D) mice at 24 weeks of age were fixed, sectioned, and confocal microscopy was performed using an antibody against E-cadherin (A and B). Green indicates E-cadherin; Circle in A identifies a normal acinus. Sections were also stained with aquaporin 5 (red in C and D) and heparin sulfate (green in C and D); blue indicates DAPI stained nuclei.
To determine if the acinar cells lose polarity in TSP1−/− compared to WT lacrimal glands, sections were stained with a basolateral membrane marker anti-heparin sulfate antibody and with an apical membrane marker anti-aquaporin 5 antibody (Fig. 3C and D). If acinar cell polarity was lost the markers would lose their membrane-specific localization. In 24-week old WT mouse LG acinar cells heparin sulfate immunoreactivity was detected only in the basolateral membrane and aquaporin 5 only in the apical membrane. In TSP1−/− LG acinar cells this distribution was unchanged. Thus TSP1−/− LG acinar cells appear to maintain their polarity.
3.2.4. Cellular proliferation decreases in TSP1−/− LGs
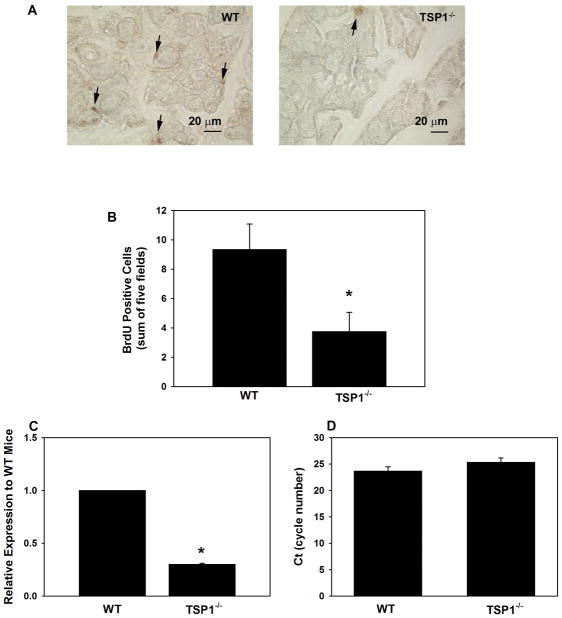
To measure cell proliferation, 12 week-old female WT and TSP1−/− mice were injected with BrdU. Sections of LG were incubated with an antibody directed against BrdU and the number of BrdU positive cells was counted. A greater number of LG cells were positive for BrdU in WT compared to TSP1−/− mice (Fig. 4A). In WT mice, 9.3 ± 1.8 cells per five fields were labeled with BrdU (Fig. 4B). In contrast, in TSP1−/− mice only 3.8 ± 1.3 cells per five fields stained positive for BrdU, a decrease of 59%. This decrease in proliferation seen in LG cells of TSP1−/− mice was significant compared to LG cells of WT mice. These data demonstrate that cellular proliferation in the LGs of TSP1−/− was decreased compared to WT mice.
Fig. 4. Cell Proliferation in Lacrimal Glands in TSP1−/− Compared to WT Mice.
Female WT and TSP1−/− mice were injected with BrdU. Lacrimal glands were removed, fixed and stained using an anti-BrdU antibody. Representative micrographs are shown in A. Magnification 400×. Arrows indicate BrdU positive cells. BrdU positive cells were counted and data shown in B. Data are mean ± SEM from 5 animals. RNA was isolated from 12 week old LGs of female WT and TSP1−/− mice and cDNA generated. qPCR was performed using primers for Ki67. Data are expressed as ratio of cytokines from TSP1−/− mice relative to WT mice from 3 mice and is shown in C. The number of cycles required to detect a fluorescent signal (cycle threshold, Ct) was measured and plotted in D. * indicates significance difference from WT mice.
To confirm that proliferation was decreased in TSP1−/− mice, qPCR was performed using primers to Ki67, a protein well established to be expressed in all stages of the cell cycle except G0 (Andre et al., 2015). In 12 week old mice, Ki67 expression was significantly decreased 70.2± 1.3%. in TSP1−/− compared to WT mouse LGs (Fig. 4C). The Ct FOR Ki67 in WT and TSP1−/− mice is shown in Fig. 4D. The Ct value for WT mice was 23.6 ± 0.8 cycles which was not significantly different from that obtained with TSP1−/− mice of 25.3 ± 0.8 cycles.
Data from this section indicate a change in cellular homeostasis in the TSP1−/− LG that occurs by 12 weeks of age and persists at 24 weeks of age. The LG acinar cells changed shape. Consistent with this there was a decrease in cellular proliferation in the TSP1−/− LG. The changes in cellular homeostasis occur at the time of increased levels of cytokines and cellular infiltration. These findings prompted us to examine LG progenitor cells.
3.3. Changes in the expression of CD47 and progenitor cell markers in TSP1−/− compared to WT LGs
3.3.1. Amount of TSP1 receptor CD47 decreases in TSP1−/− LGs
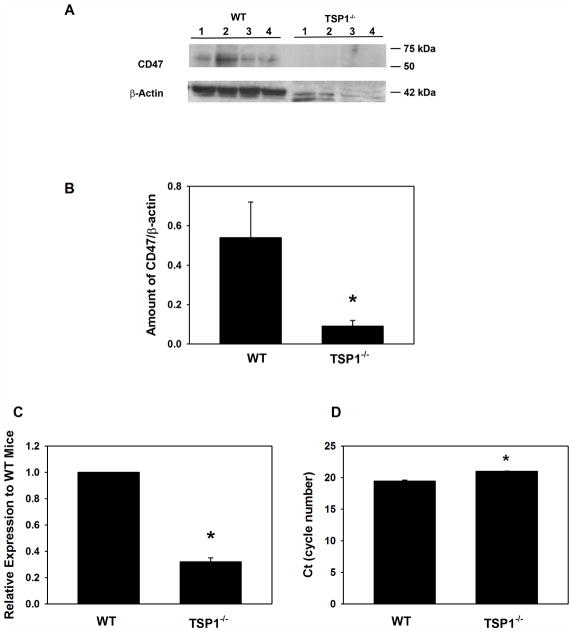
CD47, also known as integrin-associated protein, binds to the C-terminal domain of TSP1 (Lopez-Dee et al., 2011). CD47 permits sustained proliferation of endothelial cells and allows them to reprogram to form multipotent embryoid body-like clusters. Kaur et al. demonstrated that in the absence of CD47 or TSP1, expression of stem cell transcription factors c-Myc, Klf4, Oct4, and Sox2 is elevated and cells can self-renew in mouse lung endothelial cells (Kaur et al., 2013). Therefore, we investigated CD47 expression in the TSP1−/− LGs. Western blotting analysis was used to determine the level of CD47 in LG homogenate from TSP1−/− and WT mice at 12 weeks of age. Surprisingly, the amount of CD47 was substantially decreased at 12 weeks of age in the knock out compared to WT LGs (Fig. 5A and B). This finding suggests that in TSP1−/− mouse LGs progenitor cells could be activated.
Fig. 5. Amount of CD47 in Lacrimal Glands in TSP1−/− Compared to WT Mice.
Lacrimal glands from female WT and TSP1−/− mice at 12 weeks old were removed, homogenized and proteins subjected to western blot analysis using antibodies against CD47 and β-actin. Western blot is shown in A. Each lane represents an individual animal. Gels were scanned and amount of CD47 (B) was standardized to amount of β-actin. Data are mean ± SEM from 4 individual animals. RNA was isolated from 12 week old LGs of female WT and TSP1−/− mice and cDNA generated. qPCR was performed using primers for CD47. Data are expressed as ratio of cytokines from TSP1−/− mice relative to WT mice from 3 mice and is shown in C. The number of cycles required to detect a fluorescent signal (cycle threshold, Ct) was measured and plotted in D. * indicates significant difference from values of WT mice.
As another method to determine if the amount of CD47 is altered in the LGs of TSP1−/− mice, qPCR was performed using primers to CD47. As shown in Fig. 5C, the amount of CD47 expression was significantly decreased 67.8± 2.9% in TSP1−/− compared to WT mouse LGs. The Ct for CD47 in WT and TSP1−/− mouse LGs is shown in Fig. 5D. The Ct value for WT mice was 19.4 ± 0.2 cycles which was significantly decreased from that obtained with TSP1−/− mice which was 21.0 ± 0.04 cycles. This implies that the mRNA levels for CD47 are decreased in TSP1−/− mouse LGs compared to WT mice.
3.3.2. Stem cell transcription factors expression is modulated in TSP1−/− LGs
A collection of transcription factors have been identified that play important roles in the specification and/or expansion of LG stem/progenitor cells. We performed the Transcription Factors RT2 PCR profiler array to investigate changes in the stem cell transcription factors expression profile of TSP1−/− compared to WT LG tissues obtained from 12 to 14 week old mice. Mean Ct values of genes present on the array, which passed through the quality control, were compared between TSP1−/− and WT LGs. Fourteen differentially expressed genes were identified (Tables 1 and 2). Three genes were significantly upregulated (Table 1) while eleven genes were significantly downregulated in TSP1−/− LGs (Table 2).
Table 1.
Genes over - expressed in TSP1−/− LG compared to control WT LGs.
| Gene symbol | Fold regulation | P value |
|---|---|---|
| Pax5 | 2.0461 | 0.016034 |
| Irx4 | 1.8064 | 0.022325 |
| Jun | 1.7801 | 0.016034 |
Table 2.
Genes under-expressed in TSP1−/− LGs compared to control WT LGs.
| Gene symbol | Fold regulation | P value |
|---|---|---|
| Pou4f1 | −8.2158 | 0.020132 |
| Tert | −4.9222 | 0.013001 |
| Sox6 | −4.5896 | 0.000543 |
| Lmx1b | −2.8346 | 0.004942 |
| Notch2 | −2.5289 | 0.003041 |
| Six2 | −2.4534 | 0.018252 |
| Vdr | −2.0034 | 0.00217 |
| Pax6 | −1.5878 | 0.007417 |
| Runx1 | −1.5846 | 0.006034 |
| Sox9 | −1.5601 | 0.027305 |
| Klf4 | −1.543 | 0.044424 |
Genes with multiple undetermined Ct values in both KC and control samples were excluded. Only significant results with p < 0.05 are presented in Tables 1 and 2 Three independent analyses were performed.
Expression of only three genes was increased. One gene, Jun oncogene expression, also known as Junc/c-jun, is positively regulated by IL-1β expression, and its activation increases inflammation (Guma and Firestein, 2012; Li et al., 2015) (Jun: 1.8 fold increase, p = 0.05). This correlated with increased expression of apoptosis marker - iroquois homeobox protein-4 (Irx4: 1.8 fold increase, p = 0.02). Most interestingly we also found a significant increase in paired box protein-5 (Pax5: 2.1 fold increase, p = 0.02). Pax5 expression is a specific marker for B cell lineage (Adams et al., 2009; Anderson et al., 2007; Cotta et al., 2003). These results are consistent with the increased inflammation in TSP1−/− mouse LGs at 12 weeks of age.
We found that expression of the pluripotency factor octamer-binding transcription factor 4 (Oct4), also known as POU5F1 (POU domain, class 5, transcription factor 1) was highly decreased (8.2 fold decrease; P = 0.02). Oct 4 is a marker for undifferentiated stem cells, which is involved in the regulation of self-renewal of epithelial stem cells in different tissues (Garcia-Lavandeira et al., 2012; Hassiotou et al., 2013; Samardzija et al., 2012). Down-regulation of Oct4 expression correlated with a decreased level of CD47 (Fig. 5). We also found decreased expression of several transcription factors involved in regulation of cell proliferation and tissue maintenance: telomerase reverse transcriptase (Tert: 4.9 fold decrease, p = 0.01); paired box protein-6 (Pax-6: 1.6 fold decrease, p = 0.007); Runt-related transcription factor-1 (Runx1: 1.6 fold decrease, p = 0.006), and kruppel-like factor 4 (Klf4: 1.5 fold decrease, p = 0.04). Tert1 regulates proliferative potential to most human and mouse cells through its ability to elongate telomeres (Blasco, 2007).
Pax6 regulates LG cell proliferation and branching morphogenesis and has a major role in maintenance of the adult ocular tissues (Makarenkova et al., 2000; Shatos et al., 2012b). As we showed previously transcription factor Runx1 is expressed in the LG epithelial progenitor cells and regulates their proliferation and is involved in the mechanisms controlling LG regeneration (Voronov et al., 2013). Kruppel-like transcription factors (Klf4 and Klf5) are among the most abundant genes in the ocular adnexa including the LG and meibomian glands and have important role in cell proliferation and ocular tissue differentiation.
Expression of Notch2 that functions as a receptor for membrane-bound ligands Jagged1, Jagged2 and Delta1 to regulate cell-fate determination was also significantly decreased (Notch2: 2.5 fold decrease, p = 0.003). Other factors with decreased expression in the TSP1−/− LGs were SRY-box containing transcription factors (Sox) 6 and 9, stem cell markers) (Sox6: 4.6 fold decrease, p = 0.0005; Sox9: 1.6 fold decrease, p = 0.03). Sox6 and 9 define a transcription factor signature for LG epithelium (Voronov et al., 2013). More recently Sox9 was reported to regulate the expression of heparin sulfate-synthesizing enzymes (HSSE), which are required for the synthesis and function of heparin sulfate (HS), to promote FGF signaling and LG morphogenesis (Chen et al., 2014). In addition TSP1−/− LGs showed decreased level of the epithelially expressed sine oculis-related homeobox transcription factor-2 (Six2: 2.5 fold decrease, p = 0.02) and LIM Homeobox Transcription Factor 1 (Lmx1b: 2.8 fold decrease, p = 0.005). It has been shown that Six2 acts within a network of genes including eyeless (Pax family), eyes absent (Eya family) and dachshund (Dach family) to trigger eye tissue organogenesis (He et al., 2010). Lmx1b regulates tissue patterning, survival and differentiation of certain ocular cell types (McMahon et al., 2009). In this study we found that Lmx1b was highly expressed in the LG (with Ct values 22–23). We also found a moderate decrease in Sox2 expression (1.4 fold difference; p = 0.06), consistent with a decrease in CD47.
3.3.3. Amount and localization of progenitor cell marker proteins changes in TSP1−/− LGs
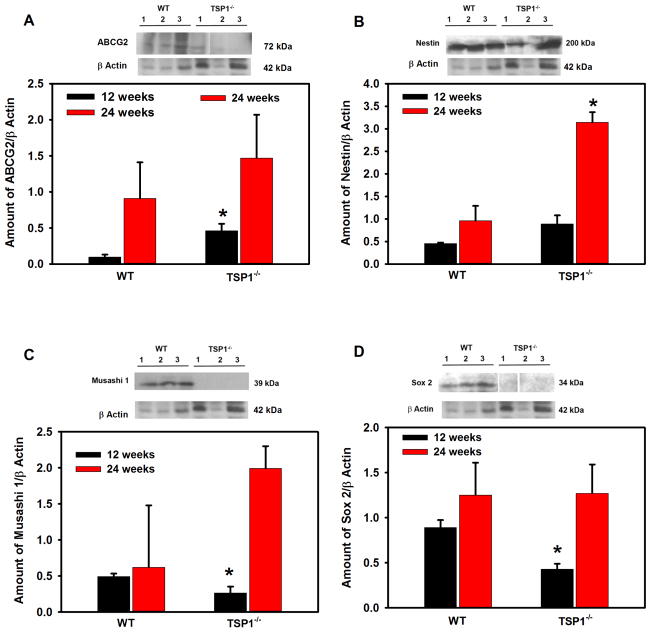
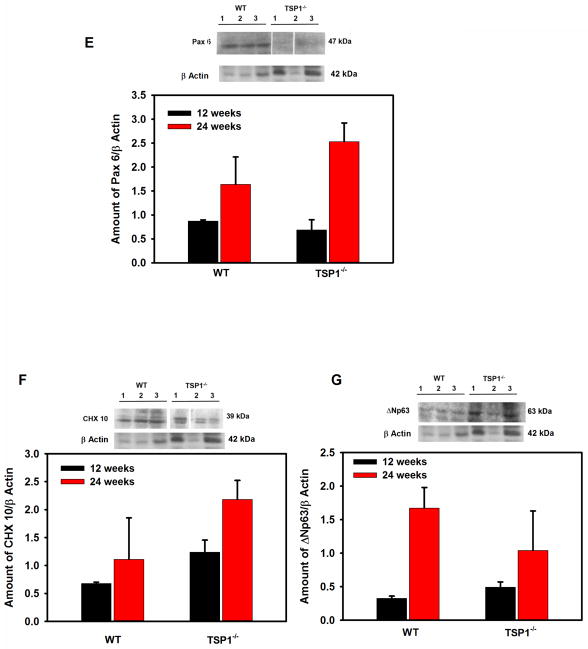
As cell proliferation was altered in LGs from TSP1−/− compared to WT mice, we investigated differences in the stem/progenitor cell populations. The progenitor cell markers ABCG2, nestin, Musashi I, Pax 6, CHX 10, Sox 2, and ΔNp63 were used as we previously showed that these markers were expressed in rat LG (Shatos et al., 2012a). ABCG2 is a member of the ATP binding cassette (ABC) transporters in sub-family G, isoform 2. This protein is responsible for transporting molecules across cellular membranes and is found in stem cell populations from pancreas (Wang et al., 2013), cornea (Stasi et al., 2014), and in lung cancer (Niu et al., 2013). Nestin is a type IV intermediate filament while Musashi 1 is a neural RNA-binding protein that regulates expression of target mRNA. Both are thought to be stem cell markers (Matsuda et al., 2012; Qu et al., 2014). Pax 6 is a transcription and master control gene for the development of eyes and sensory organs, and CHX 10 is a homeobox containing a transcription factor critical for progenitor cell proliferation (Mariappan et al., 2014; Wei et al., 2014; Xu et al., 2007). Sox 2 is a transcription factor essential in maintaining self-renewal of undifferentiated embryonic stem cells and in several different types of cancer (Boumahdi et al., 2014). ΔNP63 is an epithelial progenitor cell marker (Chakrabarti et al., 2014). Using western blot analysis, we determined if the amount of these progenitor cell markers were altered in LGs from 12 to 24 week-old WT and TSP1−/− mice. At 12 weeks of age, when standardized to β-actin, ABCG2 was significantly increased 79% in TSP1−/− compared to WT mouse LGs (Fig. 6A) while the amount of nestin was unchanged (Fig. 6B). In contrast, Musashi 1 and Sox 2 were decreased 46 and 52% respectively, in TSP1−/− compared to WT mouse LGs (Fig. 6C and D). The amount of Pax 6, CHX10, and ΔNP63 were unchanged at any age in TSP1−/− compared to WT mouse LGs (Fig. 6 E, F, and G). At 24 weeks, only nestin was significantly increased 69% in TSP1−/− over the amount of nestin expressed in WT mouse LGs (Fig. 6B). These changes clearly indicate that responses of progenitor cells to degenerative changes in TSP1−/− LGs occur in early disease but are not maintained.
Fig. 6. Amount of Stem Cell Markers in Lacrimal Glands in TSP1−/− Compared to WT Mice.
Lacrimal glands from female WT and TSP1−/− mice at 12 and 24 weeks old were removed, homogenized and proteins subjected to western blot analysis using antibodies against stem cell markers and β-actin. Western blots from 12 week old mice are shown in A–G. Each lane represents an individual animal. Gels were scanned and amount of the stem cell markers ABCG2 (A), Nestin (B), Sox 2 (C), Musashi1 (D), Pax 6 (E), CHX10 (F), and ΔNp63 (G) were standardized to amount of β-actin. Data shown in are mean ± SEM from 3 to 5 (12 week) and 5–7 (24 week) individual animals. * indicates significant difference from values of WT mice.
The localization of the progenitor cells was examined as previous studies in our laboratory reported that stem cells in the uninjured rat LG were associated with the myoepithelial cells (Shatos et al., 2012a). Confocal microscopy was used to determine the cellular location of the seven different progenitor/stem cell markers in mouse LG at 4, 12 and 24 weeks of age. Although we examined the localization of all stem/progenitor cell markers, micrographs from only the four markers whose amount changed by western blotting analysis are presented. Micrographs for ABCG2, Musashi, and Sox2 are from 12-week old LGs while the micrographs for nestin are from 24 week old LGs the ages at which the amounts changed. Markers not shown were all present predominantly on myoepithelial cells.
ABCG2 was present in the LGs of both WT and TSP1−/− mice. At 12 weeks of age, ABCG2 was widely distributed and localized in the basal and lateral membranes of the acinar cells and myoepithelial cells in WT mice (Supplemental Fig. 1A). At 12 weeks of age, the distribution and localization of ABCG2 in TSP1−/− mice was similar to that seen in WT mice (Supplemental Fig. 1A).
Musashi 1 was also present in the LGs of both WT and TSP1−/− mice. (Supplemental Fig. 1B). Musashi 1 was expressed in a punctate pattern in acinar cells and in myoepithelial cells in LGs of 12 week-old WT mice. In 12 week old TSP1−/− LGs Musashi-1 was present with a localization similar to that in WT cells Supplemental Fig. 1B).
Similar to ABCG2 and Musashi 1, Sox 2 was expressed in the myoepithelial cells in the LGs of both diseased and control mice at 12 weeks of age (Supplemental Fig. 1 C). There was limited expression of Sox 2 in the acinar cells of both types of mouse LGs (Supplemental Fig. 1C).
In LGs of mice at 24 weeks of age, nestin was expressed in myoepithelial cells in both WT and TSP1−/− glands (Supplemental Fig. 1D). There was little binding in the absence of primary antibody (Supplemental Fig. 1E and F). However, in LGs from WT mice, there was additional fluorescence in red globules that are probably lipofuscin that increases in LGs with age (Supplemental Fig. 1F).
3.4. Co-localization of stem/progenitor cell markers with myoepithelial cells in TSP1−/− LGs
As myoepithelial cells surround acini on the basal aspect it can be difficult to distinguish myoepithelial cell from basal membrane localization. In addition, the location of most stem/progenitor cell markers appeared to be at least in part on myoepithelial cells. Thus LG sections were double-labeled with αSMA, a specific marker of myoepithelial cells along with the stem/progenitor cell marker. All stem/progenitor cell markers co-localized to some extent with myoepithelial cells in both TSP1−/− and WT LGs.
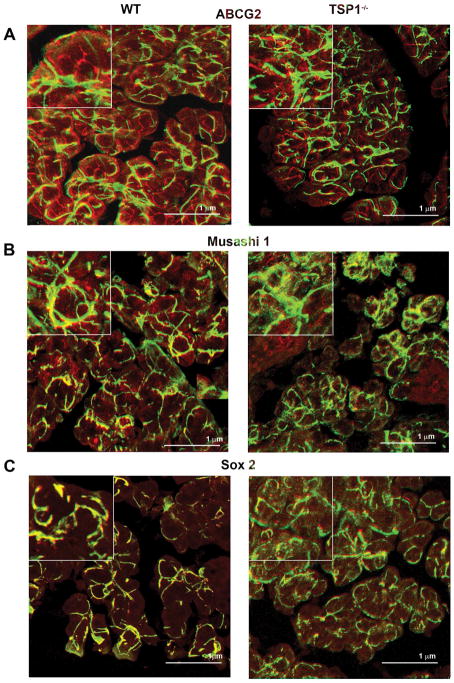
Immunofluorescence micrographs demonstrated the colocalization of myoepithelial cells and four stem/progenitor cells markers that changed in TSP1−/− compared to WT LGs. ABCG2 (red) labels the basolateral membranes of acini, while in contrast αSMA (green) labels the myoepithelial cells in 12 week old WT and TSP1−/− mouse LGs (Fig. 7A). We found some co-localization of ABCG2 with αSMA in these animals shown by the yellow and yellow green color, however the majority of ABCG2 staining remained on acinar cell basolateral membranes, distinct from the myoepithelial cells (Rios et al., 2005).
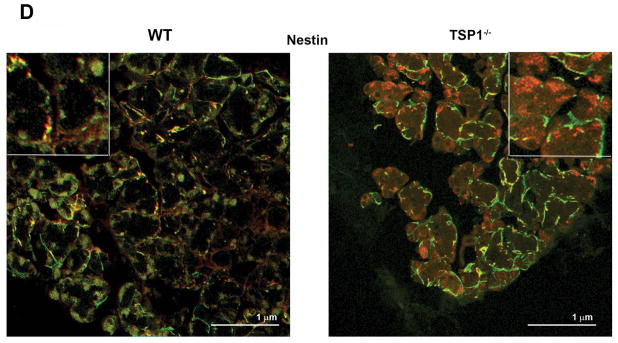
Fig. 7. Co-localization of ABCG2, Musashi1, Sox2, and Nestin with α-Smooth Muscle Actin in Lacrimal glands of WT and TSP1−/− Mice.
Lacrimal glands from 12 to 24 week old female WT and TSP1−/− mice were fixed, sectioned, and confocal microscopy was performed. In 12 week old mice antibodies against ABCG2 (A), Musashi1 (B), and Sox2 (C) (each shown in red) and α-smooth muscle actin (shown in green) were used while an antibody against nestin was used in 24 week old WT and TSP1−/− mice (D). Please note that the ABCG2, Musashi1, Sox2, and nestin micrographs are from Supplemental Fig. 1. Magnification 900×. Micrographs are representative of three individual animals.
At 12 weeks of age in both diseased and control mice, Musashi 1 had significant colocalization with αSMA indicated by the yellow and yellow green staining (Fig. 7B). Distinct myoepithelial cell shapes are present in all micrographs in Fig. 7. Mushashi-1 appears in the acinar cells indicated as particulate red staining.
Sox2 is almost exclusively present in myoepithelial cells as indicated by the absence of red staining in Fig. 7C. Distinct yellow green myoepithelial shapes are present at 12 weeks of age in both TSP1−/− and WT mouse LGs.
Except for the red globules, nestin is almost exclusively present in myoepithelial cells as indicated by the absence of red staining in Fig. 7D. Distinct yellow green myoepithelial shapes are present at 24 weeks of age in both TSP1−/− and WT mouse LGs.
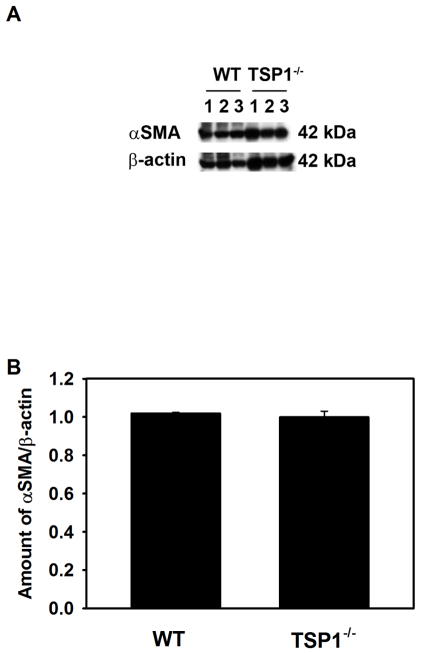
The results presented in Fig. 7 and Supplemental Fig. 1 suggest that a population of myoepithelial cells contains the stem/progenitor cells. To determine if the amount of αSMA differed between TSP1−/− and WT LG we performed western blotting analysis using an anti-αSMA antibody (Fig. 8). The amount of αSMA was not different between TSP1−/− and WT mouse LGs at 12 weeks of age implying that there was no difference in the number of myoepithelial cells or in the amount of αSMA in myoepithelial cells between diseased and control LGs.
Fig. 8. Amount of α-Smooth Muscle Actin in Lacrimal Glands in TSP1−/− Compared to WT Mice.
Lacrimal glands from female WT and TSP1−/− mice at 12 weeks old were removed, homogenized and proteins subjected to western blot analysis using antibodies against α-smooth muscle actin and β-actin. Western blot is shown in A. Each lane represents an individual animal. Gels were scanned and amount of α-smooth muscle actin was standardized to amount of β-actin. Data shown in B are mean ± SEM from 3 individual animals.
4. Discussion
Absence of TSP1 changes cell homeostasis in the female mouse LG as evidenced by smaller area containing acini, decreased acinar cell size, altered acinar cell shape, and decreased cell proliferation. All these changes are consistent with a disease process causing cellular damage indicated by changes in E-cadherin that results in cell death. The dead cells are not replaced as cell proliferation is impaired. The stem cell transcription factor array showed significant decreases in the stem/progenitor cell markers exclusively expressed in epithelial cells namely Pax6, Oct4 Sox2, Sox6, Sox9, Six2, Klf4, and Notch2. This result suggests that loss of TSP1 in the LG decreases function of the epithelial (ductal, acinar and/or myoepithelial) stem/progenitor cells. A partial loss of function of these transcription factors would delay stem cell activation and lead to reduced progenitor cell proliferation and as a result impaired LG regeneration in the TSP1−/− mice. Activation of inflammation also impacts the function of the stem/progenitor cells of epithelial and myoepithelial lineages. In agreement with these results on altered cellular homeostasis in female mouse LGs, we previously found increased apoptosis in 8 week-old male LGs from TSP1−/− mice (Turpie et al., 2009). TSP1 signals through CD47 to regulate cell proliferation and growth and the loss of TSP1 is correlated with reduced cellular proliferation in LG. These results imply that TSP1 increases cell proliferation in normal LG.
TSP1 is an exceedingly complex molecule and interacts with cell surface receptors, growth factors, cytokines, or extracellular matrix proteins thereby supporting a variety of functions within the cell. While it is clear that TSP1 is necessary in maintaining LG structure, it is not known if it is a direct effect of TSP1 or as a result of TSP1 regulation of signaling pathways to maintain cell polarity and differentiation.
The changes in LG cell structure and function detected in the present study in tissue sections and homogenate are most likely from acinar cells as they make up about 80% of the gland. These results are in contrast to results obtained in lung endothelial cells and retinal pigment epithelial cells in which cell proliferation was increased in TSP1−/− and CD47−/− mice (Farnoodian et al., 2015; Kaur et al., 2013). Thus the effects of TSP1 appear to be tissue specific.
From the results in Fig. 6 we believe that there are changes in progenitor/stem cell transcription factors between TSP1−/− and WT LG when all cell types were included. When myoepithelial cells alone were analyzed the changes in the number of cells on which the progenitor cell markers were located changed, but the cellular localization and co-localization with myoepithelial cells did not change, nor did the amount of myoepithelial cells. Thus either the function of the myoepithelial population of progenitor cells could differ between WT and TSP1−/− mice or it could be the acinar cells themselves that are the progenitor cells and the target of the TSP1 induced disruption of homeostasis.
In female TSP1−/− LGs cytokines are elevated at 12 weeks of age, the same age at which changes in cell homeostasis occur. To determine if in the female LG, LG dysfunction is driving the induction of inflammatory infiltrates rather than inflammation causing LG destruction or vice versa, additional younger ages must be studied. In contrast to the female, LG dysfunction prior to inflammatory cytokine elevation was observed in male TSP1−/− LGs (Turpie et al., 2009). Thus TSP1 in the extracellular matrix is needed for cell growth, proliferation, and survival along with intracellular TSP1 that could alter the cell cycle or interact with cell death pathways and activate TGFβ that maintains the anti-inflammatory environment. Our findings on cell homeostasis at 12 weeks differs from those of You et al. who found that an injection of IL-1β into the mouse LG causes massive cell death that is repaired by activation of LG progenitor cells and EMT (You et al., 2012). In the present study the small increase in IL-1 β at 4 weeks is probably not adequate to cause cell death. Once cytokines are elevated at 12 and 24 weeks, they could cause an additional effect on epithelial/ myoepithelial cell survival and function of stem/progenitor cells that have already been disrupted by the lack of TSP1−/−.
We previously demonstrated that in a normal, uninjured rat LG, progenitor cell markers are expressed in the LGs and that this expression overlapped with the expression of a myoepithelial cell marker, αSMA. We now extend these findings to the mouse LG. We found that the progenitor cell markers ABCG2, Musashi 1, Sox 2, nestin, Pax 6, CHX 10, and ΔpN63 are expressed in the LGs of 4, 12, and 24 week-old WT and TSP1−/− mice. As seen with rat LGs, these markers co-localized substantially with αSMA at all ages in WT and TSP1−/− mice.
Factors that regulate cell size are complex and varied and include many extracellular signals as well as the stage of the cell cycle and whether the cell is undergoing apoptosis. Olerud et al. have shown that β cells of the pancreas in TSP1−/− mice have a larger mass than of β cells in WT mice, while Kong et al. demonstrated that TSP1 had no effect the size of adipocytes (Kong et al., 2013; Olerud et al., 2011). In the LG, the size of acini in 12 and 24 week old TSP1−/− mice were significantly smaller than acini from WT mice. Thus the effects of TSP1 on cell size appear to be cell type specific.
We conclude that the TSP1 regulates LG cell homeostasis as its absence alters acinar cell architecture, decreases cellular proliferation, increases IL1β, IL6, Th17, and IFNγ expression, alters stem cell transcription factor expression, and alters the transcriptional signature of stem/progenitor cells. We suggest that the function of the TSP1 protein in the LG is to maintain stem/progenitor cell function, and stimulate LG cell proliferation causing an increase in LG growth with increasing age. In the absence of TSP1, the function of epithelial/myoepithelial stem/progenitor cells is impaired which impacts LG regeneration, and results in loss of LG function. Future studies are needed to determine if there are functional changes in the myoepithelial cells themselves and which types of cells, acinar, ductal or myoepithelial, function as progenitor cells for the LG.
Supplementary Material
Acknowledgments
This work was supported by NIH EYR01006177 and R01EY020992 to DAD, EYO26202 to HPM, EY015472 to SM and P30 EY003790 to SERI/MEE.
Appendix A. Supplementary data
Supplementary data related to this article can be found at http://dx.doi.org/10.1016/j.exer.2016.09.011.
References
- Adams H, Liebisch P, Schmid P, Dirnhofer S, Tzankov A. Diagnostic utility of the B-cell lineage markers CD20, CD79a, PAX5, and CD19 in paraffin-embedded tissues from lymphoid neoplasms. Appl Immunohistochem Mol Morphol AIMM/official Publ Soc Appl Immunohistochem. 2009;17:96–101. doi: 10.1097/PAI.0b013e3181845ef4. [DOI] [PubMed] [Google Scholar]
- Anderson K, Rusterholz C, Mansson R, Jensen CT, Bacos K, Zandi S, Sasaki Y, Nerlov C, Sigvardsson M, Jacobsen SE. Ectopic expression of PAX5 promotes maintenance of biphenotypic myeloid progenitors coexpressing myeloid and B-cell lineage-associated genes. Blood. 2007;109:3697–3705. doi: 10.1182/blood-2006-05-026021. [DOI] [PubMed] [Google Scholar]
- Andre F, Arnedos M, Goubar A, Ghouadni A, Delaloge S. Ki67–no evidence for its use in node-positive breast cancer. Nat Rev Clin Oncol. 2015;12:296–301. doi: 10.1038/nrclinonc.2015.46. [DOI] [PubMed] [Google Scholar]
- Ang RT, Dartt DA, Tsubota K. Dry eye after refractive surgery. Curr Opin Ophthalmol. 2001;12:318–322. doi: 10.1097/00055735-200108000-00013. [DOI] [PubMed] [Google Scholar]
- Arany S, Catalan MA, Roztocil E, Ovitt CE. Ascl3 knockout and cell ablation models reveal complexity of salivary gland maintenance and regeneration. Dev Biol. 2011;353:186–193. doi: 10.1016/j.ydbio.2011.02.025. [DOI] [PMC free article] [PubMed] [Google Scholar]
- Batista TM, Tomiyoshi LM, Dias AC, Roma LP, Modulo CM, Malki LT, Filho EB, Deminice R, Jordao AA, Jr, Cunha DA, Rocha EM. Age-dependent changes in rat lacrimal gland anti-oxidant and vesicular related protein expression profiles. Mol Vis. 2012;18:194–202. [PMC free article] [PubMed] [Google Scholar]
- Blasco MA. Telomere length, stem cells and aging. Nat Chem Biol. 2007;3:640–649. doi: 10.1038/nchembio.2007.38. [DOI] [PubMed] [Google Scholar]
- Boumahdi S, Driessens G, Lapouge G, Rorive S, Nassar D, Le Mercier M, Delatte B, Caauwe A, Lenglez S, Nkusi E, Brohee S, Salmon I, Dubois C, del Marmol V, Fuks F, Beck B, Blanpain C. SOX2 controls tumour initiation and cancer stem-cell functions in squamous-cell carcinoma. Nature. 2014;511:246–250. doi: 10.1038/nature13305. [DOI] [PubMed] [Google Scholar]
- Burford-Mason AP, Cummins MM, Brown DH, MacKay AJ, Dardick I. Immunohistochemical analysis of the proliferative capacity of duct and acinar cells during ligation-induced atrophy and subsequent regeneration of rat parotid gland. J Oral Pathol Med. 1993;22:440–446. doi: 10.1111/j.1600-0714.1993.tb00122.x. [DOI] [PubMed] [Google Scholar]
- Chakrabarti R, Wei Y, Hwang J, Hang X, Andres Blanco M, Choudhury A, Tiede B, Romano RA, DeCoste C, Mercatali L, Ibrahim T, Amadori D, Kannan N, Eaves CJ, Sinha S, Kang Y. DeltaNp63 promotes stem cell activity in mammary gland development and basal-like breast cancer by enhancing Fzd7 expression and Wnt signalling. Nat Cell Biol. 2014;16:1004–1015. doi: 10.1038/ncb3040. [DOI] [PMC free article] [PubMed] [Google Scholar]
- Chen Z, Huang J, Liu Y, Dattilo LK, Huh SH, Ornitz D, Beebe DC. FGF signaling activates a Sox9–Sox10 pathway for the formation and branching morphogenesis of mouse ocular glands. Development. 2014;141:2691–2701. doi: 10.1242/dev.108944. [DOI] [PMC free article] [PubMed] [Google Scholar]
- Chuong CM, Bhat R, Widelitz RB, Bissell MJ. SnapShot: branching morphogenesis. Cell. 2014;158:1212–1212. e1211. doi: 10.1016/j.cell.2014.08.019. [DOI] [PMC free article] [PubMed] [Google Scholar]
- Contreras-Ruiz L, Regenfuss B, Mir FA, Kearns J, Masli S. Conjunctival inflammation in thrombospondin-1 deficient mouse model of Sjogren’s syndrome. PloS one. 2013;8:e75937. doi: 10.1371/journal.pone.0075937. [DOI] [PMC free article] [PubMed] [Google Scholar]
- Contreras-Ruiz L, Ryan DS, Sia RK, Bower KS, Dartt DA, Masli S. Polymorphism in THBS1 gene is associated with post-refractive surgery chronic ocular surface inflammation. Ophthalmology. 2014;121:1389–1397. doi: 10.1016/j.ophtha.2014.01.033. [DOI] [PMC free article] [PubMed] [Google Scholar]
- Cotta CV, Zhang Z, Kim HG, Klug CA. Pax5 determines B- versus T-cell fate and does not block early myeloid-lineage development. Blood. 2003;101:4342–4346. doi: 10.1182/blood-2002-10-3139. [DOI] [PubMed] [Google Scholar]
- Dartt DA. Neural regulation of lacrimal gland secretory processes: relevance in dry eye diseases. Prog Retin Eye Res. 2009;28:155–177. doi: 10.1016/j.preteyeres.2009.04.003. [DOI] [PMC free article] [PubMed] [Google Scholar]
- Farnoodian M, Kinter JB, Yadranji Aghdam S, Zaitoun I, Sorenson CM, Sheibani N. Expression of pigment epithelium-derived factor and thrombospondin-1 regulate proliferation and migration of retinal pigment epithelial cells. Physiol Rep. 2015;3 doi: 10.14814/phy2.12266. [DOI] [PMC free article] [PubMed] [Google Scholar]
- Garcia-Lavandeira M, Saez C, Diaz-Rodriguez E, Perez-Romero S, Senra A, Dieguez C, Japon MA, Alvarez CV. Craniopharyngiomas express embryonic stem cell markers (SOX2, OCT4, KLF4, and SOX9) as pituitary stem cells but do not coexpress RET/GFRA3 receptors. J Clin Endocrinol Metabol. 2012;97:E80–E87. doi: 10.1210/jc.2011-2187. [DOI] [PubMed] [Google Scholar]
- Guillot C, Lecuit T. Mechanics of epithelial tissue homeostasis and morphogenesis. Science. 2013;340:1185–1189. doi: 10.1126/science.1235249. [DOI] [PubMed] [Google Scholar]
- Guma M, Firestein GS. c-Jun N-Terminal kinase in inflammation and rheumatic diseases. open Rheumatol J. 2012;6:220–231. doi: 10.2174/1874312901206010220. [DOI] [PMC free article] [PubMed] [Google Scholar]
- Hassiotou F, Hepworth AR, Beltran AS, Mathews MM, Stuebe AM, Hartmann PE, Filgueira L, Blancafort P. Expression of the pluripotency transcription factor OCT4 in the normal and aberrant mammary gland. Front Oncol. 2013;3:79. doi: 10.3389/fonc.2013.00079. [DOI] [PMC free article] [PubMed] [Google Scholar]
- He G, Tavella S, Hanley KP, Self M, Oliver G, Grifone R, Hanley N, Ward C, Bobola N. Inactivation of Six2 in mouse identifies a novel genetic mechanism controlling development and growth of the cranial base. Dev Biol. 2010;344:720–730. doi: 10.1016/j.ydbio.2010.05.509. [DOI] [PubMed] [Google Scholar]
- Holmberg KV, Hoffman MP. Anatomy, biogenesis and regeneration of salivary glands. Monogr Oral Sci. 2014;24:1–13. doi: 10.1159/000358776. [DOI] [PMC free article] [PubMed] [Google Scholar]
- Kaur S, Soto-Pantoja DR, Stein EV, Liu C, Elkahloun AG, Pendrak ML, Nicolae A, Singh SP, Nie Z, Levens D, Isenberg JS, Roberts DD. Thrombospondin-1 signaling through CD47 inhibits self-renewal by regulating c-Myc and other stem cell transcription factors. Sci Rep. 2013;3:1673. doi: 10.1038/srep01673. [DOI] [PMC free article] [PubMed] [Google Scholar]
- Kong P, Gonzalez-Quesada C, Li N, Cavalera M, Lee DW, Frangogiannis NG. Thrombospondin-1 regulates adiposity and metabolic dysfunction in diet-induced obesity enhancing adipose inflammation and stimulating adipocyte proliferation. Am J Physiol Endocrinol Metab. 2013;305:E439–E450. doi: 10.1152/ajpendo.00006.2013. [DOI] [PMC free article] [PubMed] [Google Scholar]
- Li D, Chen D, Zhang X, Wang H, Song Z, Xu W, He Y, Yin Y, Cao J. c-Jun N-terminal kinase and Akt signalling pathways regulating tumour necrosis factor-alpha-induced interleukin-32 expression in human lung fibroblasts: implications in airway inflammation. Immunology. 2015;144:282–290. doi: 10.1111/imm.12374. [DOI] [PMC free article] [PubMed] [Google Scholar]
- Lopez-Dee Z, Pidcock K, Gutierrez LS. Thrombospondin-1: multiple paths to inflammation. Mediat Inflamm. 2011;2011:296069. doi: 10.1155/2011/296069. [DOI] [PMC free article] [PubMed] [Google Scholar]
- Makarenkova HP, Ito M, Govindarajan V, Faber SC, Sun L, McMahon G, Overbeek PA, Lang RA. FGF10 is an inducer and Pax6 a competence factor for lacrimal gland development. Development. 2000;127:2563–2572. doi: 10.1242/dev.127.12.2563. [DOI] [PubMed] [Google Scholar]
- Mantelli F, Massaro-Giordano M, Macchi I, Lambiase A, Bonini S. The cellular mechanisms of dry eye: from pathogenesis to treatment. J Cell Physiol. 2013;228:2253–2256. doi: 10.1002/jcp.24398. [DOI] [PubMed] [Google Scholar]
- Mariappan I, Kacham S, Purushotham J, Maddileti S, Siamwala J, Sangwan VS. Spatial distribution of niche and stem cells in ex vivo human limbal cultures. Stem Cells Transl Med. 2014;3:1331–1341. doi: 10.5966/sctm.2014-0120. [DOI] [PMC free article] [PubMed] [Google Scholar]
- Masli S, Sheibani N, Cursiefen C, Zieske J. Matricellular protein thrombospondins: influence on ocular angiogenesis, wound healing and immunoregulation. Curr Eye Res. 2014;39:759–774. doi: 10.3109/02713683.2013.877936. [DOI] [PMC free article] [PubMed] [Google Scholar]
- Matsuda Y, Kure S, Ishiwata T. Nestin and other putative cancer stem cell markers in pancreatic cancer. Med Mol Morphol. 2012;45:59–65. doi: 10.1007/s00795-012-0571-x. [DOI] [PubMed] [Google Scholar]
- McMahon C, Gestri G, Wilson SW, Link BA. Lmx1b is essential for survival of periocular mesenchymal cells and influences Fgf-mediated retinal patterning in zebrafish. Dev Biol. 2009;332:287–298. doi: 10.1016/j.ydbio.2009.05.577. [DOI] [PMC free article] [PubMed] [Google Scholar]
- Migliorini A, Bader E, Lickert H. Islet cell plasticity and regeneration. Mol Metab. 2014;3:268–274. doi: 10.1016/j.molmet.2014.01.010. [DOI] [PMC free article] [PubMed] [Google Scholar]
- Nagai K, Arai H, Okudera M, Yamamura T, Oki H, Komiyama K. Epiregulin is critical for the acinar cell regeneration of the submandibular gland in a mouse duct ligation model. J Oral Pathol Med. 2014;43:378–387. doi: 10.1111/jop.12145. [DOI] [PubMed] [Google Scholar]
- Niu Q, Wang W, Li Y, Ruden DM, Li Q, Wang F. Cisplatin in 5% ethanol eradicates cisplatin-resistant lung tumor by killing lung Cancer side population (SP) cells and non-SP cells. Front Genet. 2013;4:163. doi: 10.3389/fgene.2013.00163. [DOI] [PMC free article] [PubMed] [Google Scholar]
- Ohtomo K, Shatos MA, Vrouvlianis J, Li D, Hodges RR, Dartt DA. Increase of intracellular Ca2+ by purinergic receptors in cultured rat lacrimal gland myoepithelial cells. Invest Ophthalmol Vis Sci. 2011;52:9503–9515. doi: 10.1167/iovs.11-7809. [DOI] [PMC free article] [PubMed] [Google Scholar]
- Olerud J, Mokhtari D, Johansson M, Christoffersson G, Lawler J, Welsh N, Carlsson PO. Thrombospondin-1: an islet endothelial cell signal of importance for beta-cell function. Diabetes. 2011;60:1946–1954. doi: 10.2337/db10-0277. [DOI] [PMC free article] [PubMed] [Google Scholar]
- Qu B, Xin GR, Zhao LX, Xing H, Lian LY, Jiang HY, Tong JZ, Wang BB, Jin SZ. Testing stem cell therapy in a rat model of inflammatory bowel disease: role of bone marrow stem cells and stem cell factor in mucosal regeneration. PLoS One. 2014;9:e107891. doi: 10.1371/journal.pone.0107891. [DOI] [PMC free article] [PubMed] [Google Scholar]
- Reksten TR, Jonsson MV. Sjogren’s syndrome: an update on epidemiology and current insights on pathophysiology. Oral Maxillofac Surg Clin North Am. 2014;26:1–12. doi: 10.1016/j.coms.2013.09.002. [DOI] [PubMed] [Google Scholar]
- Resovi A, Pinessi D, Chiorino G, Taraboletti G. Current understanding of the thrombospondin-1 interactome. Matrix Biol. 2014;37C:83–91. doi: 10.1016/j.matbio.2014.01.012. [DOI] [PubMed] [Google Scholar]
- Rios JD, Horikawa Y, Chen LL, Kublin CL, Hodges RR, Dartt DA, Zoukhri D. Age-dependent alterations in mouse exorbital lacrimal gland structure, innervation and secretory response. Exp Eye Res. 2005;80:477–491. doi: 10.1016/j.exer.2004.10.012. [DOI] [PMC free article] [PubMed] [Google Scholar]
- Rocha EM, Alves M, Rios JD, Dartt DA. The aging lacrimal gland: changes in structure and function. Ocul Surf. 2008;6:162–174. doi: 10.1016/s1542-0124(12)70177-5. [DOI] [PMC free article] [PubMed] [Google Scholar]
- Samardzija C, Quinn M, Findlay JK, Ahmed N. Attributes of Oct4 in stem cell biology: perspectives on cancer stem cells of the ovary. J Ovar Res. 2012;5:37. doi: 10.1186/1757-2215-5-37. [DOI] [PMC free article] [PubMed] [Google Scholar]
- Schindelin J, Arganda-Carreras I, Frise E, Kaynig V, Longair M, Pietzsch T, Preibisch S, Rueden C, Saalfeld S, Schmid B, Tinevez JY, White DJ, Hartenstein V, Eliceiri K, Tomancak P, Cardona A. Fiji: an open-source platform for biological-image analysis. Nat Methods. 2012;9:676–682. doi: 10.1038/nmeth.2019. [DOI] [PMC free article] [PubMed] [Google Scholar]
- Shatos MA, Haugaard-Kedstrom L, Hodges RR, Dartt DA. Isolation and characterization of progenitor cells in uninjured, adult rat lacrimal gland. Invest Ophthalmol Vis Sci. 2012a;53:2749–2759. doi: 10.1167/iovs.11-9025. [DOI] [PMC free article] [PubMed] [Google Scholar]
- Shatos MA, Haugaard-Kedstrom L, Hodges RR, Dartt DA. Isolation and characterization of progenitor cells in uninjured, adult rat lacrimal gland. Investig Ophthalmol Vis Sci. 2012b;53:2749–2759. doi: 10.1167/iovs.11-9025. [DOI] [PMC free article] [PubMed] [Google Scholar]
- Stasi K, Goings D, Huang J, Herman L, Pinto F, Addis RC, Klein D, Massaro-Giordano G, Gearhart JD. Optimal isolation and xeno-free culture conditions for limbal stem cell function. Invest Ophthalmol Vis Sci. 2014;55:375–386. doi: 10.1167/iovs.13-12517. [DOI] [PMC free article] [PubMed] [Google Scholar]
- Stevenson W, Chen Y, Lee SM, Lee HS, Hua J, Dohlman T, Shiang T, Dana R. Extraorbital lacrimal gland excision: a reproducible model of severe aqueous tear-deficient dry eye disease. Cornea. 2014;33:1336–1341. doi: 10.1097/ICO.0000000000000264. [DOI] [PubMed] [Google Scholar]
- Turpie B, Yoshimura T, Gulati A, Rios JD, Dartt DA, Masli S. Sjogren’s syndrome-like ocular surface disease in thrombospondin-1 deficient mice. Am J Pathol. 2009;175:1136–1147. doi: 10.2353/ajpath.2009.081058. [DOI] [PMC free article] [PubMed] [Google Scholar]
- Voronov D, Gromova A, Liu D, Zoukhri D, Medvinsky A, Meech R, Makarenkova HP. Transcription factors Runx1 to 3 are expressed in the lacrimal gland epithelium and are involved in regulation of gland morphogenesis and regeneration. Investig Ophthalmol Vis Sci. 2013;54:3115–3125. doi: 10.1167/iovs.13-11791. [DOI] [PMC free article] [PubMed] [Google Scholar]
- Wang X, Liu Q, Hou B, Zhang W, Yan M, Jia H, Li H, Yan D, Zheng F, Ding W, Yi C, Hai W. Concomitant targeting of multiple key transcription factors effectively disrupts cancer stem cells enriched in side population of human pancreatic cancer cells. PLoS One. 2013;8:e73942. doi: 10.1371/journal.pone.0073942. [DOI] [PMC free article] [PubMed] [Google Scholar]
- Wei F, Li M, Cheng SY, Wen L, Liu MH, Shuai J. Cloning, expression, and functional characterization of the rat Pax6 5a orthologous splicing variant. Gene. 2014;547:169–174. doi: 10.1016/j.gene.2014.06.032. [DOI] [PubMed] [Google Scholar]
- Xu H, Sta Iglesia DD, Kielczewski JL, Valenta DF, Pease ME, Zack DJ, Quigley HA. Characteristics of progenitor cells derived from adult ciliary body in mouse, rat, and human eyes. Invest Ophthalmol Vis Sci. 2007;48:1674–1682. doi: 10.1167/iovs.06-1034. [DOI] [PubMed] [Google Scholar]
- You S, Avidan O, Tariq A, Ahluwalia I, Stark PC, Kublin CL, Zoukhri D. Role of epithelial-mesenchymal transition in repair of the lacrimal gland after experimentally induced injury. Invest Ophthalmol Vis Sci. 2012;53:126–135. doi: 10.1167/iovs.11-7893. [DOI] [PMC free article] [PubMed] [Google Scholar]
- Zoukhri D, Macari E, Kublin CL. A single injection of interleukin-1 induces reversible aqueous-tear deficiency, lacrimal gland inflammation, and acinar and ductal cell proliferation. Exp Eye Res. 2007;84:894–904. doi: 10.1016/j.exer.2007.01.015. [DOI] [PMC free article] [PubMed] [Google Scholar]
Associated Data
This section collects any data citations, data availability statements, or supplementary materials included in this article.


