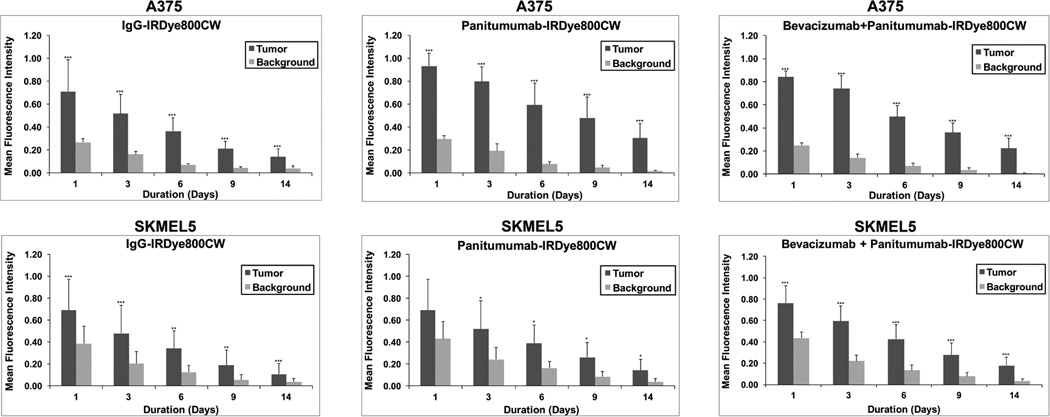
Figure 3.
Graphical representation of fluorescence within the mouse ear melanoma xenografts (A375 and SKMEL5) on days 3, 6, 9, and 12 via imaging with the Pearl device. Column, mean for treatment group (n=5); bars, standard deviation. Statistical significance by unpaired t-test, *p<0.05, **p<0.01, ***p<0.001.

