

Abstract
Fabry disease is an X-linked genetic disorder characterized by deficient activity of α-galactosidase A (GLA) and accumulation of glycolipids, and various GLA gene mutations lead to a wide range of clinical phenotypes from the classic form to the later-onset one. To investigate the biochemical heterogeneity and elucidate the basis of the disease using available clinical samples, we measured GLA activity, GLA protein and accumulated globotriaosylsphingosine (Lyso-Gb3), a biomarker of this disease, in plasma samples from Fabry patients. The analysis revealed that both the enzyme activity and the protein level were apparently decreased, and the enzyme activity was well correlated with the protein level in many Fabry patients. In these cases, a defect of biosynthesis or excessive degradation of mutant GLAs should be involved in the pathogenesis, and the residual protein level would determine the accumulation of Lyso-Gb3 and the severity of the disease. However, there are some exceptional cases, i.e., ones harboring p.C142Y, p.R112H and p.M296I, who exhibit a considerable amount of GLA protein. Especially, a subset of Fabry patients with p.R112H or p.M296I has been attracted interest because the patients exhibit almost normal plasma Lyso-Gb3 concentration. Structural analysis revealed that C142Y causes a structural change at the entrance of the active site. It will lead to a complete enzyme activity deficiency, resulting in a high level of plasma Lyso-Gb3 and the classic Fabry disease. On the other hand, it is thought that R112H causes a relatively large structural change on the molecular surface, and M296I a small one in a restricted region from the core to the surface, both the structural changes being far from the active site. These changes will cause not only partial degradation but also degeneration of the mutant GLA proteins, and the degenerated enzymes exhibiting small and residual activity remain and probably facilitate degradation of Lyso-Gb3 in plasma, leading to the later-onset phenotype. The results of this comprehensive analysis will be useful for elucidation of the basis of Fabry disease.
Keywords: Fabry disease, α-Galactosidase A, Globotriaosylsphingosine, Structural modeling
1. Introduction
Fabry disease (MIM 301500) is an X-linked genetic disease caused by deficient activity of α-galactosidase A (GLA) [1], [2]. The lack of enzyme activity results in progressive accumulation of neutral glycolipids including globotriaosylceramide (Gb3) and globatriaosylsphingosine (Lyso-Gb3) in lysosomes of cells and body fluids. The disease is basically divided into two clinical phenotypes, the classic type and the later-onset one [3]. Affected males with the classic form usually exhibit little or no GLA activity, and acroparesthesias, angiokeratomas, hypohidrosis, and corneal opacities in childhood or adolescence. With advancing age, the occurrence of renal disorders, cardiac disease, and stroke leads to premature death in adulthood. On the other hand, affected males with the later-onset type, who have residual GLA activity, develop renal and/or cardiac disorders in adulthood without the childhood symptoms. The clinical manifestations in heterozygous Fabry females range from asymptomatic to severe due to random X-chromosomal inactivation [4]. Up to now, over 600 gene mutations on the GLA gene have been identified (http://fabry-database.org/) and it is thought that such genetic heterogeneity reflects the clinical and biochemical diversity of Fabry disease.
Since enzyme replacement therapy (ERT) is now available, many Fabry patients have been successfully treated with recombinant GLAs, if the treatment is started early [5], [6]. However, recent outcome survey analysis revealed that ERT is less efficacious when started after the disease has progressed to such as the occurrence of tissue fibrosis [7]. Considering the requirement of early therapy, neonatal and high-risk screening has been widely performed for an early diagnosis [8], [9], [10], [11], and it has become more and more important to elucidate the basis of Fabry disease and to identify parameters influencing the disease progression.
In this study, we measured GLA activity, GLA protein and Lyso-Gb3 in plasma samples from Fabry patients with various phenotypes and gene mutations, and examined the relation between them for an insight into the basis of the disease. Furthermore, we focussed on a subset of Fabry patients harboring p.R112H or p.M296I, because it has been reported that the plasma Lyso-Gb3 level in this group does not increase, the biochemical findings being different from other Fabry cases [12], [13], [14]. We tried to elucidate the pathogenesis of the specific cases.
2. Materials and methods
2.1. Patients and samples
Plasma samples for measurement of the enzyme activity and protein concentration of GLA, and the Lyso-Gb3 concentration were obtained from 8 classic Fabry males, 12 later-onset Fabry males, 18 heterozygous Fabry females, and 30 healthy volunteers. The ages of the patients and their genotypes are summarized in Table 1. This study involving human samples was approved by the Ethics Committees of Meiji Pharmaceutical University. All participants and/or their parents provided written informed consent to participation in this study.
Table 1.
Summary of Fabry patients examined and the results of the biochemical analyses.
| Phenotypea | Case no. | Age (y) | Genotype | Referencesb | GLA activity (nmol/h/mL) |
GLA protein (ng/mL) |
Lyso-Gb3 (nmol/L) |
|---|---|---|---|---|---|---|---|
| Classic Fabry male | 1 | 44 | IVS3-1G > A | [35] | 0.6 | 0.00 | 103 |
| 2 | 46 | p.E66Q + p.I354K | [36] | 1.6 | 0.00 | 71 | |
| 3 | 32 | c.1033_1034delTC | [37] | 0.6 | 0.00 | 84 | |
| 4 | 43 | p.R112C | [38] | 0.8 | 0.01 | 62 | |
| 5 | 11 | c.85delG | – | 0.6 | 0.01 | 36 | |
| 6 | 23 | p.G147E | – | 0.4 | 0.02 | 91 | |
| 7 | 71 | p.I253T | – | 0.8 | 0.03 | 22 | |
| 8 | 5 | p.C142Y | [34] | 0.4 | 0.33 | 44 | |
| Later-onset Fabry male | 9 | 62 | p.R301Q | [39] | 1.0 | 0.08 | 15 |
| 10 | 28 | p.M96I | – | 1.0 | 0.14 | 10 | |
| 11 | 60 | p.N215S | [40] | 1.0 | 0.16 | 4 | |
| 12 | NA | p.Q279E | [41] | 1.4 | 0.16 | NA | |
| 13 | NA | IVS4 + 919G > A | [42] | 1.4 | 0.23 | 18 | |
| 14 | NA | IVS4 + 919G > A | [42] | 1.2 | 0.24 | 10 | |
| 15 | NA | p.A20P | [43] | 1.6 | 0.24 | 3 | |
| 16 | 14 | p.R112H | [44] | 1.2 | 1.26 | 5 | |
| 17 | 61 | p.M296I | [14] | 3.0 | 1.43 | < 2 | |
| 18 | 45 | p.R112H | [44] | 1.4 | 1.54 | < 2 | |
| 19 | 11 | p.M296I | [14] | 1.2 | 2.05 | < 2 | |
| 20 | 54 | p.M296I | [14] | 1.6 | 3.71 | < 2 | |
| Heterozygous Fabry female | 21 | 59 | p.R227X/WT | [40] | 2.4 | 0.46 | 12 |
| 22 | 36 | p.M96I/WT | – | 0.6 | 0.62 | 21 | |
| 23 | 34 | p.M42V/WT | [45] | 4.4 | 0.63 | 7 | |
| 24 | 58 | p.M96I/WT | – | 2.6 | 0.81 | 4 | |
| 25 | 63 | p.M96I/WT | – | 3.8 | 1.12 | 9 | |
| 26 | 28 | p.W245X/WT | [46] | 4.8 | 1.12 | 6 | |
| 27 | 56 | p.P210L/WT | – | 6.4 | 1.42 | 3 | |
| 28 | 57 | p.W245X/WT | – | 3.0 | 1.57 | 11 | |
| 29 | 17 | p.I242T/WT | – | 4.6 | 1.67 | < 2 | |
| 30 | 49 | p.R112H/WT | [44] | 4.0 | 1.72 | < 2 | |
| 31 | 31 | p.M296I/WT | [14] | 6.8 | 1.77 | < 2 | |
| 32 | 41 | p.P210S/WT | – | 6.8 | 1.99 | < 2 | |
| 33 | 17 | p.G43V/WT | [46] | 5.8 | 2.05 | 2 | |
| 34 | 67 | p.R112H/WT | [44] | 5.0 | 2.59 | < 2 | |
| 35 | 70 | p.M296I/WT | [14] | 3.2 | 2.86 | < 2 | |
| 36 | 41 | p.W47R/WT | – | 2.6 | 3.15 | 10 | |
| 37 | 33 | p.M296I/WT | [14] | 5.6 | 3.34 | < 2 | |
| 38 | 31 | p.M296I/WT | [14] | 4.6 | 3.49 | < 2 | |
| Controlc | – | – | WT | 7.1 ± 1.9 (30) | 3.46 ± 1.04 (30) | < 2 (30) |
NA: not available.
The phenotypic classification of each case was performed on the basis of clinical manifestations, the results of family studies and gene analysis.
References reporting the Fabry cases examined or information about the gene mutations.
Data are basically expressed as means ± SD (n).
2.2. Measurement of plasma GLA activity
GLA activity in plasma was fluorometrically measured using 4-methylumbelliferyl-α-d-galactopyranoside (Calbiochem, La Jolla, CA) as a substrate and N-acetyl-d-galactosamine (Sigma, St. Louis, MO) as an inhibitor of α-N-acetylgalactosaminidase (α-galactosidase B) with a Wallac 1420 ARVO MX multilabel counter (Parkin Elmer, Waltham, MA), at excitation and emission wave lengths of 355 nm and 460 nm, respectively [15].
2.3. Measurement of plasma GLA concentrations
Measurement of GLA protein levels in plasma was performed by means of the immuno-polymerase chain reaction (PCR) assay method (designated as MUSTag for Multiple Simultaneous Tag), as described previously [16]. Briefly, the monoclonal anti-GLA capture antibody was conjugated to Tosyl-activated Dynabeads M-280 (Invitrogen Dynal AS, Oslo, Norway) according to the manufacturer's protocol. The assay mixture including the anti-GLA capture antibody-conjugated magnetic beads and the oligo-DNA-labeled anti-GLA detection antibody in assay buffer (0.05% Tween-20, 0.45 M NaCl, 50 mM sodium phosphate, pH 7.4, and 10% goat serum) was mixed with the plasma samples in a 96-well plate for 2 h at room temperature with shaking. After the immune reaction, the beads were captured for 3 min with a 96-well Magnetic-Ring Stand (Applied Biosystems, Foster City, CA) and then washed 4 times with 200 μL/well of wash buffer (0.05% Tween-20, 0.5 M NaCl, and 20 mM Tris–HCl, pH 7.4). Then, the bound DNA was released by adding 30 μL of an EcoRI solution (10 U/mL) to each well. The released DNA was measured by means of quantitative real-time PCR to amplify and detect the oligonucleotides that were used for labeling the detection antibody. Standard curves were calculated from the results of measurement of recombinant GLA (agalsidase beta; Fabrazyme®, Genzyme, Cambridge, MA) diluted in plasma.
2.4. Measurement of plasma Lyso-Gb3 concentrations
Plasma Lyso-Gb3 was measured according to the method described previously [17]. Briefly, Lyso-Gb3 in plasma was extracted by means of Aerts's method [12]. Then, the extracted Lyso-Gb3 was derivatized with o- phthalaldehyde (OPA). Then, the OPA-derivatized Lyso-Gb3 was separated by high performance liquid chromatography (HPLC), followed by fluorometric quantification. Chromatographic separation was performed on a Unison UK-C18 column (75 × 4.6 mm; Imtakt, Kyoto, Japan) with a mobile phase of methanol/water (85/15, v/v). A calibration curve for Lyso-Gb3 was prepared by the addition of authentic Lyso-Gb3 (Sigma) to plasma.
2.5. Statistical analysis
Student's t test was performed using Excel 2013 (Microsoft, Redmond, WA) to determine the difference between the classic and later-onset groups. Data are expressed as means ± standard deviation (SD) (number of trials). It was taken that there was a significant difference if p < 0.05. To examine the distribution of the cases in each group, dot plot analysis (http://onlinestabook.com/2/graphing-distribution/boxplot.html) was performed.
2.6. Structural analysis of mutant GLAs
For characterization of the amino acid substitutions (C142Y, R112H and M296I) that lead to a considerable amount of GLA protein in plasma despite the lack or a decrease of the enzyme activity, structural analysis was performed.
The solvent-accessible surface area (ASA) value for each amino acid in the wild type GLA was calculated using ACCESS [18] to determine the locations of amino acid residues substituted in the GLA molecule.
Then, structural models of the mutant GLAs were built using TINKER (http://dasher.wustl.edu/tinker/) [19], [20], [21], [22], [23]. As a template, the crystal structure of human GLA (PDB: 1R46) [24] was used, and energy minimization was performed. The root-mean-square gradient value was set at 0.05 kcal/mol ∙ Å. To determine the influence of the amino acid substitutions on the GLA structure, each mutant model was superimposed on the wild type GLA structure based on the Cα atoms, and it was defined that the structure was influenced by an amino acid substitution when the position of an atom in a mutant differed from that in the wild type structure by more than the cut-off distance (0.15 Å) based on the total root-meant-square distance (RMSD). We calculated the numbers of affected atoms in the main chain, side chain and active site (D170 and D231).
The RMSD values of all atoms in the mutant GLA structures were determined by Weiner's method to predict the severity of the structural changes, as described previously [25], [26], [27], [28], [29].
Then, coloring of the affected atoms in the three-dimensional structure of GLA was performed as to the distance between the wild type and mutants to determine the influence of the amino acid substitutions geographically and semi-quantitatively [30].
3. Results
3.1. Plasma GLA activity
The plasma GLA activity of the individual case examined in this study is shown in Table 1, and the mean values in the different groups were calculated. The results revealed that the average GLA activity levels in the classic Fabry males, later-onset Fabry males, heterozygous Fabry females, and normal subjects were 0.7 ± 0.4 nmol/h/mL (n = 8), 1.4 ± 0.5 nmol/h/mL (n = 12), 4.3 ± 1.7 nmol/h/mL (n = 18), and 7.1 ± 1.9 nmol/h/mL (n = 30), respectively. Both the classic and later-onset Fabry males exhibited apparently lower GLA activity than the normal subjects, the average value for the classic group being lower (p < 0.05) than that for the later-onset group. Heterozygous Fabry females showed a wide range of GLA activity, the average value being about half of the normal control mean.
3.2. GLA protein concentrations
The plasma GLA protein concentration in the individual case is shown in Table 1, and Fig. 1 summarizes the results of the GLA protein assay. The average plasma GLA levels in the classic Fabry males, later-onset Fabry males, heterozygous Fabry females, and normal subjects were 0.05 ± 0.11 ng/mL (n = 8), 0.93 ± 1.12 ng/mL (n = 12), 1.80 ± 0.96 ng/mL (n = 18), and 3.46 ± 1.04 ng/mL (n = 30), respectively. Most of the Fabry males exhibited lower values than those in the control subjects, the average value for the classic group being lower than that for the later-onset group (p < 0.05). The Fabry heterozygous females exhibited a wide range of GLA protein concentrations, the average value being about half of the normal control mean.
Fig. 1.
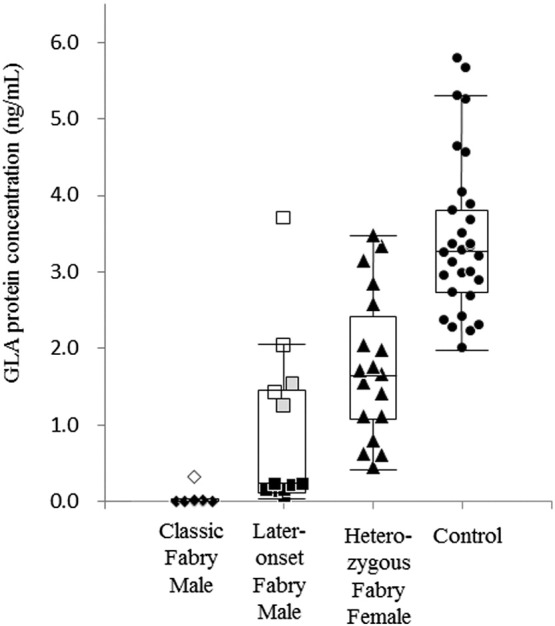
GLA protein concentrations in plasma samples. Classic Fabry males (◆), Later-onset Fabry males (■), Heterozygous Fabry females (▲), Controls (●), Fabry male harboring p.C142Y (◊), Fabry males harboring p.R112H ( ), and Fabry males harboring p.M296I (□). Box plots show the distribution of cases in each group.
The relationship between the plasma GLA activity and protein concentration in Fabry patients was examined, and the results are summarized in Fig. 2. In many cases, the GLA activity was correlated to the GLA protein level. However, there were some exceptional male patients exhibiting a considerable GLA protein level (more than 0.3 ng/mL), although their GLA activity was almost completely deficient or low. They included a classic case harboring p.C142Y and five later-onset cases harboring p.R112H (two cases) or p.M296I (three cases).
Fig. 2.
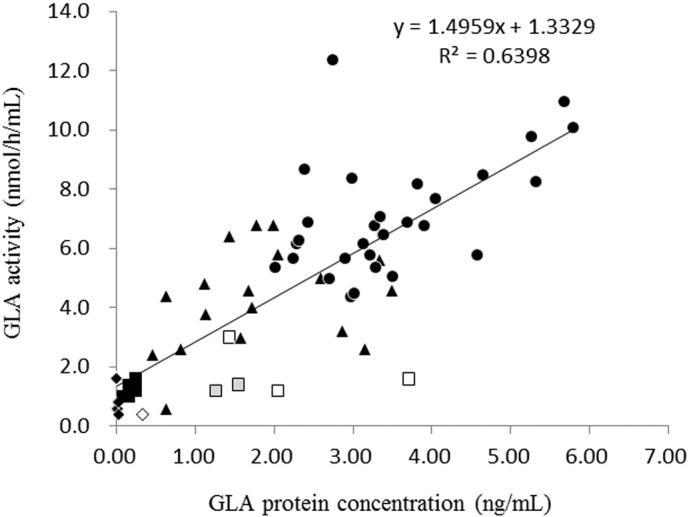
GLA activity versus GLA protein concentration in plasma samples. Classic Fabry males (◆), Later-onset Fabry males (■), Heterozygous Fabry females (▲), Controls ( ), Fabry male harboring p.C142Y (◊), Fabry males harboring p.R112H (
 ), and Fabry males harboring p.M296I (□).
3.3. Plasma Lyso-Gb3 concentrations
The plasma Lyso-Gb3 concentration in the individual case is shown in Table 1, and Fig. 3 summarizes the results of the Lyso-Gb3 assay. Normal control subjects exhibited plasma Lyso-Gb3 levels below the detection level of 2 nmol/L. On the other hand, most Fabry patients exhibited high plasma Lyso-Gb3 concentrations. The average plasma Lyso-Gb3 concentrations in the classic Fabry males, later-onset Fabry males, and heterozygous Fabry females were 64 ± 29 nmol/L (n = 8), 11 ± 17 nmol/L (n = 11), and 5 ± 6 nmol/L (n = 18), respectively. The plasma Lyso-Gb3 level in the later-onset Fabry males was lower than that in the classic Fabry males, and some patients with later-onset Fabry disease harboring p.R112H or p.M296I exhibited values below 2 nmol/L.
Fig. 3.
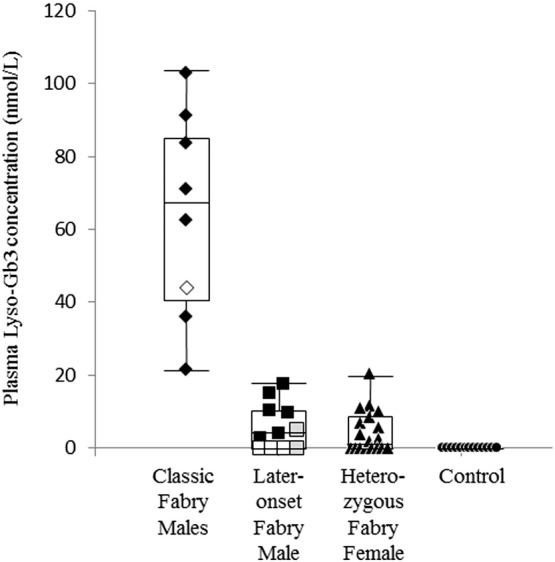
Lyso-Gb3 concentrations in plasma samples. Classic Fabry males (◆), Later-onset Fabry males (■), Heterozygous Fabry females (▲), Controls (●), Fabry male harboring p.C142Y (◊), Fabry males harboring p.R112H (), and Fabry males harboring p.M296I (□). Box plots show the distribution of cases in each group.
3.4. Structural changes of mutant GLAs
Structural analysis was performed for the mutant GLAs in cases exhibiting a considerable plasma GLA protein level (i.e., those with C142Y, R112H, and M296I), and the results of coloring of the affected atoms in the mutant GLAs with these amino acid substitutions are shown in Fig. 4.
Fig. 4.

Coloring of the atoms in the three-dimensional structure of GLA influenced by amino acid substitutions. (A) C142Y, (B) R112H, and (C) M296I. The backbone of GLA is represented as a ribbon model, and the distribution of the influenced atoms in each mutant GLA is shown. The influenced atoms are indicated as small spheres and their colors show the distances between the mutant and wild type ones, as follows: blue < 0.15 Å, 0.15 Å ≤ cyan < 0.30 Å, 0.30 Å ≤ green < 0.45 Å, 0.45 Å ≤ yellow < 0.60 Å, 0.60 Å ≤ orange < 0.75 Å, and red ≥ 0.75 Å. The substituted residues and catalytic residues are presented as a CPK model and blue spheres, respectively.
3.4.1. C142Y
C142 is located near the catalytic residues (D170 and D231) and forms a disulfide bond with C172. The calculation revealed that the ASA value, the RMSD value, and the numbers of atoms affected in the main chain, side chain and active site due to C142Y were 93.1 Å2, 0.046 Å, 18, 25, and 9, respectively. As shown in Fig. 4A, the affected atoms are located near the active site. These results suggest that C142 is exposed and the amino acid substitution of Tyr for Cys at this position causes a moderate structural change on the surface of the molecule that affects the active site.
3.4.2. R112H
R112 is located on the loop between the β-strand (88–90) and the α-helix (116–126) comprising the (β/α)8 barrel structure, the N-terminal domain of GLA, and its side chain has two hydrogen bonds with the backbone oxygen atoms of I64 and C94. The ASA value, RMSD value, and numbers of atoms affected in the main chain, side chain and active site due to R112H were 34.7 Å2, 0.082 Å, 70, 70, and 0, respectively. As shown in Fig. 4B, the affected atoms are located on the surface region around R112. These results suggest that R112 is half-exposed and R112H causes a relatively large structural change on the molecular surface of GLA but does not affect the active site.
3.4.3. M296I
M296 is located on the β-strand (294–296) of the (β/α)8 barrel structure of GLA. Previously, we reported that the M296I amino acid substitution causes a small structural change localized to “the molecular surface” [14]. Recalculation in this study revealed that the ASA value, RMSD value, numbers of atoms affected in the main chain, side chain and active site were 0 Å2, 0.018 Å, 5, 12, and 0, respectively. As shown in Fig. 4C, affected atoms are located both in the core of GLA and on the molecular surface. These results suggest that M296 is buried and M296I causes a small structural change in small restricted region from the core to the surface, and it does not affect the active site.
4. Discussion
To investigate the biochemical heterogeneity of Fabry disease, a comprehensive study on the enzyme responsible for the disease and the accumulated substrates involved in the pathogenesis will be important. In this study, we analyzed the enzyme activity and protein concentration of GLA, and the Lyso-Gb3 level, which has recently been paid attention as a biomarker of this disease [12], [13], [17], [31], [32], in plasma samples from Fabry patients with various GLA gene mutations. There are few reports describing plasma GLA concentration [33], because plasma GLA protein level is low and it is difficult to determine the small amount of GLA proteins in Fabry patients and compare their levels by ordinary enzyme-linked immunosorbent assaying. Recently, we established a high-sensitive immuno-PCR method for measurement of GLA protein [16] and used it in this study. The results of the analysis revealed that both the enzyme activity and GLA protein level were apparently decreased in many patients with Fabry disease, and that the GLA activity was correlated with the protein level in these cases. Considering the mutations that the cases harbored, it is predicted that a biosynthetic defect of GLA (IVS3-1G > A, c.1033_1034delTC, c.85delG, and IVS4 + 919G > A) or a defect of protein folding followed by excessive degradation (p.R112C, p.G147E, p.I253T, p.R301Q, p.M96I, p.N215S, p.Q279E, and p.A20P) is involved in their pathogenesis, and the residual GLA protein level would determine the accumulation of substrates including Lyso-Gb3 and the severity of the disease. However, there are some exceptional cases (i.e., ones harboring p.C142Y, p.R112H or p.M296I) exhibiting a considerable amount of GLA protein despite the lack or a decrease of the enzyme activity.
Therefore, structural analysis of mutant GLAs with these amino acid substitutions was performed. In C142Y, the Tyr residue substituted is thought to prevent a galactose residue of a substrate entering the active site pocket, although the structural change due to C142Y is moderate. Therefore, the mutant GLA with C142Y completely loses the enzyme activity even if the translated GLA protein partially escapes degradation before reaching the lysosomes, which leads to the classic phenotype. Previously, transient expression of GLA cDNA in COS-1 cells was performed, and the results revealed about half the normal level of GLA with C142Y, but the catalytic activity was completely lost [34]. This supports the results of this study. The structural analysis revealed that R112H causes a relatively large structural change on the molecular surface, and M296I a small one in a small restricted region from the core to the surface, both changes being far from the active site. In these cases, not only a folding defect followed by partial degradation but also degeneration of the enzyme would be involved in the pathogenesis of the disease. The degenerated GLA proteins exhibiting small and residual activity remain and probably facilitate the degradation of Lyso-Gb3 in plasma, although it may be not enough for complete cleavage of the substrates in organs, leading to the later-onset phenotype.
In conclusion, we analyzed and assessed the relation between the plasma GLA activity, GLA protein concentration and accumulation of Lyso-Gb3 in Fabry patients with various gene mutations including p.R112H and p.M296I. The results revealed that the mechanisms underlying this disease are heterogeneous and complex, and the information obtained from this comprehensive study will be useful for elucidation of the basis of Fabry disease.
Competing interest
S.N. is employed by Synthera Technologies Co., Ltd.
Financial disclosure
This work was supported by the Program for Research on Intractable Diseases of Health and Labor Science Research (ID: H22-Nanchi-Ippan-002, HS); the Program for the Promotion of Fundamental Studies in Health Sciences of the National Institute of Biomedical Innovation (ID: 09-15, HS); and the Japan Society for the Promotion of Science (ID: 25860399, T. Tsukimura). The funders played no role in the study design, data collection and analysis, decision to publish, or preparation of the manuscript.
Ethics statement
This study involving human samples was approved by the Ethics Committees of Meiji Pharmaceutical University. All participants and/or their parents provided written informed consent to participation in this study.
Author contributions
H.S. conceived and designed the experiments; T. Tsukimura, S.N., T. Tanaka, S.S., and K.O. performed the experiments; T. Tsukimura, S.N., T. Togawa, S.S., K.O., F.S., and H.S. analyzed the date and H.S. wrote the paper.
Contributed reagents/materials/analysis tools
Patent concerning the method for measuring concentration of α-galactosidase A used in this study is as follows. Title: The method for measuring concentration of α-galactosidase A. International publication number: PCT/IB2013/002652. Applicants: Tokyo Metropolitan Institute of Medical Science and Meiji Pharmaceutical University.
Acknowledgments
We thank Dr. J. Ponder (Department of Biochemistry and Molecular Biophysics, Washington University) for providing us with the TINKER software. We also thank Dr. Joan Keutzer (Genzyme, Boston, MA, USA) for providing us with the anti-GLA monoclonal antibodies.
References
- 1.Desnick R.J., Ioannou Y.A., Eng C.M. α-Galactosidase A deficiency: Fabry disease. In: Scriver C.R., Sly W.A., Beaudet A.L., Valle D., editors. The Metabolic and Molecular Bases of Inherited Disease. Eighth ed. McGraw-Hill Inc.; New York: 2001. pp. 3733–3774. [Google Scholar]
- 2.Branton M.H., Schiffmann R., Sabnis S.G., Murray G.J., Quirk J.M., Altarescu G., Goldfarb L., Brady R.O., Balow J.E., Austin H.A., III, Kopp J.B. Natural history of Fabry renal disease: influence of alpha-galactosidase A activity and genetic mutations on clinical course. Medicine. 2002;81:122–138. doi: 10.1097/00005792-200203000-00003. [DOI] [PubMed] [Google Scholar]
- 3.Nance C.S., Klein C.J., Banikazemi M., Dikman S.H., Phelps R.G., McArthur J.C., Rodriguez M., Desnick R.J. Later-onset Fabry disease: an adult variant presenting with the cramp-fasciculation syndrome. Arch. Neurol. 2006;63:453–457. doi: 10.1001/archneur.63.3.453. [DOI] [PubMed] [Google Scholar]
- 4.MacDermot K.D., Holmes A., Miners A.H. Anderson–Fabry disease: clinical manifestations and impact of disease in a cohort of 60 obligate carrier females. J. Med. Genet. 2001;38:769–775. doi: 10.1136/jmg.38.11.769. [DOI] [PMC free article] [PubMed] [Google Scholar]
- 5.Weidemann F., Niemann M., Breunig F., Herrmann S., Beer M., Störk S., Voelker W., Ertl G., Wanner C., Strotmann J. Long-term effects of enzyme replacement therapy on Fabry cardiomyopathy: evidence for a better outcome with early treatment. Circulation. 2009;119:524–529. doi: 10.1161/CIRCULATIONAHA.108.794529. [DOI] [PubMed] [Google Scholar]
- 6.Tøndel C., Bostad L., Larsen K.K., Hirth A., Vikse B.E., Houge G., Svarstad E. Agalsidase benefits renal histology in young patients with Fabry disease. J. Am. Soc. Nephrol. 2013;24:137–148. doi: 10.1681/ASN.2012030316. [DOI] [PMC free article] [PubMed] [Google Scholar]
- 7.Weidemann F., Sanchez-Niño M.D., Politei J., Oliveira J.P., Wanner C., Warnock D.G., Ortiz A. Fibrosis: a key feature of Fabry disease with potential therapeutic implications. Orphanet J. Rare Dis. 2013;8:e116. doi: 10.1186/1750-1172-8-116. [DOI] [PMC free article] [PubMed] [Google Scholar]
- 8.Mechtler T.P., Stary S., Metz T.F., De Jesús V.R., Greber-Platzer S., Pollak A., Herkner K.R., Streubel B., Kasper D.C. Neonatal screening for lysosomal storage disorders: feasibility and incidence from a nationwide study in Austria. Lancet. 2012;379:335–341. doi: 10.1016/S0140-6736(11)61266-X. [DOI] [PubMed] [Google Scholar]
- 9.Palecek T., Honzikova J., Poupetova H., Vlaskova H., Kuchynka P., Golan L., Magage S., Linhart A. Prevalence of Fabry disease in male patients with unexplained left ventricular hypertrophy in primary cardiology practice: prospective Fabry cardiomyopathy screening study (FACSS) J. Inherit. Metab. Dis. 2014;37:455–460. doi: 10.1007/s10545-013-9659-2. [DOI] [PubMed] [Google Scholar]
- 10.Andrade J., Waters P.J., Singh R.S., Levin A., Toh B.C., Vallance H.D., Sirrs S. Screening for Fabry disease in patients with chronic kidney disease: limitations of plasma alpha-galactosidase assay as a screening test. Clin. J. Am. Soc. Nephrol. 2008;3:139–145. doi: 10.2215/CJN.02490607. [DOI] [PMC free article] [PubMed] [Google Scholar]
- 11.Okur I., Ezgu F., Biberoglu G., Tumer L., Erten Y., Isitman M., Eminoglu F.T., Hasanoglu A. Screening for Fabry disease in patients undergoing dialysis for chronic renal failure in Turkey: identification of new case with novel mutation. Gene. 2013;527:42–47. doi: 10.1016/j.gene.2013.05.050. [DOI] [PubMed] [Google Scholar]
- 12.Aerts J.M., Groener J.E., Kuiper S., Donker-Koopman W.E., Strijland A., Ottenhoff R., van Roomen C., Mirzaian M., Wijburg F.A., Linthorst G.E., Vedder A.C., Rombach S.M., Cox-Brinkman J., Somerharju P., Boot R.G., Hollak C.E., Brady R.O., Poorthuis B.J. Elevated globotriaosylsphingosine is a hallmark of Fabry disease. Proc. Natl. Acad. Sci. U. S. A. 2008;105:2812–2817. doi: 10.1073/pnas.0712309105. [DOI] [PMC free article] [PubMed] [Google Scholar]
- 13.Rombach S.M., Dekker N., Bouwman M.G., Linthorst G.E., Zwinderman A.H., Wijburg F.A., Kuiper S., Vd Bergh Weerman M.A., Groener J.E.M., Poorthuis B.J., Hollak C.E.M., Aerts J.M.F.G. Plasma globotriaosylsphingosine: diagnostic value and relation to clinical manifestations of Fabry disease. Biochim. Biophys. Acta. 2010;1802:741–748. doi: 10.1016/j.bbadis.2010.05.003. [DOI] [PubMed] [Google Scholar]
- 14.Mitobe S., Togawa T., Tsukimura T., Kodama T., Tanaka T., Doi K., Noiri E., Akai Y., Saito Y., Yoshino M., Takenaka T., Saito S., Ohno K., Sakuraba H. Mutant α-galactosidase A with M296I does not cause elevation of the plasma globotriaosylsphingosine level. Mol. Genet. Metab. 2012;107:623–626. doi: 10.1016/j.ymgme.2012.07.003. [DOI] [PubMed] [Google Scholar]
- 15.Doi K., Noiri E., Ishizu T., Negishi K., Suzuki Y., Hamasaki Y., Honda K., Fujita T., Tsukimura T., Togawa T., Saito S., Sakuraba H. High-throughput screening identified disease-causing mutants and functional variants of alpha-galactosidase A gene in Japanese male hemodialysis patients. J. Hum. Genet. 2012;57:575–579. doi: 10.1038/jhg.2012.68. [DOI] [PubMed] [Google Scholar]
- 16.Nakano S., Morizane Y., Makisaka N., Suzuki T., Togawa T., Tsukimura T., Kawashima I., Sakuraba H., Shibasaki F. Development of a highly sensitive immuno-PCR assay for the measurement of α-galactosidase A protein levels in serum and plasma. PLoS One. 2013;8:e78588. doi: 10.1371/journal.pone.0078588. [DOI] [PMC free article] [PubMed] [Google Scholar]
- 17.Togawa T., Kodama T., Suzuki T., Sugawara K., Tsukimura T., Ohashi T., Ishige N., Suzuki K., Kitagawa T., Sakuraba H. Plasma globotriaosylsphingosine as a biomarker of Fabry disease. Mol. Genet. Metab. 2010;100:257–261. doi: 10.1016/j.ymgme.2010.03.020. [DOI] [PubMed] [Google Scholar]
- 18.McDonald I.K., Thornton J.M. Satisfying hydrogen bonding potential in proteins. Mol. Biol. 1994;238:777–793. doi: 10.1006/jmbi.1994.1334. [DOI] [PubMed] [Google Scholar]
- 19.Kundrot C., Ponder J., Richards F. Algorithms for calculating excluded volume and its derivatives as a function of molecular conformation and their use in energy minimization. J. Comput. Chem. 1991;12:402–409. [Google Scholar]
- 20.Dudek M., Ponder J. Accurate modeling of the intramolecular electrostatic energy of proteins. J. Comput. Chem. 1995;16:791–816. [Google Scholar]
- 21.Kong Y., Ponder J.W. Reaction field methods for off-center multipoles. J. Chem. Phys. 1997;107:481–492. [Google Scholar]
- 22.Pappu R.V., Hart R.W., Ponder J.W. Analysis and application of potential energy smoothing for global optimization. J. Phys. Chem. 1998;B102:9725–9742. [Google Scholar]
- 23.Ren P., Ponder J.W. Polarizable atomic multipole water model for molecular mechanics simulation. J. Phys. Chem. 2003;B107:5933–5947. [Google Scholar]
- 24.Garman S.C., Garboczi D.N. The molecular defect leading to Fabry disease: Structure of human α-galactosidase. J. Mol. Biol. 2004;337:319–335. doi: 10.1016/j.jmb.2004.01.035. [DOI] [PubMed] [Google Scholar]
- 25.Kabsch W. A solution for the best rotation to relate two sets of vectors. Acta Crystallogr. 1976;A32:827. [Google Scholar]
- 26.Kabsch W. A discussion of the solution for the best rotation to relate two sets of vectors. Acta Crystallogr. 1978;A34:922–923. [Google Scholar]
- 27.Sakuraba H., Matsuzawa F., Aikawa S., Doi H., Kotani M., Lin H., Ohno K., Tanaka A., Yamada H., Uyama E. Molecular and structural studies of the GM2 gangliosidosis 0 variant. J. Hum. Genet. 2002;47:176–183. doi: 10.1007/s100380200020. [DOI] [PubMed] [Google Scholar]
- 28.Sakuraba H., Matsuzawa F., Aikawa S., Doi H., Kotani M., Nakada H., Fukushige T., Kanzaki T. Structural and immunocytochemical studies on α-N-acetylgalactosaminidase deficiency (Schindler/Kanzaki disease) J. Hum. Genet. 2004;49:1–8. doi: 10.1007/s10038-003-0098-z. [DOI] [PubMed] [Google Scholar]
- 29.Saito S., Ohno K., Sugawara K., Sakuraba H. Structural and clinical implications of amino acid substitutions in N-acetylgalactosamine-4-sulfatase: insight into mucopolysaccharidosis type VI. Mol. Genet. Metab. 2008;93:419–425. doi: 10.1016/j.ymgme.2007.11.017. [DOI] [PubMed] [Google Scholar]
- 30.Matsuzawa F., Aikawa S., Doi H., Okumiya T., Sakuraba H. Fabry disease: correlation between structural changes in α-galactosidase, and clinical and biochemical phenotype. Hum. Genet. 2005;117:317–328. doi: 10.1007/s00439-005-1300-5. [DOI] [PubMed] [Google Scholar]
- 31.Manwaring V., Boutin M., Auray-Blais C. A metabolomic study to identify new globotriaosylceramide-related biomarkers in the plasma of Fabry disease patients. Anal. Chem. 2013;85:9039–9048. doi: 10.1021/ac401542k. [DOI] [PubMed] [Google Scholar]
- 32.Johnson B., Mascher H., Mascher D., Legnini E., Hung C.Y., Dajnoki A., Chien Y.H., Maródi L., Hwu W.L., Bodamer O.A. Analysis of lyso-globotriaosylsphingosine in dried blood spots. Ann. Lab. Med. 2013;33:274–278. doi: 10.3343/alm.2013.33.4.274. [DOI] [PMC free article] [PubMed] [Google Scholar]
- 33.Fuller M., Lovejoy M., Brooks D.A., Harkin M.L., Hopwood J.J., Meikle P.J. Immunoquantification of alpha-galactosidase: evaluation for the diagnosis of Fabry disease. Clin. Chem. 2004;50:1979–1985. doi: 10.1373/clinchem.2004.037937. [DOI] [PubMed] [Google Scholar]
- 34.Okumiya T., Ishii S., Kase R., Kamei S., Sakuraba H., Suzuki Y. Alpha-galactosidase gene mutations in Fabry disease: heterogeneous expressions of mutant enzyme proteins. Hum. Genet. 1995;95:557–561. doi: 10.1007/BF00223869. [DOI] [PubMed] [Google Scholar]
- 35.Yokoi T., Shinoda K., Ohno I., Kato K., Miyawaki T., Taniguchi N. A 3′ splice site consensus sequence mutation in the intron 3 of the alpha-galactosidase A gene in a patient with Fabry disease. Jinrui Idengaku Zasshi. 1991;36:245–250. doi: 10.1007/BF01910542. [DOI] [PubMed] [Google Scholar]
- 36.Mignani R., Feriozzi S., Pisani A., Cioni A., Comotti C., Cossu M., Foschi A., Giudicissi A., Gotti E., Lozupone V.A., Marchini F., Martinelli F., Bianco F., Panichi V., Procaccini D.A., Ragazzoni E., Serra A., Soliani F., Spinelli L., Torti G., Veroux M., Cianciaruso B., Cagnoli L. Agalsidase therapy in patients with Fabry disease on renal replacement therapy: a nationwide study in Italy. Nephrol. Dial. Transplant. 2008;23:1628–1635. doi: 10.1093/ndt/gfm813. [DOI] [PubMed] [Google Scholar]
- 37.Ashley G.A., Shabbeer J., Yasuda M., Eng C.M., Desnick R.J. Fabry disease: twenty novel alpha-galactosidase A mutations causing the classical phenotype. J. Hum. Genet. 2001;46:192–196. doi: 10.1007/s100380170088. [DOI] [PubMed] [Google Scholar]
- 38.Ashton-Prolla P., Tong B., Shabbeer J., Astrin K.H., Eng C.M., Desnick R.J. Fabry disease: twenty-two novel mutations in the alpha-galactosidase A gene and genotype/phenotype correlations in severely and mildly affected hemizygotes and heterozygotes. J. Investig. Med. 2000;48:227–235. [PubMed] [Google Scholar]
- 39.Sakuraba H., Oshima A., Fukuhara Y., Shimmoto M., Nagao Y., Bishop D.F., Desnick R.J., Suzuki Y. Identification of point mutations in the alpha-galactosidase A gene in classical and atypical hemizygotes with Fabry disease. Am. J. Hum. Genet. 1990;47:784–789. [PMC free article] [PubMed] [Google Scholar]
- 40.Eng C.M., Resnick-Silverman L.A., Niehaus D.J., Astrin K.H., Desnick R.J. Nature and frequency of mutations in the alpha-galactosidase A gene that cause Fabry disease. Am. J. Hum. Genet. 1993;53:1186–1197. [PMC free article] [PubMed] [Google Scholar]
- 41.Ishii S., Sakuraba H., Suzuki Y. Point mutations in the upstream region of the alpha-galactosidase A gene exon 6 in an atypical variant of Fabry disease. Hum. Genet. 1992;89:29–32. doi: 10.1007/BF00207037. [DOI] [PubMed] [Google Scholar]
- 42.Ishii S., Nakao S., Minamikawa-Tachino R., Desnick R.J., Fan J.Q. Alternative splicing in the alpha-galactosidase A gene: increased exon inclusion results in the Fabry cardiac phenotype. Am. J. Hum. Genet. 2002;70:994–1002. doi: 10.1086/339431. [DOI] [PMC free article] [PubMed] [Google Scholar]
- 43.Nakao S., Takenaka T., Maeda M., Kodama C., Tanaka A., Tahara M., Yoshida A., Kuriyama M., Hayashibe H., Sakuraba H., Tanaka H. An atypical variant of Fabry's disease in men with left ventricular hypertrophy. N. Engl. J. Med. 1995;333:288–293. doi: 10.1056/NEJM199508033330504. [DOI] [PubMed] [Google Scholar]
- 44.Eng C.M., Niehaus D.J., Enriquez A.L., Burgert T.S., Ludman M.D., Desnick R.J. Fabry disease: twenty-three mutations including sense and antisense CpG alterations and identification of a deletional hot-spot in the alpha-galactosidase A gene. Hum. Mol. Genet. 1994;3:1795–1799. doi: 10.1093/hmg/3.10.1795. [DOI] [PubMed] [Google Scholar]
- 45.Davies J.P., Eng C.M., Hill J.A., Malcolm S., MacDermot K., Winchester B., Desnick R.J. Fabry disease: fourteen alpha-galactosidase A mutations in unrelated families from the United Kingdom and other European countries. Eur. J. Hum. Genet. 1996;4:219–224. doi: 10.1159/000472202. [DOI] [PubMed] [Google Scholar]
- 46.Germain D.P., Shabbeer J., Cotigny S., Desnick R.J. Fabry disease: twenty novel alpha-galactosidase A mutations and genotype-phenotype correlations in classical and variant phenotypes. Mol. Med. 2002;8:306–312. [PMC free article] [PubMed] [Google Scholar]
- 47.Shabbeer J., Yasuda M., Luca E., Desnick R.J. Fabry disease: 45 novel mutations in the alpha-galactosidase A gene causing the classical phenotype. Mol. Genet. Metab. 2002;76:23–30. doi: 10.1016/s1096-7192(02)00012-4. [DOI] [PubMed] [Google Scholar]