

Abstract
Background
Aerobic exercise (AE) is recommended as first‐line antihypertensive lifestyle therapy based on strong evidence showing that it lowers blood pressure (BP) 5 to 7 mm Hg among adults with hypertension. Because of weaker evidence showing that dynamic resistance training (RT) reduces BP 2 to 3 mm Hg among adults with hypertension, it is recommended as adjuvant lifestyle therapy to AE training. Yet, existing evidence suggests that dynamic RT can lower BP as much or more than AE.
Methods and Results
We meta‐analyzed 64 controlled studies (71 interventions) to determine the efficacy of dynamic RT as stand‐alone antihypertensive therapy. Participants (N=2344) were white (57%), middle‐aged (47.2±19.0 years), and overweight (26.8±3.4 kg/m2) adults with prehypertension (126.7±10.3/76.8±8.7 mm Hg); 15% were on antihypertensive medication. Overall, moderate‐intensity dynamic RT was performed 2.8±0.6 days/week for 14.4±7.9 weeks and elicited small‐to‐moderate reductions in systolic BP (SBP; d+=−0.31; 95% CIs, −0.43, −0.19; −3.0 mm Hg) and diastolic BP (DBP; d+=−0.30; 95% CIs, −0.38, −0.18; −2.1 mm Hg) compared to controls (Ps<0.001). Greater BP reductions occurred among samples with higher resting SBP/DBP: ≈6/5 mm Hg for hypertension, ≈3/3 mm Hg for prehypertension, and ≈0/1 mm Hg for normal BP (Ps<0.023). Furthermore, nonwhite samples with hypertension experienced BP reductions that were approximately twice the magnitude of those previously reported following AE training (−14.3 mm Hg [95% CIs, −19.0, −9.4]/−10.3 mm Hg [95% CIs, −14.5, −6.2]).
Conclusions
Our results indicate that for nonwhite adult samples with hypertension, dynamic RT may elicit BP reductions that are comparable to or greater than those reportedly achieved with AE training. Dynamic RT should be further investigated as a viable stand‐alone therapeutic exercise option for adult populations with high BP.
Keywords: exercise training, high blood pressure, hypertension, lifestyle, meta‐analysis, systematic review
Subject Categories: Hypertension, High Blood Pressure, Meta Analysis, Exercise
Introduction
Hypertension is the most prevalent, modifiable, and costly risk factor for cardiovascular disease (CVD).1 Nearly ≈33% (80 million) of US adults currently have hypertension,1 and by 2030, this number is projected to reach 41.1%.1, 2 Lifestyle‐related factors have been identified as the only modifiable determinants of hypertension.2 As a result, numerous randomized controlled trials (RCTs) and over 33 meta‐analyses3, 4 have investigated the antihypertensive effects of exercise. Collectively, these meta‐analyses concluded that aerobic exercise (AE) lowers blood pressure (BP) 5 to 7 mm Hg, whereas dynamic resistance training (RT) lowers BP 2 to 3 mm Hg among adults with hypertension.3, 4, 5, 6 Accordingly, 30 to 60 min/day of moderate‐intensity AE is recommended on most days of the week supplemented by moderate‐intensity dynamic RT on ≥2 days/week to prevent, treat, and control hypertension.4, 6 Yet, a more‐critical review of this literature revealed considerable variability in the magnitude of the BP reductions following both AE (ie, 1–9 mm Hg) and dynamic RT (ie, 0–6 mm Hg), for reasons that are not clear.4
In contrast to the strong evidence supporting the BP‐lowering effects of AE, there is much weaker and limited evidence supporting the efficacy of dynamic RT as stand‐alone antihypertensive therapy.4, 6 In addition to several reviews,3, 4, 5, 6 6 meta‐analyses to date have exclusively examined the BP‐lowering effects of dynamic RT,7, 8, 9, 10, 11, 12 which included mostly healthy adults with normal BP and prehypertension. Importantly, none of these meta‐analyses completely satisfied contemporary methodological quality standards3, 13, 14, 15 nor were they able to identify important sample or dynamic RT characteristics that modulated the BP response to dynamic RT. Meta‐analyses routinely cited poor reporting,7, 9 low methodological study quality,10, 11 and the small number of RT studies7, 8, 10, 11 as limitations of their meta‐analyses, and hence, lack of significant findings. Yet, meta‐analyses rarely examined how methodological study quality influenced their study results,8, 10, 11 applied stringent inclusionary criteria,9, 10, 12 and used subgroup analysis to investigate potential moderators, an approach that is less precise than other conventional techniques, especially among small samples.16, 17, 18, 19 Because of these notable limitations, previous meta‐analyses likely underestimated the antihypertensive effects of dynamic RT, calling into question the generalizability of their findings to adult populations with high BP.3, 4
Several primary level studies have shown that systolic BP (SBP)/diastolic BP (DBP) reductions following dynamic RT are comparable to that of AE among adults with hypertension,20 reporting SBP/DBP reductions of ≈7 to 16/6 to 12 mm Hg and ≈10 to 14/1 to 4 mm Hg among adults with untreated21, 22, 23 and controlled24, 25, 26 hypertension, respectively. Although limited, controlled studies directly comparing the effectiveness of AE and dynamic RT as antihypertensive therapy found that dynamic RT reduced BP to similar levels as AE20 among adults with untreated (≈7–14/6–8 mm Hg)21, 23 and controlled (≈10/3 mm Hg)24, 27 hypertension.
Therefore, the purposes of our meta‐analysis were to provide more precise estimates regarding the efficacy of dynamic RT as stand‐alone antihypertensive therapy, and identify potential moderators of this response to provide insight into the optimal dose of dynamic RT to lower BP among adults with high BP.
Methods
This study fully satisfies the criteria implied by the PRISMA Statement (Preferred Reporting Items for Systematic Reviews and Meta‐Analyses),14, 15 AMSTAR Methodological Quality Scale (Assessment of Multiple SysTemAtic Reviews),13, 28 and AMSTARExBP, an augmented version of the AMSTAR designed specifically to assess meta‐analyses examining the BP response to exercise.3 Institutional review board approval was not required for the current research because it is a meta‐analysis of controlled dynamic RT interventions, which is not considered as research involving human subjects.
Inclusion Criteria
Controlled studies were eligible for inclusion if they satisfied 4 a priori criteria: (1) involved adult participants (≥19 years);29, 30 (2) involved a non‐exercise/non‐diet control or comparison group; (3) reported BP pre‐ and post‐intervention for dynamic RT and control groups; and (4) reported the Frequency, Intensity, and Time (or FIT) of the dynamic RT intervention. Studies involving weight loss drugs, diet therapy, or diet modifications in addition to dynamic RT were excluded. Approximately half of US adults (49.8%)31 have at least 1 lifestyle‐related chronic health condition (eg, diabetes mellitus, CVD risk factors, etc, that require ongoing medical attention and/or limits activities of daily living32, 33), and of these, another half (25.5%) have 2 or more of these conditions.31 Given that hypertension usually occurs in conjunction with other metabolically linked CVD risk factors (ie, <20% occurs in isolation),34 and more than half of adults with hypertension have a cluster of 2 or more CVD risk factors,34 we only excluded studies that involved populations with disease(s) or health conditions unrelated to CVD (eg, arthritis, cancer, HIV/AIDS).
Search Strategy
In consultation with a medical librarian (J.L.), exhaustive Boolean searches were run in 5 electronic databases from inception until January 31, 2014 to identify all relevant studies. Potentially qualifying reports were retrieved from the following electronic databases: Cumulative Index to Nursing and Allied Health Literature, PubMed (including Medline), Scopus (including EMBASE), SportDiscus, and Web of Science (online supplemental material, Data S1, provides the full search strategy for each electronic database). Four investigators (H.V.M., T.U.G., K.C.F., and L.M.L.) screened the sample for inclusion with duplication of effort. Reference lists of included studies, relevant reviews, and meta‐analyses were manually searched for additional reports.
Data Extraction and Coded Variables
Coded variables were extracted using a standardized coding form and coder manual previously developed by a team of experts (L.S.P., B.T.J., T.B.H.M) and pilot tested. Two trained coders (H.V.M., K.C.F.) independently extracted and entered study information with high reliability across all dimensions (mean Cohen κ=0.86 for categorical variables;35 mean Pearson r=0.94 for continuous variables); all disagreements were resolved by discussion. Coded variables included methodological study quality and characteristics of the study, sample, and dynamic RT intervention. Only 14% of the studies21, 24, 36, 37, 38, 39, 40, 41, 42 disclosed the race/ethnicity of their study participants. When unreported, race/ethnicity was estimated using study location;43, 44, 45 samples were considered “white” for North America, Europe, and Australia; “Asian” for Asia and India; “Hispanic/Latino” for South and Central America; and “Black” for Africa. Approximately one‐third of studies failed to disclose information regarding BP medication use among their study participants. Similar estimates were observed among studies that did not report BP medication use (k=22) and those that reported no BP medication use among their sample (k=35; P>0.05); therefore, these studies were combined (k=57) for subsequent moderator analyses. Chronic diseases and health conditions related to CVD were categorized based on the total number reported in the sample.31, 46 Studies that reported ≥2 chronic diseases/health conditions among their sample were categorized as having “multiple chronic conditions.”32, 33
Methodological quality of the studies in our sample was assessed using a modified version of the Downs and Black Checklist47, 48 (see Data S2 for the augmented checklist). This instrument49 is well validated in the health promotion literature and is reliable for assessing both RCTs and non‐RCTs.50 The Downs and Black checklist addresses 5 subscales of quality (ie, reporting, external validity, bias, confounding, and power) and is considered one of the most comprehensive instruments available for assessing methodological study quality.50 The overall methodological quality was gauged as percentage of items satisfied out of a possible 29‐point total and was quantified as: low (≤14 points, <50%), moderate (>14–23 points, 50–79%), or high (≥24 points, ≥80%).47, 48 In addition to quantifying the quality of the dynamic RT literature, we examined how overall methodological quality, quality subscales, and individual dimensions of quality influenced the BP response to dynamic RT independently and interactively 51 with other moderators.
Study Outcomes and Effect‐Size Calculation
Standardized mean difference effect size (d) was used to quantify the effectiveness of dynamic RT as stand‐alone antihypertensive therapy, defined as the mean difference in resting SBP/DBP between dynamic RT and control groups post‐ versus pre‐intervention divided by the pooled SD, correcting for small sample size bias and baseline differences.52, 53 We disaggregated comparisons for studies with >1 dynamic RT interventions (eg, high vs low intensity RT);42, 54, 55, 56, 57, 58, 59 ds were calculated for each comparison (k) and analyzed as separate studies.60 Negative d values indicated that dynamic RT reduced BP more than the non‐exercise control group, and the magnitude of d values was interpreted as −0.20, −0.50, and −0.80 for small, medium and large BP reductions.61 Last, we provide the unstandardized mean effect size (ie, BP difference in mm Hg between RT and control groups at post‐ versus pre‐intervention)60, 62 as a supplement to d in order to enhance the clinical utility of our findings.63
Inconsistencies in ds were estimated with the Q statistic64 and transformed into the I2 statistic and its 95% CIs.65, 66 I2 values range from 0% (homogeneity) to 100% (greater heterogeneity); a CI that does not include 0% indicates that the hypothesis of homogeneity is rejected, and an inference of heterogeneity is merited.65, 66
Moderator Analyses
Given the considerable variability in the magnitude of the BP reductions observed following exercise training (ie, 0–9 mm Hg),4 we examined theoretically driven, a priori study‐level moderators (ie, effect modifiers) related to characteristics of the study (eg, methodological study quality, BP‐focused outcome), sample (eg, baseline BP, race/ethnicity), and dynamic RT intervention (eg, the FIT, number of RT exercises) to determine what combinations elicited the greatest BP reductions. Weighted regression models (viz, meta‐regressions) with maximum‐likelihood estimation of the random‐effects weights, the inverse of the variance for each d, were used to explain the variability in ds for SBP and DBP. Continuous moderators were mean centered and categorical variables were contrast coded before generating interaction terms or performing multiple moderator analyses.51, 67
Multiple moderator meta‐regression models
Because meta‐analysis is correlational in nature, we did not rely solely on individual bivariate metaregressions to “prescreen” which a priori, theoretically driven, study‐level moderators would be examined in multiple moderator models.18, 51, 68 In addition to identifying significant or trending (P≤0.10) moderators in bivariate meta‐regression, we also examined the model coefficient and R 2 value (ie, proportion of variance explained by the covariate) for individual moderators to gauge its influence on the BP response to RT.18
Moderator patterns should emerge more clearly among higher‐quality studies,69, 70, 71 where threats to validity and other biases are minimized and potentially confounding variables are accounted for (ie, “suppression effect”72).18, 51, 68 Because we did not exclude potentially relevant studies based on the experimental design (ie, we included both RCTs and non‐RCTs), level of evidence (ie, methodological quality), or “risk of bias,” we used the “meta‐regression adjustment approach”73 to empirically control or adjust for possible methodological differences across RT studies.18, 51, 68, 74, 75 Therefore, we included overall methodological study quality or individual quality dimensions (eg, BP‐focused study outcome) in our multiple moderator models when feasible.
The moving constant technique
Although it is commonly ignored in practice,67 the constant (or intercept) in a meta‐regression model can be extremely valuable in demonstrating how ds vary at different points along the study‐level moderator variable (or variables; eg, Ferrer et al70 and Brown et al69, 71), across clinic thresholds, or other practical criteria (eg, Kirsch et al76). We used the moving constant technique67 to estimate the magnitude of weighted mean effect sizes (d+) and their CIs at different levels of interest for individual study‐level moderators, including extreme values and other observations, within that range. These estimates, or predicted d+ values (), and their 95% CIs statistically control for the presence of each moderator in the model, held constant at their mean levels, except for the moderator and level of interest.
Additive model
For both SBP and DBP, an additive model was generated from the final multiple moderator model that represented the greatest potential antihypertensive benefit that could be achieved with dynamic RT. In this approach, individual moderators and interaction terms are evaluated simultaneously at the level (ie, and 95% CIs) that confers the largest BP reductions, which in turn, identifies the combination of study‐level moderators, including sample and dynamic RT characteristics, that elicits optimal antihypertensive benefit.
In order to facilitate clinical interpretations, we transformed our results arithmetically to provide the equivalent BP change in mm Hg. For each moderator dimension and level of interest, we back‐converted the standardized estimate (ie, ) into mm Hg of BP change by multiplying the predicted d values by the SD corresponding to the BP level of interest.63 Specific transformation details appear in the table footnotes.
Publication Bias
We visually examined funnel plots for any asymmetries in the effect‐size distribution to identify potential publication or other reporting biases.77 We also evaluated the potential for publication bias using Begg78 and Egger79 methods; neither test suggested publication bias (Ps>0.19; see Figures S1 and S2).
Sensitivity Analyses
To determine whether multiple treatment studies (ie, non‐independent effect sizes that result from different RT interventions being compared to a single control group)80 influenced our weighted mean estimates and multiple moderator meta‐regressions, we performed alternative analyses in R81 using the metafor package (viz, rma.mv function).80, 82 Multivariate meta‐analytic models, following random‐effects assumptions with maximum‐likelihood estimation that accounted for these issues, yielded the same pattern of results (see Tables S1 and S2 for the multivariate mean estimates and multiple moderator models). For simplicity of interpretation, we only report the maximum‐likelihood estimation analyses for SBP and DBP below.
Statistical Computing
Continuous variables are summarized as mean±SD, unless otherwise stated, and categorical variables are presented as absolute values and percentages. Differences in baseline characteristics between the dynamic RT and control groups were examined using t‐tests, one‐way ANOVA, and Fisher's exact test. Analyses used Stata software (version 13.1; StataCorp LP, College Station, TX)83 with macros for meta‐analysis,60, 84 incorporating random‐effects assumptions. Two‐sided statistical significance was P<0.05.
Results
We identified 64 controlled studies that satisfied inclusionary criteria.1 Seven studies involved >1 dynamic RT groups comparing lower‐ versus higher‐intensity RT,42, 57, 58, 59 strength versus power RT,55 elastic band versus aquatic RT,54 and eccentric versus concentric RT,56 yielding 71 total interventions. Figure shows the systematic search for potential reports and selection process of included dynamic RT studies.
Figure 1.
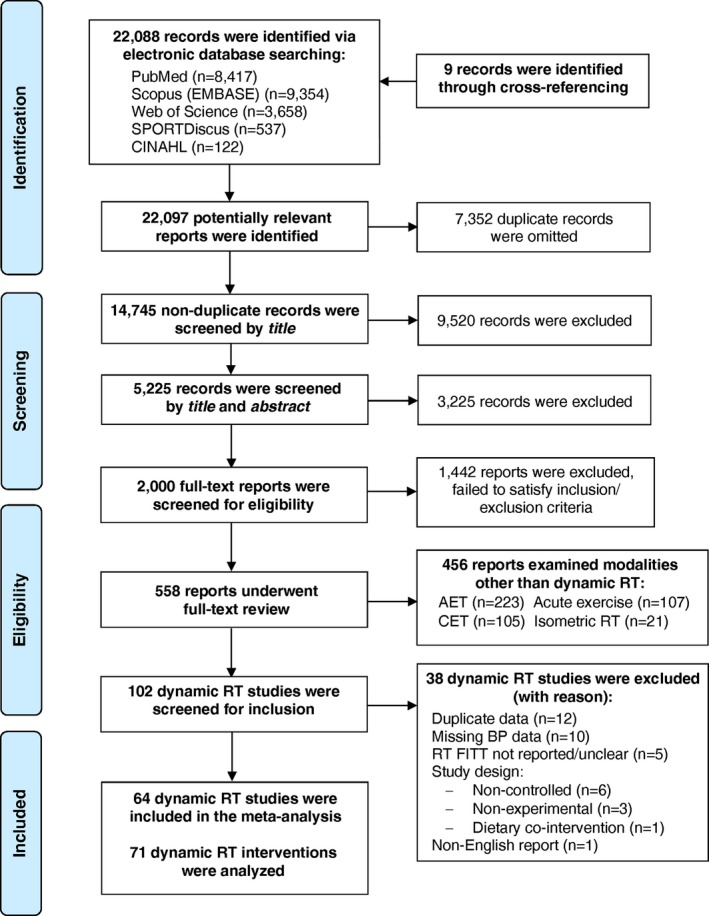
Flow chart detailing the systematic search of potential reports (n) and selection process of included dynamic resistance training studies. AET indicates aerobic exercise training; BP, blood pressure; CINAHL, cumulative index to nursing and allied health literature; CET, concurrent exercise training; FITT, Frequency, Intensity, Time and Type; RT, resistance training.
Study Characteristics
Table S3 provides a general description of each study, sample, and intervention characteristics for the dynamic RT and control groups. Included RT studies were published between 1987 and 2013, the majority were RCTs (82%), and approximately half examined BP as a primary study outcome (48%). Most interventions involved a non‐exercise/wait‐listed control group (86%); 9 studies involved a “placebo” control/comparison group2 (Table S3).
Included studies achieved “moderate” methodological study quality (≈63%),47, 48 despite widely varying scores (41–85%; see Table S4). Studies were most likely to satisfy reporting (78.6%) and internal validity (bias=70.2% and confounding=51.5%) quality subscales, but least likely to satisfy external validity (46.5%) and power (9.2%). None of the subscales emerged as significant moderators in analyses; only 7 studies satisfied ≥80% of quality items (≈83.3%; see Table S5 for the overall and itemized summary of methodological study quality for each intervention).
Sample Characteristics
Table 1 summarizes baseline sample characteristics for the RT and control groups. The dynamic RT (total N across samples=1305) and control (N=1039) samples were sedentary,130 middle‐aged (47.4±19.0 years), overweight (26.7±3.5 kg/m2) adults with prehypertension (SBP/DBP: 126.4±9.4/76.6±8.4 mm Hg).131 Approximately 15% of the total sample was on antihypertensive medication (N=349), but one‐third of studies did not disclose this information (≈68% did). The majority of RT studies (≈60%) involved adults without CVD‐related chronic diseases or health conditions other than their high BP (N=1286). A small subset of RT studies included participants with known CVD‐related chronic diseases (3 studies; N=64),55, 86, 103 or CVD risk factors other than hypertension (7 studies; N=161);36, 55, 90, 91, 101, 114, 118 11 studies (17.2%) reported a clustering of ≥2 chronic diseases and/or health conditions among their sample (see Tables 1 and S3).
Table 1.
Baseline Sample Characteristics for the Dynamic RT (k=71) and Control (k=63) Intervention Groups
| Characteristic | k | Dynamic RT (n=1305) | k | Control (n=1039) |
|---|---|---|---|---|
| Women, n (%) | 69 | 622 (47.7) | 61 | 477 (45.9) |
| Age, y | 68 | 47.2±19.0 | 61 | 47.2±19.1 |
| Race/ethnicity, n (%) | 71 | 63 | ||
| White | 40 | 775 (59.4) | 36 | 554 (53.3) |
| Asian | 17 | 263 (20.2) | 14 | 227 (21.8) |
| Hispanic/Latino/Caribbean | 13 | 254 (19.5) | 12 | 243 (23.4) |
| Black/African American | 1 | 13 (1.0) | 1 | 15 (1.4) |
| Sedentary, n (%)a | 53 | 926 (71.0) | 47 | 764 (73.5) |
| BP medication, n (% using) | 49 | 177 (13.6) | 42 | 172 (16.5) |
| BP classification, n (%)b | ||||
| Normal | 16 | 242 (18.5) | 12 | 164 (15.8) |
| Prehypertension | 41 | 688 (52.7) | 41 | 587 (56.5) |
| Hypertension | 14 | 375 (28.7) | 10 | 292 (28.1) |
| Health status, n (%) | 65 | 54 | ||
| No CVD‐related chronic conditionsc | 38 | 611 (46.8) | 33 | 446 (42.9) |
| CVD‐related chronic conditionsd | 27 | 499 (38.2) | 21 | 380 (36.6) |
| 1 chronic disease/health conditione | 16 | 280 (21.5) | 11 | 158 (15.2) |
| 2 to 3 chronic diseases/health conditionsf | 7 | 69 (5.3) | 6 | 68 (6.5) |
| ≥4 chronic diseases/health conditionsf | 4 | 150 (11.5) | 4 | 154 (14.8) |
| Chronic conditions reported per sample | 1.9±1.3 | 2.0±1.3 | ||
| Body composition | ||||
| Body weight, kg | 61 | 75.0±11.7 | 59 | 74.1±12.0 |
| BMI, kg/m2 | 60 | 26.8±3.4 | 58 | 26.6±3.7 |
| Waist circumference, cm | 17 | 96.9±9.3 | 17 | 96.1±10.0 |
| Body fat (%) | 36 | 29.7±6.9 | 36 | 29.3±7.9 |
| Fat mass, kg | 11 | 26.4±6.8 | 11 | 26.7±7.2 |
| Lean mass, kg | 20 | 50.9±11.2 | 20 | 49.4±11.1 |
| Resting hemodynamics | ||||
| Systolic BP, mm Hg | 71 | 126.7±10.3 | 70 | 126.3±9.4 |
| Diastolic BP, mm Hg | 71 | 76.8±8.7 | 70 | 76.5±8.6 |
| Mean arterial pressure, mm Hg | 71 | 93.2±8.0 | 70 | 93.2±8.2 |
| Pulse pressure, mm Hg | 71 | 49.4±8.3 | 70 | 49.8±6.8 |
| Heart rate, beats/min | 41 | 70.1±6.9 | 40 | 69.1±7.3 |
| Strength and fitness measuresg , h | ||||
| Upper body strength, kg | 18 | 44.5±31.3 | 10 | 43.4±36.5 |
| Lower body strength, kg | 24 | 92.3±58.8 | 16 | 97.3±69.7 |
| Cardiorespiratory fitness, mL/kg per minutes | 24 | 28.6±9.9 | 23 | 29.7±9.4 |
Statistics are summarized as mean±SD, or the number of participants and proportion of the total RT and control samples, n (%). BMI indicates body mass index; BP, blood pressure; CVD, cardiovascular disease; k, number of observations; RT, resistance training.
Participation in <30 minutes of moderate intensity, physical activity on ≤2 days/week;130 in the absence of physical activity data, samples that were reported as “sedentary” were also included.
BP classification published in the Seventh Report of the Joint National Committee.131
Samples were free from CVD‐related chronic diseases or health conditions.
Studies that reported CVD‐related chronic diseases or health conditions among subjects (or medications used to treat diseases/conditions) were categorized based on the total number reported in their sample (ie, 1, 2 to 3, or ≥4; ranging from 1 to 5).31, 46
Chronic diseases/health conditions130 were not mutually exclusive (ie, subjects could have 1 or more); health conditions included hypertension, metabolic syndrome (MetS), and obesity, dyslipidemia (ie, CVD risk factors); chronic diseases: type 2 diabetes mellitus (T2DM), chronic heart failure, and nonalcoholic fatty liver disease (ie, CVD or metabolic diseases).
The most commonly reported combinations included: hypertension, MetS, or dyslipidemia with T2DM (see Table S5 for individual study details).
Upper/lower body strength was reported for 25 of 33 RT and 14 of 24 control groups, respectively; only those reported in kilograms (kg) are summarized.
Baseline fitness was reported for 37 RT and 36 control groups; only relative oxygen uptake assessed by peak or maximal tests are summarized.
Of the 9 studies that reported race/ethnicity (N=446), 6 included all37 or predominantly (80–96%)36, 40, 41, 42 white participants (N=274), 324, 38, 39 included Hispanic/Latino and/or Caribbean participants (N=137), 2 studies36, 41 included a small proportion of African American/Black participants (N=9), and 521, 36, 40, 42 included “other” participants (N=25; Table S3). When we combined the reported and estimated race/ethnicity determinations, the included studies yielded a diverse sample that consisted of 56.7% white (N=1329) and 43.3% non‐white samples (N=1015), that is, 21.2% Hispanic/Latino (N=497), 20.9% Asian (N=490), and 1.2% Black (N=28). Baseline sample characteristics were similar between the dynamic RT and control groups (Table 1).
Dynamic RT Intervention Characteristics
Table 2 summarizes the features of the RT interventions. Dynamic RT was performed 2.8±0.6 days/week for 14.4±7.9 weeks using moderate loads/intensity that corresponded to 65% to 70% of 1 repetition maximum (1‐RM), averaging 64.7±13.0% of 1‐RM. RT programs generally targeted the whole body (91%), but varied widely in their prescription of other acute program variables (eg, RT protocols consisted of 1–5 sets/exercise of 5–30 repetitions/set for 1–16 RT exercises/session; Table 2). On average, dynamic RT programs prescribed 2.8±0.9 sets of 11.0±3.8 repetitions for 7.9±2.9 dynamic RT exercises per session. One‐fourth of studies (27%) failed to disclose the level of supervision during the dynamic RT intervention; of those that did, 63% reported direct supervision. The overall adherence to dynamic RT was high (92.3%±8.9%), but adherence was only reported in 65% of the studies.
Table 2.
Summary of Dynamic RT Intervention Characteristics (k=71)
| Program Characteristics | k | Mean±SD | Range | Median |
|---|---|---|---|---|
| Participants (n) at baseline | 71 | 21.1±14.9 | 8.0, 72.0 | 15.0 |
| Participants (n) post‐RT | 71 | 18.4±11.4 | 8.0, 60.0 | 14.0 |
| Attrition in RT group (%) | 71 | 8.5±13.1 | 0.0, 53.0 | 0.0 |
| Exercise adherence (%) | 46 | 92.3±8.9 | 60.0, 100.0 | 95.0 |
| Dynamic RT FITT | ||||
| Length (weeks) | 71 | 14.4±7.9 | 6.0, 48.0 | 12.0 |
| Frequency (days/week) | 71 | 2.8±0.6 | 2.0, 5.0 | 3.0 |
| Intensity or Load | ||||
| % of 1‐RM | 38 | 64.7±13.0 | 30.0, 87.5 | 65.0 |
| % of MVC | 2 | 90.0±14.4 | 80.0, 100.0 | |
| 10 to 15 RM | 8 | 12.6% | ||
| 8 to 12 RM | 8 | 12.5% | ||
| 6 to 16 RM | 2 | 3.1% | ||
| OMNI‐RT Scale | 2 | 3.1% | ||
| Theraband (not specified) | 3 | 4.7% | ||
| % of 1‐RM (estimated)a | 63 | 67.2±12.4 | 30.0, 100.0 | 70.0 |
| MET (estimated)b | 71 | 4.7±1.8 | 2.8, 8.5 | 3.8 |
| Time (total work/session) | ||||
| Number of exercises/session | 69 | 7.9±2.9 | 1.0, 16.0 | 7.0 |
| Number sets/exercise | 67 | 2.8±0.9 | 1.0, 5.0 | 3.0 |
| Number repetitions/set | 65 | 11.0±3.8 | 5.0, 30.0 | 10.0 |
| Rest interval/recovery (s) | 30 | 96.3±43.3 | 15.0, 180.0 | 90.0 |
| Type of RT protocol | ||||
| Conventional RT | 54 | 76.0% | ||
| Circuit‐style RT | 10 | 14.3% | ||
| Theraband | 4 | 5.7% | ||
| Ankle or shin weights | 2 | 2.9% | ||
| Muscle groups targeted | ||||
| Upper and lower body | 63 | 91.3% | ||
| Lower body | 4 | 5.8% | ||
| Unilateral, upper body | 2 | 2.9% | ||
% indicates percentage; FITT, frequency, intensity, time, and type; k, number of observations; MET, metabolic equivalent unit; MVC, maximum voluntary contraction; Range, minimum, maximum values; Reps, repetitions; RM, repetition maximum; RT, resistance training; s, seconds.
% of 1‐RM was estimated for studies that reported RT intensity/load as 1‐RM range or MVC (%); represents the mean 1‐RM (%) after combining the estimated and reported values (k=38).
Standardized estimate of RT intensity/load; METs were assigned to all RT interventions so that RT intensity/loads could be quantified across studies, including unreported data (k=12) and units other than 1‐RM or MVC (k=39).
Resting BP Assessment
Most interventions reported the instrument used to assess BP (81.7%), with BP most commonly measured in the seated (42.3%) or supine (26.8%) position. Yet, ≈69% of the dynamic RT interventions did not report these details (see Table S6).
Dynamic RT as Stand‐Alone Antihypertensive Therapy
Small‐to‐moderate reductions in SBP (d+ =−0.31; 95% CI, −0.43, −0.19; −3.0 mm Hg) and DBP (d+=−0.30; 95% CI, −0.38, −0.18; −2.1 mm Hg) were observed following dynamic RT versus control, although effect sizes for SBP (I2=51%; 95% CI, 36–63%) and DBP (I2=35%; 95% CI, 13–52%) lacked homogeneity (see Figure S3 for contour‐enhanced funnel plots, a visual display of the effect‐size distribution). Table S7 summarizes the weighted mean effect size and tests for homogeneity for the control, dynamic RT, and dynamic RT versus control.
Moderator Analyses: Multiple Moderator Models
Multiple moderator SBP model
SBP reductions were greater among studies involving samples with higher resting SBP (P=0.011), which occurred in a dose‐response fashion: 5.7 mm Hg for samples with hypertension, 3.0 mm Hg for samples with prehypertension, and 0.0 mm Hg for samples with normal BP. SBP was also reduced to a greater extent among studies involving non‐white than white samples (P=0.002), and among study samples that were not taking BP medication versus those that were (P=0.034). Greater SBP reductions occurred among studies that prescribed ≥8 versus <8 dynamic RT exercises/session (P=0.043), and among studies that examined BP as a primary outcome versus those that did not (P=0.032; Table 3). Collectively, these study‐level moderators accounted for ≈67% of the variance in the BP response to dynamic RT.
Table 3.
Multiple Moderator Model: SBP Response to Dynamic RT (k=69)a
| Moderator Dimension/Level | (95% CI)b | β | P Value | SBP ∆ (mm Hg)c | |
|---|---|---|---|---|---|
| Resting SBP of RT sample, mm Hg | −0.311 | 0.011 | |||
| Normal=115±11 (k=16) | 0.00 (−0.23, 0.23) | 0.0 (−2.5, 2.5) | |||
| Prehypertension=130±13 (k=41) | −0.23 (−0.39, −0.07) | −3.0 (−5.1, −1.0)d | |||
| Hypertension=142±14 (k=14)f | −0.41 (−0.64, −0.19) | −5.7 (−9.0, −2.7)d , e | |||
| Race/ethnicity of RT sample | 0.354 | 0.002 | |||
| White samples (k=40) | −0.00 (−0.20, 0.20) | 0.0 (−2.6, 2.6) | |||
| Nonwhite samples (k=31)f | −0.36 (−0.56, −0.16) | −4.7 (−7.3, −2.1)d | |||
| BP medication use of RT sample | 0.261 | 0.034 | |||
| Taking BP medication (k=14) | −0.03 (−0.29, 0.23) | −0.4 (−3.8, 3.0) | |||
| Not taking BP medication (k=57)f | −0.33 (−0.48, −0.17) | −4.3 (−6.2, −2.2)d | |||
| RT exercises performed/session | −0.221 | 0.043 | |||
| <8 RT exercises=6 (k=37) | −0.11 (−0.29, 0.08) | −1.4 (−4.4, 1.0) | |||
| ≥8 RT exercises=12 (k=32)f | −0.34 (−0.55, −0.12) | −4.4 (−7.2, −1.6)d | |||
| Primary study outcome | −0.238 | 0.032 | |||
| BP focused outcome (k=34)f | −0.30 (−0.49, −0.10) | −3.9 (−6.4, −1.3)d | |||
| Non‐BP focused outcome (k=37) | −0.06 (−0.26, 0.14) | −0.8 (−3.4, 1.8) | |||
| Additive SBP modelf | Non‐white samples | −1.02 (−1.36, −0.67) | −14.3 (−19.0, −9.4) | ||
| White samples | −0.66 (−0.97, −0.35) | −9.2 (−13.6, −4.9) | |||
Resting SBP is presented as mean±SD. ∆ indicates change; BP, blood pressure; k, number of observations; RT, resistance training; SBP, systolic BP; β, standardized coefficient represents unique variance explained by moderator.
Multiple R 2 (variance explained by model, adjusted for number of moderators)=67.1%; I2 residual (variance unexplained by model)=27.3%.
Predicted weighted mean effect size (d+); estimate of the magnitude of SBP reduction among the RT group relative to control, while statistically controlling for the presence of each moderator shown in the above model (held constant at their mean), except for moderator/level of interest. This model also controls for (not shown): 1 versus 2 RT groups (β=−0.235; P=0.050) and SBP×RT exercises interaction (β=0.174; P=0.133).
SBP ∆= (95% CIs) back‐converted to mm Hg. For each moderator/level of interest, (95% CIs) were transformed arithmetically using the SD corresponding to the sample mean (130±13 mm Hg): ∆= (95% CI)×13 mm Hg, with the exception of normal SBP: ∆= (95% CI)×11 mm Hg; hypertension SBP and additive SBP model: ∆= (95% CI)×14 mm Hg.
(P<0.05): normal SBP; white samples; taking medication; 6 exercises; non‐BP outcome.
Normal and prehypertension SBP.
Indicates the moderator dimensions/levels that conferred the largest SBP reductions and were used to generate the additive SBP model.
Additive SBP model
Dynamic RT elicited the greatest potential SBP benefit among studies that included samples with untreated hypertension and prescribed ≥8 dynamic RT exercises/session (−11.8 mm Hg; 95% CI, −16.0, −7.4), an effect that was significantly greater among studies involving non‐white than white samples (see additive SBP model, bottom of Table 3).
Multiple moderator DBP model
DBP reductions were greater among studies involving samples with higher resting DBP (P=0.023): 5.2 mm Hg for samples with hypertension, 3.3 mm Hg for samples with prehypertension, and 1.0 mm Hg for samples with normal BP, and among study samples not taking BP medications versus those that were (P=0.028). Greater DBP reductions occurred among studies that prescribed dynamic RT ≥3 versus <3 days/week (P=0.02), and among studies that achieved lower than higher methodological study quality (P=0.019; Table 4). Collectively, these study‐level moderators accounted for ≈50% of the variance in the BP response to dynamic RT.
Table 4.
Multiple Moderator Model: DBP Response to Dynamic RT (k=71)a
| Moderator Dimension/Level | (95% CI)b | β | P Value | DBP ∆ (mm Hg)c | |
|---|---|---|---|---|---|
| Resting DBP of RT sample, mm Hg | −0.317 | 0.023 | |||
| Normal=69±7 (k=16) | −0.13 (−0.30, 0.31) | −0.9 (−2.1, 2.2) | |||
| Prehypertension=83±9 (k=41) | −0.37 (−0.59, −0.15) | −3.3 (−5.3, −1.4)d | |||
| Hypertension=92±10 (k=14)f | −0.52 (−0.84, −0.19) | −5.2 (−8.4, −1.9)d | |||
| BP medication use of RT sample | 0.260 | 0.028 | |||
| Currently taking BP medication (k=14) | −0.13 (−0.38, 0.11) | −1.2 (−3.4, 1.0) | |||
| Not taking BP medication (k=57)f | −0.39 (−0.55, −0.23) | −3.5 (−5.0, −2.1)d | |||
| Frequency of RT sessions | −0.262 | 0.020 | |||
| <3 days=2 days weekly (k=22) | −0.10 (−0.31, 0.11) | −0.9 (−2.8, 1.0) | |||
| ≥3 days=4 days weekly (k=49)f | −0.50 (−0.76, −0.23) | −4.5 (−6.8, −2.1)d | |||
| Methodological study quality | 0.296 | 0.019 | |||
| Lower quality=49% satisfied (k=25)f | −0.41 (−0.62, −0.19) | −3.7 (−5.6, −1.7)e | |||
| Moderate quality=63% satisfied (k=35) | −0.20 (−0.38, −0.03) | −1.8 (−3.4, −0.3)d | |||
| Higher quality=82% satisfied (k=11) | −0.03 (−0.28, 0.22) | −0.3 (−2.5, 2.0) | |||
| Additive DBP modelf | Non‐white samples | −1.03 (−1.45, −0.62) | −10.3 (−14.5, −6.2) | ||
| White samples | −0.95 (−1.35, −0.54) | −9.5 (−13.5, −5.2) | |||
Resting DBP is presented as mean±SD. ∆ indicates change; BP, blood pressure; DBP, diastolic blood pressure; k, number of observations; RT, resistance training; β, standardized coefficient represents unique variance explained by moderator.
Multiple R 2 (variance explained by model, adjusted for number of moderators)=49.9%; I2 residual (variance unexplained by model)=19.6%.
Predicted weighted mean effect size (d+); estimate of the magnitude of DBP reduction among the RT group relative to control, while statistically controlling for the presence of each moderator shown in the above model (held constant at their mean), except for the moderator/level of interest. This model also controls for (not shown): race/ethnicity (β=0.097; P=0.382), 1 versus 2 RT groups (β=−0.017; P=0.902), and DBP×RT groups interaction (β=0.248; P=0.056).
DBP ∆= (95% CIs) back‐converted to mm Hg. For each moderator/level of interest, (95% CIs) were transformed arithmetically using the SD corresponding to the sample mean (83±9 mm Hg): ∆= (95% CI)×9 mm Hg, with the exception of normal DBP: ∆= (95% CI)×8 mm Hg; hypertension DBP and additive DBP model: ∆= (95% CI)×10 mm Hg.
(P<0.05): normal DBP; taking medication; 2 days/week; higher quality.
Moderate and higher quality.
Indicates the moderator dimensions/levels that conferred the largest DBP reductions and were used to generate the additive DBP model.
Additive DBP model
Dynamic RT elicited the greatest potential DBP benefit among studies that included samples with untreated hypertension and prescribed dynamic RT ≥3 days/week (−9.9 mm Hg; 95% CI, −13.9, −5.9), an effect that was slightly more pronounced among studies involving non‐white than white samples (see additive DBP model, bottom of Table 4).
Discussion
Our meta‐analysis aimed to determine the efficacy of dynamic RT as stand‐alone antihypertensive therapy and identify potential moderators of BP response to provide insight into the optimal dose of dynamic RT to lower BP among adult populations with high BP. Consistent with past meta‐analyses,5, 8, 9, 10, 12 we found that moderate‐intensity dynamic RT, on average, reduced BP ≈2 to 3 mm Hg compared to control (Ps<0.001). Importantly, our moderator analyses revealed new study‐level findings that merit further comment.
Our meta‐analysis revealed that dynamic RT can elicit BP reductions that are comparable to, and in some cases greater than, those that have been previously reported with AE among study samples with hypertension.3, 4, 5, 6 Notably, we found that BP reductions following dynamic RT occurred in dose‐response fashion, such that studies involving samples with hypertension yielded the largest BP reductions (≈6/5 mm Hg), followed by samples with prehypertension (≈3/3 mm Hg), and then samples with normal BP (≈0/1 mm Hg; Ps≤0.023). Furthermore, studies involving non‐white (ie, Hispanic/Latino and Asian) samples with hypertension experienced even larger BP reductions that were approximately double the magnitude reportedly achieved with AE (≈10–14 vs 5–7 mm Hg).3, 4, 5, 6 Our findings should be confirmed using participant‐level data and investigated further in primary‐level studies. Nonetheless, they suggest that the present exercise recommendations for hypertension should be revisited to include dynamic RT in addition to AE as stand‐alone antihypertensive lifestyle therapy.
Our results add other new information to the literature by identifying clinically important study‐level moderators of BP response to dynamic RT. One of our most noteworthy findings was that dynamic RT elicited BP reductions in dose‐response fashion, which aligns with reports for AE training,3, 4, 5 but conflicts with other aggregate‐level meta‐analyses examining the BP response to dynamic RT. Reasons for the differences between our meta‐analysis and others are not completely clear, but may reside in the fact that we performed one of the largest and most comprehensive electronic searches to date, included RCT and non‐RCTs, identified 3 times the number of dynamic RT studies that involved adults with high BP (51 studies; N=1968) than previously reported (16 studies; N=617)12 and adhered to high‐quality, contemporary standards.3, 13, 14, 15
Another important distinction between ours and previously published meta‐analyses7, 8, 9, 10, 11, 12 is that we applied less common, but more sophisticated, contemporary approaches, such as multiple moderator meta‐regressions,16, 18, 19 interactive modeling strategies,51 and the moving constant technique.67 In contrast, past meta‐analyses have almost exclusively used subgroup or univariate meta‐regression analyses to investigate potential study‐level moderators. These 2 approaches consider moderators individually rather than collectively,16, 18, 19 which is problematic not only because meta‐analysis is correlational in nature,16, 18 but also because the BP response to exercise is complex and is likely influenced by many factors at both the study and individual level.130 Assessing multiple study‐level moderators in a single meta‐regression model is the preferred method because it allows sample, RT intervention, and study‐quality moderators that explain unique variance in the BP response to exercise to be isolated with greater precision and confidence.16, 18, 19, 51, 68 Furthermore, the use of contemporary strategies, in particular the moving constant technique,67 can estimate the magnitude of BP reduction at different levels of individual moderators, thus providing more precise estimates that can facilitate interpretation of their clinical significance.
Our meta‐analysis is the first in the exercise and BP literature to incorporate methodological study quality quantitatively to determine whether it independently3, 13 or interactively51 modulates the BP response to dynamic RT. We found that BP reductions were greater among studies that achieved lower than higher methodological quality, although there was a paucity of higher‐quality dynamic RT studies in this literature, with only 7 satisfying ≥80% of quality items. We also found that, despite overall quality, greater BP reductions occurred among studies that examined BP as a primary outcome.
We, along with past meta‐analyses,10, 11, 12 have found this literature to be of “fair‐to‐moderate” methodological study quality.47, 48 In the absence of a higher‐quality literature, there is the potential risk of bias or other threats to validity. Therefore, in addition to assessing and controlling for methodological study quality and whether studies had BP‐focused outcomes in our multiple moderator models, we examined other sources of potential bias. We found that higher methodological quality was associated with more‐recent studies (r=0.45; P<0.001), RCTs (r=0.23; P=0.052), studies that were adequately powered to detect BP outcomes (r=0.41; P<0.001), involved 1 dynamic RT intervention (vs multiple; r=0.22; P=0.069), and followed established BP assessment protocols (r=0.24; P=0.045). Despite their association with methodological study quality, none of these potential biases modulated the BP response to dynamic RT. Nonetheless, they were incorporated in analyses, when feasible, to control for confounding or suppression effects that could arise from lower‐quality studies.3, 51 By examining the potential risk of bias from several sources and incorporating them into our multiple moderator models, we can be more confident in our results, despite the number of methodological deficits and inconsistencies in this literature.51
Our moderator analyses also addressed other important gaps in this literature. No meta‐analysis conducted to date, until ours, has identified features of the dynamic RT intervention that influences the BP response to dynamic RT. We found that dynamic RT protocols performed, on average, 3 days/week using low‐to‐moderate loads/intensity (≈60–65% 1‐RM), consisting of 3 sets of 10 to 12 repetitions for ≈8 (3–4 upper and 4–5 lower body) exercises significantly reduced resting BP ≈5 to 6 mm Hg among studies that included samples with hypertension. We observed even larger BP reductions among studies that prescribed dynamic RT ≥3 versus <3 days/week and ≥8 versus <8 RT exercises/session. Our findings are in agreement with the current exercise recommendations for hypertension, and provide some of the first study‐level evidence regarding the FIT components of the dynamic RT prescription for adult populations with high BP. Nonetheless, important characteristics of the dynamic RT intervention (eg, progression, load/intensity, rest/recovery duration) were inconsistently or poorly reported. Therefore, the dynamic RT protocol that elicits the most favorable BP benefits for adult populations with hypertension remains elusive.
We also identified study‐level sample characteristics that suggests there may be particular populations that could benefit the most from dynamic RT as stand‐alone antihypertensive therapy. Namely, BP reductions were greater among study samples that were not taking antihypertensive medications compared to those that were (≈4 vs 1 mm Hg), independent of baseline BP. This finding is potentially promising because of the synergistic effect between antihypertensive medication and the magnitude of BP reductions following dynamic RT that have been reported by some,25, 132, 133 but not all, studies.22, 121, 122 Nonetheless, these findings should be interpreted with caution given the small proportion of dynamic RT studies that reported antihypertensive medication use in their sample (≈15%), and the generally poor reporting of medication use in this literature (unreported by ≈33%).
Interestingly, we found that dynamic RT studies involving non‐white (ie, Asian, Hispanic/Latino, and Black) samples with hypertension elicited BP reductions of 10 to 14 mm Hg, approximately double the magnitude that has been previously reported to occur as a result of AE training among predominately white populations (ie, 5–7 mm Hg).3, 4, 5, 6 To the best of our knowledge, only 1 meta‐analysis43 has investigated the potential impact of race/ethnicity on the BP response to exercise training. Whelton et al43 found that AE training reduced resting BP to greater levels among Asian (6/7 mm Hg) and Black (11/3 mm Hg) compared to white samples (3/3 mm Hg; P<0.05). In follow‐up analyses (not shown), we observed a similar non‐significant trend where greater SBP reductions occurred among studies that included Hispanic/Latino (≈13/10 mm Hg) and Asian (≈11/10 mm Hg) compared to white samples (≈9/10 mm Hg).
The potential mechanisms underlying the greater BP‐lowering benefits resulting from dynamic RT among non‐white than white samples are beyond the scope of our meta‐analysis, and should be interpreted with some caution because we estimated race/ethnicity based on the study location for ≈86% of included studies. Nonetheless, we examined racial/ethnic differences in baseline study‐level characteristics to determine whether these covariates could provide additional insight to our findings. Despite similar baseline BP (white: 128.0±9.9/76.9±8.9 mm Hg vs non‐white: 125.0±10.6/76.6±8.7 mm Hg; Ps≥0.90), we found that body mass index was higher among studies with white than non‐white samples (27.9±0.5 vs 25.6±0.6 kg/m2; P=0.01), and waist circumference tended to be greater among non‐white than white study samples (100.1±8.2 vs 92.2±9.5 cm; P=0.10). However, these study‐level covariates did not emerge as moderators of BP response to dynamic RT, perhaps in part, because they were poorly reporting across interventions (body mass index, k=60; waist circumference, k=17). Therefore, follow‐up analyses did not provide any additional insight into our findings as to why greater antihypertensive effects were observed among RT studies that included non‐white than white samples.
Limitations, Strengths, and Future Directions
Our meta‐analysis is not without limitations. The broader selection criteria, which permitted RCTs and non‐RCTs and studies that included samples with and without CVD‐related chronic diseases and health conditions, may limit our ability to directly compare our findings against previous meta‐analyses. On the other hand, subsequent analyses did not reveal that randomization or inclusion of study samples with CVD‐related chronic diseases or health conditions significantly modulated the BP response to dynamic RT. Moreover, our multiple moderator models controlled for potential biases that could have been introduced by including studies presumed to be of “lower quality” (ie, non‐RCTs). We must also acknowledge that estimating race/ethnicity based on the geographical location of the study is a limitation of our meta‐analysis, but more importantly, a limitation of primary‐level studies in this literature.134, 135, 136 We estimated race/ethnicity only when it was unreported in the original article; unfortunately, this was the case for the majority of our sample. Nonetheless, we employed the same methodology used by Whelton et al43 and 2 recent meta‐analyses that examined differences in prevalence of high BP45 and diabetes mellitus44 between racial/ethnic minority groups. Finally, our results should be interpreted with some caution because the effect modifiers we observed using study‐level moderators may not be confirmed in future studies using individual participant‐level.137, 138
Our meta‐analysis also has several strengths. In addition to fully satisfying contemporary methodological standards, our meta‐analysis is one of the largest, most comprehensive meta‐analyses conducted on this topic to date. We included 64 controlled studies (71 interventions) that involved 2374 participants, of which 1968 had pre‐ to established hypertension. Second, we expanded upon previous meta‐analyses by applying more sophisticated, contemporary approaches (ie, multiple moderator meta‐regressions16, 18, 19) and innovative techniques (ie, interactive modeling strategies51 and the moving constant technique67) that enabled us to identify novel study‐level moderators that explained a clinically meaningful proportion of the variance in the BP response to dynamic RT (ie, 50–67%). Third, our meta‐analysis incorporated methodological study quality and other potential biases (ie, BP‐focused outcomes) into our multiple moderator models; therefore, we can be more confident in the robustness of our findings despite the methodological limitations of this literature. Last, our results may also help to optimize future research efforts by documenting where knowledge is the weakest or poorly reported, generating new hypotheses about what dose of dynamic RT elicits optimal antihypertensive benefits for particular patient populations, and highlighting which research areas warrant additional investigation.
Conclusions
In summary, our meta‐analysis, which adhered to high‐quality, contemporary methodological standards, revealed that dynamic RT can elicit BP reductions that are comparable to, or greater than, those reportedly achieved with AE among samples with hypertension. A novel finding was that dynamic RT conferred the greatest antihypertensive benefit among studies that included non‐white samples with hypertension that were not taking BP‐lowering medication; BP reductions that were double in magnitude to those reported as a result of AE training. Despite our new and exciting findings, this literature has limitations and is of only fair‐to‐moderate quality. Additional RCTs that adequately report the characteristics of their sample, dynamic RT intervention features, and BP assessment methods are needed to confirm our findings. Nonetheless, our results indicate that RT should be further investigated as a viable lifestyle therapeutic option for adult populations with hypertension, and the present exercise recommendations for hypertension should be revisited to include dynamic RT in addition to AE as stand‐alone antihypertensive lifestyle therapy.
Sources of Funding
This research was supported by the Office of the Vice President for Research (Research Excellence Program) and Institute for Collaboration on Health, Intervention, and Policy (InCHIP), both located at the University of Connecticut (Storrs, CT). Dr Paulo V.T. Farinatti was supported by the Brazilian Council for the Scientific and Technological Development (CNPq).
Disclosures
None.
Supporting information
Data S1. Full search strategy for each of the five electronic databases queried: PubMed, Scopus (including EMBASE), Web of Science, SPORTDiscus, and CINAHL (Cumulative Index to Nursing and Allied Health Literature).
Data S2. Augmented version of the Downs and Black Checklist.
Table S1. Antihypertensive Effects of Dynamic Resistance Training Compared to Control: A Comparison of Weighted Mean Effect Sizes and Tests for Homogeneity for Systolic and Diastolic Blood Pressure Generated using Stata 13.1 vs the Metafor Package in R (k=71)
Table S2. Blood Pressure Response to Dynamic Resistance Training: A Comparison of Multiple Moderator Models Generated Using Stata 13.1 vs the Metafor Package in R
Table S3. General Description of Each Included Study and a Detailed Summary of the Baseline Sample Characteristics, Dynamic Resistance Training and Control Interventions, and Blood Pressure Outcomes (k=71)
Table S4. Summary of the Overall Methodological Study Quality, Individual Quality Items, and Quality Subscales for the Included Dynamic Resistance Training Interventions (k=71) Gauged Using the Augmented Downs and Black Checklist
Table S5. Item‐by‐Item Summary of Methodological Study Quality for the Included Dynamic Resistance Training Intervention (k=71) Gauged Using the Augmented Version of the Downs and Black Checklist
Table S6. Resting Blood Pressure Assessment Methods for Preintervention and Postintervention Measurements (k=71)
Table S7. Antihypertensive Effects of Dynamic Resistance Training vs Control: Weighted Mean Effect Sizes and Test for Homogeneity for Systolic and Diastolic Blood Pressure
Figure S1. Tests for publication bias using Begg and Egger methods: systolic blood pressure.
Figure S2. Tests for publication bias using Begg and Egger methods: diastolic blood pressure.
Figure S3. Contour‐enhanced funnel plots: a visual representation of the effect size distribution for the antihypertensive effects of dynamic resistance training versus nonexercise control.
Acknowledgments
This research was conducted as part of Dr Hayley V. MacDonald's doctoral dissertation and postdoctoral research training at University of Connecticut (Storrs, CT). We thank Dr TaShauna U. Goldsby and Lauren M. Lamberti, MS, for their assistance in screening potentially relevant reports for inclusion.
(J Am Heart Assoc. 2016;5:e003231 doi: 10.1161/JAHA.116.003231)
Notes
References
- 1. Mozaffarian D, Benjamin EJ, Go AS, Arnett DK, Blaha MJ, Cushman M, de Ferranti S, Despres JP, Fullerton HJ, Howard VJ, Huffman MD, Judd SE, Kissela BM, Lackland DT, Lichtman JH, Lisabeth LD, Liu S, Mackey RH, Matchar DB, McGuire DK, Mohler ER III, Moy CS, Muntner P, Mussolino ME, Nasir K, Neumar RW, Nichol G, Palaniappan L, Pandey DK, Reeves MJ, Rodriguez CJ, Sorlie PD, Stein J, Towfighi A, Turan TN, Virani SS, Willey JZ, Woo D, Yeh RW, Turner MB; American Heart Association Statistics Committee and Stroke Statistics Subcommittee . Heart disease and stroke statistics‐2015 update: a report from the American Heart Association. Circulation. 2015;131:e29–e322. [DOI] [PubMed] [Google Scholar]
- 2. Egan BM, Li J, Hutchison FN, Ferdinand KC. Hypertension in the United States, 1999 to 2012: progress toward Healthy People 2020 goals. Circulation. 2014;130:1692–1699. [DOI] [PMC free article] [PubMed] [Google Scholar]
- 3. Johnson BT, MacDonald HV, Bruneau ML Jr, Goldsby TU, Brown JC, Huedo‐Medina TB, Pescatello LS. Methodological quality of meta‐analyses on the blood pressure response to exercise: a review. J Hypertens. 2014;32:706–723. [DOI] [PubMed] [Google Scholar]
- 4. Pescatello LS, MacDonald HV, Ash GI, Lamberti LM, Farquhar WB, Arena R, Johnson BT. Assessing the existing professional exercise recommendations for hypertension: a review and recommendations for future research priorities. Mayo Clin Proc. 2015;90:801–812. [DOI] [PubMed] [Google Scholar]
- 5. Pescatello LS, Franklin BA, Fagard R, Farquhar WB, Kelley GA, Ray CA; American College of Sports Medicine . American College of Sports Medicine position stand: exercise and hypertension. Med Sci Sports Exerc. 2004;36:533–553. [DOI] [PubMed] [Google Scholar]
- 6. Pescatello LS, MacDonald HV, Lamberti LM, Johnson BT. Exercise for hypertension: a prescription update integrating existing recommendations with emerging research. Curr Hypertens Rep. 2015;17:87. [DOI] [PMC free article] [PubMed] [Google Scholar]
- 7. Kelley GA. Dynamic resistance exercise and resting blood pressure in adults: a meta‐analysis. J Appl Physiol. 1997;82:1559–1565. [DOI] [PubMed] [Google Scholar]
- 8. Kelley GA, Kelley KS. Progressive resistance exercise and resting blood pressure: a meta‐analysis of randomized controlled trials. Hypertension. 2000;35:838–843. [DOI] [PubMed] [Google Scholar]
- 9. Cornelissen VA, Fagard RH. Effect of resistance training on resting blood pressure: a meta‐analysis of randomized controlled trials. J Hypertens. 2005;23:251–259. [DOI] [PubMed] [Google Scholar]
- 10. Cornelissen VA, Fagard RH, Coeckelberghs E, Vanhees L. Impact of resistance training on blood pressure and other cardiovascular risk factors: a meta‐analysis of randomized, controlled trials. Hypertension. 2011;58:950–958. [DOI] [PubMed] [Google Scholar]
- 11. Rossi AM, Moullec G, Lavoie KL, Gour‐Provencal G, Bacon SL. The evolution of a Canadian Hypertension Education Program recommendation: the impact of resistance training on resting blood pressure in adults as an example. Can J Cardiol. 2013;29:622–627. [DOI] [PubMed] [Google Scholar]
- 12. Cornelissen VA, Smart NA. Exercise training for blood pressure: a systematic review and meta‐analysis. J Am Heart Assoc. 2013;2:e004473 doi: 10.1161/JAHA.112.004473. [DOI] [PMC free article] [PubMed] [Google Scholar]
- 13. Shea BJ, Hamel C, Wells GA, Bouter LM, Kristjansson E, Grimshaw J, Henry DA, Boers M. AMSTAR is a reliable and valid measurement tool to assess the methodological quality of systematic reviews. J Clin Epidemiol. 2009;62:1013–1020. [DOI] [PubMed] [Google Scholar]
- 14. Moher D, Shamseer L, Clarke M, Ghersi D, Liberati A, Petticrew M, Shekelle P, Stewart LA; PRISMA‐P Group . Preferred reporting items for systematic review and meta‐analysis protocols (PRISMA‐P) 2015 statement. Syst Rev. 2015;4:1. [DOI] [PMC free article] [PubMed] [Google Scholar]
- 15. Moher D, Liberati A, Tetzlaff J, Altman DG; PRISMA Group . Preferred reporting items for systematic reviews and meta‐analyses: the PRISMA statement. J Clin Epidemiol. 2009;62:1006–1012. [DOI] [PubMed] [Google Scholar]
- 16. Steel PD, Kammeyer‐Mueller JD. Comparing meta‐analytic moderator estimation techniques under realistic conditions. J Appl Psychol. 2002;87:96–111. [DOI] [PubMed] [Google Scholar]
- 17. MacCallum RC, Zhang S, Preacher KJ, Rucker DD. On the practice of dichotomization of quantitative variables. Psychol Methods. 2002;7:19–40. [DOI] [PubMed] [Google Scholar]
- 18. Viechtbauer W. Accounting for heterogeneity via random‐effects models and moderator analyses in meta‐analysis. Z Psychol/J Psychol. 2007;215:104–121. [Google Scholar]
- 19. Viswesvaran C, Sanchez JI. Moderator search in meta‐analysis: a review and cautionary note on existing approaches. Educ Psychol Meas. 1998;58:77–87. [Google Scholar]
- 20. Hurley BF, Gillin AR. Chapter 2: can resistance training play a role in the prevention or treatment of hypertension? In: Pescatello LS, ed. Effects of Exercise on Hypertension: From Cells to Physiological Systems. Switzerland: Springer International Publishing; 2015:25–46. [Google Scholar]
- 21. Blumenthal JA, Siegel WC, Appelbaum M. Failure of exercise to reduce blood pressure in patients with mild hypertension. Results of a randomized controlled trial. JAMA. 1991;266:2098–2104. [PubMed] [Google Scholar]
- 22. Moraes MR, Bacurau RF, Casarini DE, Jara ZP, Ronchi FA, Almeida SS, Higa EM, Pudo MA, Rosa TS, Haro AS, Barros CC, Pesquero JB, Wurtele M, Araujo RC. Chronic conventional resistance exercise reduces blood pressure in stage 1 hypertensive men. J Strength Cond Res. 2012;26:1122–1129. [DOI] [PubMed] [Google Scholar]
- 23. Norris R, Carroll D, Cochrane R. The effects of aerobic and anaerobic training on fitness, blood pressure, and psychological stress and well‐being. J Psychosom Res. 1990;34:367–375. [DOI] [PubMed] [Google Scholar]
- 24. Castaneda C, Layne JE, Munoz‐Orians L, Gordon PL, Walsmith J, Foldvari M, Roubenoff R, Tucker KL, Nelson ME. A randomized controlled trial of resistance exercise training to improve glycemic control in older adults with type 2 diabetes. Diabetes Care. 2002;25:2335–2341. [DOI] [PubMed] [Google Scholar]
- 25. Mota MR, Oliveira RJ, Terra DF, Pardono E, Dutra MT, de Almeida JA, Silva FM. Acute and chronic effects of resistance exercise on blood pressure in elderly women and the possible influence of ACE I/D polymorphism. Int J Gen Med. 2013;6:581–587. [DOI] [PMC free article] [PubMed] [Google Scholar]
- 26. Terra DF, Mota MR, Rabelo HT, Bezerra LM, Lima RM, Ribeiro AG, Vinhal PH, Dias RM, Silva FM. Reduction of arterial pressure and double product at rest after resistance exercise training in elderly hypertensive women. Arq Bras Cardiol. 2008;91:299–305. [DOI] [PubMed] [Google Scholar]
- 27. Jorge ML, de Oliveira VN, Resende NM, Paraiso LF, Calixto A, Diniz AL, Resende ES, Ropelle ER, Carvalheira JB, Espindola FS, Jorge PT, Geloneze B. The effects of aerobic, resistance, and combined exercise on metabolic control, inflammatory markers, adipocytokines, and muscle insulin signaling in patients with type 2 diabetes mellitus. Metabolism. 2011;60:1244–1252. [DOI] [PubMed] [Google Scholar]
- 28. Shea BJ, Grimshaw JM, Wells GA, Boers M, Andersson N, Hamel C, Porter AC, Tugwell P, Moher D, Bouter LM. Development of AMSTAR: a measurement tool to assess the methodological quality of systematic reviews. BMC Med Res Methodol. 2007;7:10. [DOI] [PMC free article] [PubMed] [Google Scholar]
- 29. Overweight and Obesity: Childhood Obesity Facts. [Internet]. Atlanta, GA: Division of Nutrition, Physical Activity, and Obesity, National Center for Chronic Disease Prevention and Health Promotion; Updated 2014. Available at: http://www.cdc.gov/obesity/data/childhood.html. Accessed March 01, 2015. [Google Scholar]
- 30. Ogden CL, Flegal KM. Changes in Terminology for Childhood Overweight and Obesity. National Health Statistics Reports, No. 25. Hyattsville, MD: National Center for Health Statistics; 2010. [PubMed] [Google Scholar]
- 31. Ward BW, Schiller JS, Goodman RA. Multiple chronic conditions among US adults: a 2012 update. Prev Chronic Dis. 2014;11:e62. [DOI] [PMC free article] [PubMed] [Google Scholar]
- 32. Parekh AK, Goodman RA, Gordon C, Koh HK; HHS Interagency Workgroup on Multiple Chronic Conditions . Managing multiple chronic conditions: a strategic framework for improving health outcomes and quality of life. Public Health Rep. 2011;126:460–471. [DOI] [PMC free article] [PubMed] [Google Scholar]
- 33. U.S. Department of Health and Human Services . Multiple Chronic Conditions — A Strategic Framework: Optimum Health and Quality of Life for Individuals with Multiple Chronic Conditions. Washington, DC: U.S. Department of Health and Human Services (HHS); 2010. Available at: http://www.hhs.gov/ash/initiatives/mcc/mcc_framework.pdf. Accessed February 29, 2016. [Google Scholar]
- 34. Kannel WB. Risk stratification in hypertension: new insights from the Framingham Study. Am J Hypertens. 2000;13(1 Pt 2):3S–10S. [DOI] [PubMed] [Google Scholar]
- 35. Cohen J. Weighted kappa: nominal scale agreement with provision for scaled disagreement or partial credit. Psychol Bull. 1968;70:213–220. [DOI] [PubMed] [Google Scholar]
- 36. Bateman LA, Slentz CA, Willis LH, Shields AT, Piner LW, Bales CW, Houmard JA, Kraus WE. Comparison of aerobic versus resistance exercise training effects on metabolic syndrome (from the studies of a targeted risk reduction intervention through defined exercise ‐ STRRIDE‐AT/RT). Am J Cardiol. 2011;108:838–844. [DOI] [PMC free article] [PubMed] [Google Scholar]
- 37. Katz J, Wilson BR. The effects of a six‐week, low‐intensity Nautilus circuit training program on resting blood pressure in females. J Sports Med Phys Fitness. 1992;32:299–302. [PubMed] [Google Scholar]
- 38. Locks RR, Costa TC, Koppe S, Yamaguti AM, Garcia MC, Gomes AR. Effects of strength and flexibility training on functional performance of healthy older people. Rev Bras Fisioter. 2012;16:184–190. [DOI] [PubMed] [Google Scholar]
- 39. Reis JG, Costa GC, Schmidt A, Ferreira CH, Abreu DC. Do muscle strengthening exercises improve performance in the 6‐minute walk test in postmenopausal women? Rev Bras Fisioter. 2012;16:236–240. [DOI] [PubMed] [Google Scholar]
- 40. Sigal RJ, Kenny GP, Boule NG, Wells GA, Prud'homme D, Fortier M, Reid RD, Tulloch H, Coyle D, Phillips P, Jennings A, Jaffey J. Effects of aerobic training, resistance training, or both on glycemic control in type 2 diabetes: a randomized trial. Ann Intern Med. 2007;147:357–369. [DOI] [PubMed] [Google Scholar]
- 41. Spalding TW, Lyon LA, Steel DH, Hatfield BD. Aerobic exercise training and cardiovascular reactivity to psychological stress in sedentary young normotensive men and women. Psychophysiology. 2004;41:552–562. [DOI] [PubMed] [Google Scholar]
- 42. Tsutsumi T, Don BM, Zaichkowsky LD, Delizonna LL. Physical fitness and psychological benefits of strength training in community dwelling older adults. Appl Human Sci. 1997;16:257–266. [DOI] [PubMed] [Google Scholar]
- 43. Whelton SP, Chin A, Xin X, He J. Effect of aerobic exercise on blood pressure: a meta‐analysis of randomized, controlled trials. Ann Intern Med. 2002;136:493–503. [DOI] [PubMed] [Google Scholar]
- 44. Meeks KA, Freitas‐Da‐Silva D, Adeyemo A, Beune EJ, Modesti PA, Stronks K, Zafarmand MH, Agyemang C. Disparities in type 2 diabetes prevalence among ethnic minority groups resident in Europe: a systematic review and meta‐analysis. Intern Emerg Med. 2016;11:327–340. [DOI] [PubMed] [Google Scholar]
- 45. Modesti PA, Reboldi G, Cappuccio FP, Agyemang C, Remuzzi G, Rapi S, Perruolo E, Parati G; ESH Working Group on CV Risk in Low Resource Settings . Panethnic differences in blood pressure in Europe: a systematic review and meta‐analysis. PLoS One. 2016;11:e0147601. [DOI] [PMC free article] [PubMed] [Google Scholar]
- 46. Ford ES, Croft JB, Posner SF, Goodman RA, Giles WH. Co‐occurrence of leading lifestyle‐related chronic conditions among adults in the United States, 2002–2009. Prev Chronic Dis. 2013;10:e60. [DOI] [PMC free article] [PubMed] [Google Scholar]
- 47. Chudyk AM, Jutai JW, Petrella RJ, Speechley M. Systematic review of hip fracture rehabilitation practices in the elderly. Arch Phys Med Rehabil. 2009;90:246–262. [DOI] [PubMed] [Google Scholar]
- 48. Samoocha D, Bruinvels DJ, Elbers NA, Anema JR, van der Beek AJ. Effectiveness of web‐based interventions on patient empowerment: a systematic review and meta‐analysis. J Med Internet Res. 2010;12:e23. [DOI] [PMC free article] [PubMed] [Google Scholar]
- 49. Downs SH, Black N. The feasibility of creating a checklist for the assessment of the methodological quality both of randomised and non‐randomised studies of health care interventions. J Epidemiol Community Health. 1998;52:377–384. [DOI] [PMC free article] [PubMed] [Google Scholar]
- 50. Deeks JJ, Dinnes J, D'Amico R, Sowden AJ, Sakarovitch C, Song F, Petticrew M, Altman DG; International Stroke Trial Collaborative Group ; European Carotid Surgery Trial Collaborative Group . Evaluating non‐randomised intervention studies. Health Technol Assess. 2003;7: iii‐x, 1–173. [DOI] [PubMed] [Google Scholar]
- 51. Johnson BT, Low RE, MacDonald HV. Panning for the gold in health research: incorporating studies’ methodological quality in meta‐analysis. Psychol Health. 2015;30:135–152. [DOI] [PubMed] [Google Scholar]
- 52. Hedges LV, Olkin I. Statistical Methods for Meta‐Analysis. Orlando, FL: Academic Press Inc; 1985. [Google Scholar]
- 53. Becker BJ. Synthesizing standardized mean‐change measures. Br J Math Stat Psychol. 1988;41:257–278. [Google Scholar]
- 54. Colado JC, Triplett NT, Tella V, Saucedo P, Abellan J. Effects of aquatic resistance training on health and fitness in postmenopausal women. Eur J Appl Physiol. 2009;106:113–122. [DOI] [PubMed] [Google Scholar]
- 55. Kanegusuku H, Queiroz AC, Chehuen MR, Costa LA, Wallerstein LF, Mello MT, Ugrinowitsch C, Forjaz CL. Strength and power training did not modify cardiovascular responses to aerobic exercise in elderly subjects. Braz J Med Biol Res. 2011;44:864–870. [DOI] [PubMed] [Google Scholar]
- 56. Okamoto T, Masuhara M, Ikuta K. Effects of eccentric and concentric resistance training on arterial stiffness. J Hum Hypertens. 2006;20:348–354. [DOI] [PubMed] [Google Scholar]
- 57. Sheikholeslami Vatani D, Ahmadi S, Ahmadi Dehrashid K, Gharibi F. Changes in cardiovascular risk factors and inflammatory markers of young, healthy, men after six weeks of moderate or high intensity resistance training. J Sports Med Phys Fitness. 2011;51:695–700. [PubMed] [Google Scholar]
- 58. Tanimoto M, Kawano H, Gando Y, Sanada K, Yamamoto K, Ishii N, Tabata I, Miyachi M. Low‐intensity resistance training with slow movement and tonic force generation increases basal limb blood flow. Clin Physiol Funct Imaging. 2009;29:128–135. [DOI] [PubMed] [Google Scholar]
- 59. Vincent KR, Vincent HK, Braith RW, Bhatnagar V, Lowenthal DT. Strength training and hemodynamic responses to exercise. Am J Geriatr Cardiol. 2003;12:97–106. [DOI] [PubMed] [Google Scholar]
- 60. Lipsey M, Wilson D. Practical Meta‐Analysis. Thousand Oaks, CA: Sage; 2001. [Google Scholar]
- 61. Cohen J. Statistical Power Analysis for the Behavioral Sciences. 2nd ed Hillsdale, NJ: L. Erlbaum Associates; 1988. [Google Scholar]
- 62. Huedo‐Medina TB, Johnson BT. Estimating The Standardized Mean Difference Effect Size and Its Variance From Different Data Sources: A Spreadsheet. Storrs, CT: Authors; 2011. [Google Scholar]
- 63. Johnson BT, Huedo‐Medina TB. Meta‐Analytic Statistical Inferences for Continuous Measure Outcomes as a Function of Effect Size Metric and Other Assumptions (Prepared by the University of Connecticut, Hartford Hospital Evidence‐Based Practice Center under Contract No. 290‐2007‐10067‐I). AHRQ Publication No. 13‐EHC075‐EF. Rockville, MD: Agency for Healthcare Research and Quality, US Department of Health and Human Services; 2013. [PubMed] [Google Scholar]
- 64. Cochran W. The combination of estimates from different experiments. Biometrics. 1954;10:101–129. [Google Scholar]
- 65. Higgins JPT, Thompson SG, Deeks JJ, Altman DG. Measuring inconsistency in meta‐analyses. BMJ. 2003;327:557–560. [DOI] [PMC free article] [PubMed] [Google Scholar]
- 66. Huedo‐Medina TB, Sanchez‐Meca J, Marin‐Martinez F. Assessing heterogeneity in meta‐analysis: Q statistic or I2 index? Psychol Methods. 2006;11:193–206. [DOI] [PubMed] [Google Scholar]
- 67. Johnson BT, Huedo‐Medina TB. Depicting estimates using the intercept in meta‐regression models: the moving constant technique. Res Synth Methods. 2011;2:204–220. [DOI] [PMC free article] [PubMed] [Google Scholar]
- 68. Lipsey MW, Wilson DB. The way in which intervention studies have “personality” and why it is important to meta‐analysis. Eval Health Prof. 2001;24:236–254. [DOI] [PubMed] [Google Scholar]
- 69. Brown JC, Huedo‐Medina TB, Pescatello LS, Pescatello SM, Ferrer RA, Johnson BT. Efficacy of exercise interventions in modulating cancer‐related fatigue among adult cancer survivors: a meta‐analysis. Cancer Epidemiol Biomarkers Prev. 2011;20:123–133. [DOI] [PubMed] [Google Scholar]
- 70. Ferrer RA, Huedo‐Medina TB, Johnson BT, Ryan SM, Pescatello LS. Exercise interventions for cancer survivors: a meta‐analysis of quality of life outcomes. Ann Behav Med. 2011;41:32–47. [DOI] [PMC free article] [PubMed] [Google Scholar]
- 71. Brown JC, Huedo‐Medina TB, Pescatello LS, Ryan SM, Pescatello SM, Moker E, LaCroix JM, Ferrer RA, Johnson BT. The efficacy of exercise in reducing depressive symptoms among cancer survivors: a meta‐analysis. PLoS One. 2012;7:e30955. [DOI] [PMC free article] [PubMed] [Google Scholar]
- 72. Horst P. The role of predictor variables which are independent of the criterion. Soc Sci Res Council. 1941;48:431–436. [Google Scholar]
- 73. Cordray DS, Morphy P. Research synthesis and public policy In: Cooper H, Hedges LV, Valentine JC, eds. The Handbook of Research Synthesis and Meta‐Analysis. 2nd ed New York, NY: Russell Sage Foundation; 2009:473–493. [Google Scholar]
- 74. Wilson SJ, Lipsey MW. The effects of school‐based social information processing interventions on aggressive behavior (part I: universal programs. Campbell Syst Rev. 2006;2:5–42. [Google Scholar]
- 75. Valentine JC. Judging the quality of primary research In: Cooper H, Hedges LV, Valentine JC, eds. Handbook of Research Synthesis and Meta‐Analysis. 2nd ed New York, NY: Russell Sage Foundation; 2009:129–146. [Google Scholar]
- 76. Kirsch I, Deacon BJ, Huedo‐Medina TB, Scoboria A, Moore TJ, Johnson BT. Initial severity and antidepressant benefits: a meta‐analysis of data submitted to the Food and Drug Administration. PLoS Med. 2008;5:e45. [DOI] [PMC free article] [PubMed] [Google Scholar]
- 77. Sterne JAC, Egger M, Moher D; The Cochrane Bias Methods Group . Chapter 10: addressing reporting biases In: Higgins JPT, Green S, eds. Cochrane Handbook for Systematic Reviews of Interventions. Version 5.1.0 (updated March 2011). The Cochrane Collaboration; 2011. Available at: www.cochrane-handbook.org. Accessed March 1, 2015. [Google Scholar]
- 78. Begg CB, Mazumdar M. Operating characteristics of a rank correlation test for publication bias. Biometrics. 1994;50:1088–1101. [PubMed] [Google Scholar]
- 79. Egger M, Smith G, Schneider M, Minder C. Bias in meta‐analysis detected by a simple, graphical test. BMJ. 1997;315:629–634. [DOI] [PMC free article] [PubMed] [Google Scholar]
- 80. Viechtbauer W. Conducting meta‐analyses in R with the metafor package. J Stat Softw. 2010;36:1–48. [Google Scholar]
- 81. R Development Core Team . R: A Language and Environment for Statistical Computing. Vienna, Austria: R Foundation for Statistical Computing; 2011. Available at: http://www.R-project.org/. Accessed: March 1, 2015. [Google Scholar]
- 82. Viechtbauer W. Metafor: Meta‐Analysis Package for R. Version 1.9‐5. 2014. http://www.metafor-project.org/doku.php/metafor. Accessed March 1, 2015. [Google Scholar]
- 83. StataCorp . Stata Statistical Software: Release 13. College Station, TX: StataCorp LP; 2013. [Google Scholar]
- 84. Harbord RM, Higgins JPT. Meta‐regression in Stata. Stata Journal. 2008;8:493–519. [Google Scholar]
- 85. Anton MM, Cortez‐Cooper MY, DeVan AE, Neidre DB, Cook JN, Tanaka H. Resistance training increases basal limb blood flow and vascular conductance in aging humans. J Appl Physiol. 2006;101:1351–1355. [DOI] [PubMed] [Google Scholar]
- 86. Arora E, Shenoy S, Sandhu JS. Effects of resistance training on metabolic profile of adults with type 2 diabetes. Indian J Med Res. 2009;129:515–519. [PubMed] [Google Scholar]
- 87. Beck DT, Martin JS, Casey DP, Braith RW. Exercise training improves endothelial function in resistance arteries of young prehypertensives. J Hum Hypertens. 2014;28:303–309. [DOI] [PMC free article] [PubMed] [Google Scholar]
- 88. Carter JR, Ray CA, Downs EM, Cooke WH. Strength training reduces arterial blood pressure but not sympathetic neural activity in young normotensive subjects. J Appl Physiol (1985). 2003;94:2212–2216. Epub 2003 Jan 31. [DOI] [PubMed] [Google Scholar]
- 89. Casey DP, Beck DT, Braith RW. Progressive resistance training without volume increases does not alter arterial stiffness and aortic wave reflection. Exp Biol Med (Maywood). 2007;232:1228–1235. [DOI] [PubMed] [Google Scholar]
- 90. Chaudhary S, Kang MK, Sandhu JS. The effects of aerobic versus resistance training on cardiovascular fitness in obese sedentary females. Asian J Sports Med. 2010;1:177–184. [DOI] [PMC free article] [PubMed] [Google Scholar]
- 91. Conceição MS, Bonganha V, Vechin FC, Berton RPB, Lixandrão ME, Nogueira FRD, de Souza GV, Chacon‐Mikahil MPT, Libardi CA. Sixteen weeks of resistance training can decrease the risk of metabolic syndrome in healthy postmenopausal women. Clin Interv Aging. 2013;8:1221–1228. [DOI] [PMC free article] [PubMed] [Google Scholar]
- 92. Cononie CC, Graves JE, Pollock ML, Phillips MI, Sumners C, Hagberg JM. Effect of exercise training on blood pressure in 70‐ to 79‐yr‐old men and women. Med Sci Sports Exerc. 1991;23:505–511. [PubMed] [Google Scholar]
- 93. Cortez‐Cooper MY, DeVan AE, Anton MM, Farrar RP, Beckwith KA, Todd JS, Tanaka H. Effects of high intensity resistance training on arterial stiffness and wave reflection in women. Am J Hypertens. 2005;18:930–934. [DOI] [PubMed] [Google Scholar]
- 94. Cortez‐Cooper MY, Anton MM, Devan AE, Neidre DB, Cook JN, Tanaka H. The effects of strength training on central arterial compliance in middle‐aged and older adults. Eur J Cardiovasc Prev Rehabil. 2008;15:149–155. [DOI] [PubMed] [Google Scholar]
- 95. Croymans DM, Krell SL, Oh CS, Katiraie M, Lam CY, Harris RA, Roberts CK. Effects of resistance training on central blood pressure in obese young men. J Hum Hypertens. 2014;28:157–164. [DOI] [PMC free article] [PubMed] [Google Scholar]
- 96. Elliott KJ, Sale C, Cable NT. Effects of resistance training and detraining on muscle strength and blood lipid profiles in postmenopausal women. Br J Sports Med. 2002;36:340–344. [DOI] [PMC free article] [PubMed] [Google Scholar]
- 97. Gelecek N, Ilcin N, Subasi SS, Acar S, Demir N, Ormen M. The effects of resistance training on cardiovascular disease risk factors in postmenopausal women: a randomized‐controlled trial. Health Care Women Int. 2012;33:1072–1085. [DOI] [PubMed] [Google Scholar]
- 98. Gerage AM, Forjaz CL, Nascimento MA, Januário RS, Polito MD, Cyrino ES. Cardiovascular adaptations to resistance training in elderly postmenopausal women. Int J Sports Med. 2013;34:806–813. [DOI] [PubMed] [Google Scholar]
- 99. Gurjão ALD, Gonçalves R, Carneiro NH, Ceccato M, Filho JCJ, Gobbi S. Effect of resistance training in blood pressure at rest in normotensive elderly. Rev Bras Med Esporte. 2013;19:160–163. [Google Scholar]
- 100. Harris KA, Holly RG. Physiological response to circuit weight training in borderline hypertensive subjects. Med Sci Sports Exerc. 1987;19:246–252. [PubMed] [Google Scholar]
- 101. Ho SS, Radavelli‐Bagatini S, Dhaliwal SS, Hills AP, Pal S. Resistance, aerobic, and combination training on vascular function in overweight and obese adults. J Clin Hypertens (Greenwich). 2012;14:848–854. [DOI] [PMC free article] [PubMed] [Google Scholar]
- 102. Hu M, Finni T, Zou L, Perhonen M, Sedliak M, Alen M, Cheng S. Effects of strength training on work capacity and parasympathetic heart rate modulation during exercise in physically Inactive men. Int J Sports Med. 2009;30:719–724. [DOI] [PubMed] [Google Scholar]
- 103. Jakovljevic DG, Hallsworth K, Zalewski P, Thoma C, Klawe JJ, Day CP, Newton J, Trenell MI. Resistance exercise improves autonomic regulation at rest and haemodynamic response to exercise in non‐alcoholic fatty liver disease. Clin Sci. 2013;125:143–149. [DOI] [PubMed] [Google Scholar]
- 104. Kawano H, Tanaka H, Miyachi M. Resistance training and arterial compliance: keeping the benefits while minimizing the stiffening. J Hypertens. 2006;24:1753–1759. [DOI] [PubMed] [Google Scholar]
- 105. Lovell DI, Cuneo R, Gass GC. Resistance training reduces the blood pressure response of older men during submaximum aerobic exercise. Blood Press Monit. 2009;14:137–144. [DOI] [PubMed] [Google Scholar]
- 106. Maiorana AJ, Naylor LH, Exterkate A, Swart A, Thijssen DH, Lam K, O'Driscoll G, Green DJ. The impact of exercise training on conduit artery wall thickness and remodeling in chronic heart failure patients. Hypertension. 2011;57:56–62. [DOI] [PubMed] [Google Scholar]
- 107. Miyachi M, Kawano H, Sugawara J, Takahashi K, Hayashi K, Yamazaki K, Tabata I, Tanaka H. Unfavorable effects of resistance training on central arterial compliance: a randomized intervention study. Circulation. 2004;110:2858–2863. [DOI] [PubMed] [Google Scholar]
- 108. Nybo L, Sundstrup E, Jakobsen MD, Mohr M, Hornstrup T, Simonsen L, Bülow J, Randers MB, Nielsen JJ, Aagaard P, Krustrup P. High‐intensity training versus traditional exercise interventions for promoting health. Med Sci Sports Exerc. 2010;42:1951–1958. [DOI] [PubMed] [Google Scholar]
- 109. Okamoto T, Masuhara M, Ikuta K. Effect of low‐intensity resistance training on arterial function. Eur J Appl Physiol. 2011;111:743–748. [DOI] [PubMed] [Google Scholar]
- 110. Oliveira VND, Bessa A, Jorge MLMP, Oliveira RJDS, de Mello MT, De Agostini GG, Jorge PT, Espindola FS. The effect of different training programs on antioxidant status, oxidative stress, and metabolic control in type 2 diabetes. Appl Physiol Nutr Metab. 2012;37:334–344. [DOI] [PubMed] [Google Scholar]
- 111. Olson TP, Dengel DR, Leon AS, Schmitz KH. Changes in inflammatory biomarkers following one‐year of moderate resistance training in overweight women. Int J Obes (Lond). 2007;31:996–1003. [DOI] [PubMed] [Google Scholar]
- 112. Park YH, Song M, Cho BL, Lim JY, Song W, Kim SH. The effects of an integrated health education and exercise program in community‐dwelling older adults with hypertension: a randomized controlled trial. Patient Educ Couns. 2011;82:133–137. [DOI] [PubMed] [Google Scholar]
- 113. Sallinen J, Fogelholm M, Volek JS, Kraemer WJ, Alen M, Häkkinen K. Effects of strength training and reduced training on functional performance and metabolic health indicators in middle‐aged men. Int J Sports Med. 2007;28:815–822. [DOI] [PubMed] [Google Scholar]
- 114. Sarsan A, Ardic F, Ozgen M, Topuz O, Sermez Y. The effects of aerobic and resistance exercises in obese women. Clin Rehabil. 2006;20:773–782. [DOI] [PubMed] [Google Scholar]
- 115. Shaw BS. Resting cardiovascular function improvements in adult men following resistance training. Afr J Phys Health Educ Recreat Dance. 2010;16:402–410. [Google Scholar]
- 116. Sheikholeslami Vatani D, Ahmadi Kani Golzar F. Changes in antioxidant status and cardiovascular risk factors of overweight young men after six weeks supplementation of whey protein isolate and resistance training. Appetite. 2012;59:673–678. [DOI] [PubMed] [Google Scholar]
- 117. Sillanpää E, Häkkinen A, Punnonen K, Häkkinen K, Laaksonen DE. Effects of strength and endurance training on metabolic risk factors in healthy 40 to 65‐year‐old men. Scand J Med Sci Sports. 2009;19:885–895. [DOI] [PubMed] [Google Scholar]
- 118. Sillanpää E, Laaksonen DE, Häkkinen A, Karavirta L, Jensen B, Kraemer WJ, Nyman K, Häkkinen K. Body composition, fitness, and metabolic health during strength and endurance training and their combination in middle‐aged and older women. Eur J Appl Physiol. 2009;106:285–296. [DOI] [PubMed] [Google Scholar]
- 119. Simons R, Andel R. The effects of resistance training and walking on functional fitness in advanced old age. J Aging Health. 2006;18:91–105. [DOI] [PubMed] [Google Scholar]
- 120. Smutok MA, Reece C, Kokkinos PF, Farmer C, Dawson P, Shulman R, DeVane‐Bell J, Patterson J, Charabogos C, Goldberg AP, Hurley BF. Aerobic versus strength training for risk factor intervention in middle‐aged men at high risk for coronary heart disease. Metab, Clin Exp. 1993;42:177–184. [DOI] [PubMed] [Google Scholar]
- 121. Stensvold D, Tjonna AE, Skaug EA, Aspenes S, Stolen T, Wisloff U, Slordahl SA. Strength training versus aerobic interval training to modify risk factors of metabolic syndrome. J Appl Physiol (1985). 2010;108:804–810. [DOI] [PubMed] [Google Scholar]
- 122. Thomas GN, Hong AW, Tomlinson B, Lau E, Lam CW, Sanderson JE, Woo J. Effects of Tai Chi and resistance training on cardiovascular risk factors in elderly Chinese subjects: a 12‐month longitudinal, randomized, controlled intervention study. Clin Endocrinol (Oxf). 2005;63:663–669. [DOI] [PubMed] [Google Scholar]
- 123. Tseng ML, Ho CC, Chen SC, Huang YC, Lai CH, Liaw YP. A simple method for increasing levels of high‐density lipoprotein cholesterol: a pilot study of combination aerobic‐ and resistance‐exercise training. Int J Sport Nutr Exerc Metab. 2013;23:271–281. [DOI] [PubMed] [Google Scholar]
- 124. Tsuzuku S, Kajioka T, Endo H, Abbott RD, Curb JD, Yano K. Favorable effects of non‐instrumental resistance training on fat distribution and metabolic profiles in healthy elderly people. Eur J Appl Physiol. 2007;99:549–555. [DOI] [PubMed] [Google Scholar]
- 125. Van Hoof R, Macor F, Lijnen P, Staessen J, Thijs L, Vanhees L, Fagard R. Effect of strength training on blood pressure measured in various conditions in sedentary men. Int J Sports Med. 1996;17:415–422. [DOI] [PubMed] [Google Scholar]
- 126. Williams AD, Ahuja KD, Almond JB, Robertson IK, Ball MJ. Progressive resistance training might improve vascular function in older women but not in older men. J Sci Med Sport. 2013;16:76–81. [DOI] [PubMed] [Google Scholar]
- 127. Wood RH, Reyes R, Welsch MA, Favaloro‐Sabatier J, Sabatier M, Matthew Lee C, Johnson LG, Hooper PF. Concurrent cardiovascular and resistance training in healthy older adults. Med Sci Sports Exerc. 2001;33:1751–1758. [DOI] [PubMed] [Google Scholar]
- 128. Yoshizawa M, Maeda S, Miyaki A, Misono M, Saito Y, Tanabe K, Kuno S, Ajisaka R. Effect of 12 weeks of moderate‐intensity resistance training on arterial stiffness: a randomised controlled trial in women aged 32–59 years. Br J Sports Med. 2009;43:615–618. [DOI] [PubMed] [Google Scholar]
- 129. Zavanela PM, Crewther BT, Lodo L, Florindo AA, Miyabara EH, Aoki MS. Health and fitness benefits of a resistance training intervention performed in the workplace. J Strength Cond Res. 2012;26:811–817. [DOI] [PubMed] [Google Scholar]
- 130. Pescatello LS; American College of Sports Medicine . ACSM's Guidelines for Exercise Testing and Prescription. 9th ed Philadelphia, PA: Wolters Kluwer/Lippincott Williams & Wilkins Health; 2014. [Google Scholar]
- 131. Chobanian AV, Bakris GL, Black HR, Cushman WC, Green LA, Izzo JL Jr, Jones DW, Materson BJ, Oparil S, Wright JT Jr, Roccella EJ; National Heart, Lung, and Blood Institute Joint National Committee on Prevention, Detection, Evaluation ; Treatment of High Blood Pressure, National High Blood Pressure Education Program Coordinating Committee . The seventh report of the joint national committee on prevention, detection, evaluation, and treatment of high blood pressure: the JNC 7 report. JAMA. 2003;289:2560–2572. [DOI] [PubMed] [Google Scholar]
- 132. Mota MR, Pardono E, Lima LC, Arsa G, Bottaro M, Campbell CS, Simoes HG. Effects of treadmill running and resistance exercises on lowering blood pressure during the daily work of hypertensive subjects. J Strength Cond Res. 2009;23:2331–2338. [DOI] [PubMed] [Google Scholar]
- 133. Melo CM, Alencar Filho AC, Tinucci T, Mion D Jr, Forjaz CL. Postexercise hypotension induced by low‐intensity resistance exercise in hypertensive women receiving captopril. Blood Press Monit. 2006;11:183–189. [DOI] [PubMed] [Google Scholar]
- 134. Corbie‐Smith G, St George DM, Moody‐Ayers S, Ransohoff DF. Adequacy of reporting race/ethnicity in clinical trials in areas of health disparities. J Clin Epidemiol. 2003;56:416–420. [DOI] [PubMed] [Google Scholar]
- 135. Ma IW, Khan NA, Kang A, Zalunardo N, Palepu A. Systematic review identified suboptimal reporting and use of race/ethnicity in general medical journals. J Clin Epidemiol. 2007;60:572–578. [DOI] [PubMed] [Google Scholar]
- 136. Oh SS, Galanter J, Thakur N, Pino‐Yanes M, Barcelo NE, White MJ, de Bruin DM, Greenblatt RM, Bibbins‐Domingo K, Wu AH, Borrell LN, Gunter C, Powe NR, Burchard EG. Diversity in clinical and biomedical research: a promise yet to be fulfilled. PLoS Med. 2015;12:e1001918. [DOI] [PMC free article] [PubMed] [Google Scholar]
- 137. Petkova E, Tarpey T, Huang L, Deng L. Interpreting meta‐regression: application to recent controversies in antidepressants’ efficacy. Stat Med. 2013;32:2875–2892. [DOI] [PMC free article] [PubMed] [Google Scholar]
- 138. Cheung MW, Vijayakumar R. A guide to conducting a meta‐analysis. Neuropsychol Rev. 2016;26:21–28. [DOI] [PubMed] [Google Scholar]
Associated Data
This section collects any data citations, data availability statements, or supplementary materials included in this article.
Supplementary Materials
Data S1. Full search strategy for each of the five electronic databases queried: PubMed, Scopus (including EMBASE), Web of Science, SPORTDiscus, and CINAHL (Cumulative Index to Nursing and Allied Health Literature).
Data S2. Augmented version of the Downs and Black Checklist.
Table S1. Antihypertensive Effects of Dynamic Resistance Training Compared to Control: A Comparison of Weighted Mean Effect Sizes and Tests for Homogeneity for Systolic and Diastolic Blood Pressure Generated using Stata 13.1 vs the Metafor Package in R (k=71)
Table S2. Blood Pressure Response to Dynamic Resistance Training: A Comparison of Multiple Moderator Models Generated Using Stata 13.1 vs the Metafor Package in R
Table S3. General Description of Each Included Study and a Detailed Summary of the Baseline Sample Characteristics, Dynamic Resistance Training and Control Interventions, and Blood Pressure Outcomes (k=71)
Table S4. Summary of the Overall Methodological Study Quality, Individual Quality Items, and Quality Subscales for the Included Dynamic Resistance Training Interventions (k=71) Gauged Using the Augmented Downs and Black Checklist
Table S5. Item‐by‐Item Summary of Methodological Study Quality for the Included Dynamic Resistance Training Intervention (k=71) Gauged Using the Augmented Version of the Downs and Black Checklist
Table S6. Resting Blood Pressure Assessment Methods for Preintervention and Postintervention Measurements (k=71)
Table S7. Antihypertensive Effects of Dynamic Resistance Training vs Control: Weighted Mean Effect Sizes and Test for Homogeneity for Systolic and Diastolic Blood Pressure
Figure S1. Tests for publication bias using Begg and Egger methods: systolic blood pressure.
Figure S2. Tests for publication bias using Begg and Egger methods: diastolic blood pressure.
Figure S3. Contour‐enhanced funnel plots: a visual representation of the effect size distribution for the antihypertensive effects of dynamic resistance training versus nonexercise control.