

Abstract
Background
Hypertension is widely prevalent yet remains uncontrolled in nearly half of US hypertensive adults. Treatment intensification for hypertension reduces rates of major cardiovascular events and all‐cause mortality, but clinical inertia remains a notable impediment to further improving hypertension control. This study examines the likelihood and determinants of treatment intensification with new medication in US ambulatory medical care.
Methods and Results
Using the nationally representative National Ambulatory Medical Care Survey (2005–2012) and National Hospital Ambulatory Medical Care Survey (2005–2011), we identified adult primary care visits with diagnosed hypertension and documented blood pressure exceeding goal targets and assessed the weighted prevalence and odds ratios of treatment intensification by initiation or addition of new medication. Approximately 41.7 million yearly primary care visits (crude N: 14 064, 2005–2012) occurred among US hypertensive adults with documented blood pressure ≥140/90 mm Hg, where treatment intensification may be beneficial. However, only 7.0 million of these visits (95% confidence interval 6.2–7.8 million) received treatment intensification with new medication, a weighted prevalence of 16.8% (15.8% to 17.9%). This proportion was consistently low and decreased over time. This decline was largely driven by decreasing medication initiation levels among patients on no previous hypertension medications from 31.8% (26.0% to 38.4%) in 2007 to 17.4% (14.0% to 21.4%) in 2012, while medication addition levels remained more stable over time.
Conclusions
US hypertensive adults received treatment intensification with new medication in only 1 out of 6 primary care visits, a fraction that is declining over time. A profound increase in intensification remains a vast opportunity to maximally reduce hypertension‐related morbidity and mortality nationwide.
Keywords: blood pressure, hypertension medication, medication addition, medication initiation
Subject Categories: High Blood Pressure, Hypertension, Health Services, Epidemiology, Secondary Prevention
Introduction
Hypertension is widely prevalent and largely manageable yet remains uncontrolled in nearly half of US hypertensive adults.1, 2, 3 Although effective pharmaceutical treatments are readily available and reduce the risk for major cardiovascular diseases,4 inadequate adherence among patients to hypertension medication and the inertia of physicians to intensify treatment contribute to substantial morbidity, mortality, hospitalization, and health care costs.5, 6, 7 Recent studies suggest that treatment intensification improves hypertension management even with suboptimal adherence and reduces risks of cardiovascular events and deaths.8, 9, 10, 11 Specifically, the addition of new medications and dose escalation of existing medications are both considered reasonable approaches for achieving goal blood pressure.4
In defining goal blood pressure, the Seventh and Eighth Joint National Committees4, 12 and the European Society of Hypertension and the European Society of Cardiology guidelines13 have recommended a systolic/diastolic blood pressure (SBP/DBP) target of less than 140/90 mm Hg for the general adult population including those with chronic kidney disease or diabetes mellitus, although the SBP/DBP target for the elderly is less consistent. A recent systematic review and meta‐analysis of 19 trials suggested that intensive blood pressure lowering, including targeting SBP/DBP lower than current recommendations, has further protective effects against major cardiovascular events.14 The recent Systolic Blood Pressure Intervention Trial (SPRINT) showed that with treatment targeting an SBP of less than 120 mm Hg compared with 140 mm Hg, nondiabetic adults aged 50 and above at high risk for cardiovascular events had lower rates of all‐cause mortality and major cardiovascular events15; in prespecified subgroup analysis, this benefit was similarly observed among those aged 75 years or older.16 However, the Heart Outcomes Prevention Evaluation (HOPE)–3 trial found that the addition of candesartan and hydrochlorothiazide did not lower rates of major cardiovascular events in an intermediate‐risk population with high‐normal SBP but no cardiovascular disease.17 These results have generated extensive scientific discussion and popular media attention while potentially resetting goal blood pressure in clinical practice and guidelines on hypertension management.
The lowering of blood pressure targets will inevitably require population‐wide treatment intensification, but the magnitude of this potential change in practice is unknown. In this study we describe the current prevalence and patterns of hypertension treatment intensification with new medication by means of either medication initiation or medication addition at conventional and proposed blood pressure targets. In assessing conventional targets at the SBP/DBP of 140/90 mm Hg, we aim to examine physicians’ current practice in hypertension management; in assessing alternative targets including 120/80 mm Hg, we aim to study the magnitude of potential practice change should lower blood pressure goals be adopted.
Methods
Study Design
We obtained public‐use data from the National Ambulatory Medical Care Survey (NAMCS) between 2005 and 2012 and from the National Hospital Ambulatory Medical Care Survey (NHAMCS) between 2005 and 2011. These 2 US nationally representative multistage stratified probability sample surveys were administered by the National Center for Health Statistics (NCHS) of the Centers for Disease Control and Prevention and collected data on patient visits to non‐federally employed office‐based physicians in direct patient care and to outpatient departments of nonfederal and noninstitutional general and short‐stay hospitals. In the survey design, physicians or hospitals were chosen among 112 primary sampling units used in the National Health Interview Survey; then in NAMCS, individual physicians were surveyed for a systematic random sample of visits in a 1‐week period, and in NHAMCS, outpatient clinics were surveyed for visits in a 4‐week period. This design enables national‐level estimates using survey weights provided by the NCHS.
Available survey data included patient characteristics, reason for visit, continuity of care, vital signs, and medications. In NAMCS the unweighted physician response rates were 61.5%, 58.9%, 61.6%, 59.1%, 62.1%, 58.3%, 54.1%, and 39.3% from 2005 to 2012. In NHAMCS the unweighted outpatient department response rates were 85.4%, 85.6%, 80.2%, 83.3%, 85.3%, and 83.6% from 2005 to 2010 (2011 rate unavailable). Both studies were authorized by Section 306 of the Public Health Service Act and approved by the NCHS Research Ethics Review Board with waivers of patient informed consent. Analyses in this paper were approved with exemption at Beth Israel Deaconess Medical Center. Detailed survey methods are available online.18
Because hypertension guidelines generally recommend confirmation of hypertension diagnosis before treatment, and because hypertension management may not be routinely expected of specialty providers, we primarily focused our analyses on visits from established patients with hypertension diagnoses to primary care physicians, requiring affirmative responses to 3 survey questions: (1) “Are you the patient's primary care physician/provider?” (2) “Has the patient been seen in your practice before?” and (3) “Regardless of the diagnoses written previously, does patient now have hypertension?” In addition, we included only visits that recorded blood pressure readings and the status (“new” or “continued”) of hypertension medication use if any. Last, we excluded pre‐/postsurgery visits and visits related to injury including poisoning and adverse effects of medical treatment, based on survey questions on injury, reason for visit, and diagnosis items, because hypertension medication adjustment may be inappropriate in these scenarios. In this subpopulation of ambulatory medical care visits, we studied the prevalence and odds ratios of hypertension treatment intensification with new medication at various blood pressure levels across a wide range of clinical and demographic groups. For comparison, we also examined visits to cardiovascular specialists and compared treatment intensification to general/family practice and internal medicine physicians in NAMCS, which provides physician specialty information.
Key Variables
We defined treatment intensification with new medication as prescribing a new hypertension medication when blood pressure was elevated above target. An SBP/DBP of 140/90 mm Hg was used as the target level for our main analyses. Hypertension medications were identified using the National Drug Code directory drug classes and the Multum classification of therapeutic classes and included antihypertensives, α‐agonists/α‐blockers, agents for hypertensive emergencies, angiotensin‐converting enzyme inhibitors, antiadrenergic agents, β‐adrenergic blocking agents, calcium channel blocking agents, diuretics, peripheral vasodilators, vasodilators, antihypertensive combinations, angiotensin II inhibitors, and renin inhibitors. Of note, information on medication dose adjustment was not collected in NAMCS or NHAMCS, so this study of treatment intensification examined medication additions or substitutions only.
Other characteristics assessed include sex, age, race/ethnicity (white, non‐Hispanic; black, non‐Hispanic; Hispanic; other), chronic disease diagnoses (cerebrovascular disease, chronic renal failure, diabetes mellitus, and hyperlipidemia), major reason for visit (new problem, <3 month onset; chronic problem, routine; chronic problem, flare‐up; preventive care), total number of existing medications (0, 1, 2, 3, ≥4), total number of visits within the past year (0, 1‐2, 3‐5, ≥6), insurance type (private insurance, Medicare, Medicaid or Children's Health Insurance Program [CHIP], self‐pay, other), and geographic region (Northeast, Midwest, South, West).
Statistical Analysis
NAMCS and NHAMCS data were combined and analyzed using Stata version 14 (StataCorp, College Station, TX), accounting for the multistage probability design and visit weights as reported by NCHS to approximate the demographic distributions of the full US population. We report visit characteristics with 95% confidence intervals (CIs) and the prevalence of treatment intensification with new medication in various clinical and demographic groups and by the status of existing hypertension medication use (yes vs no). In addition, we assessed the crude and adjusted odds ratios of intensification using logistic regression. In multivariable models we accounted for sex, age, race/ethnicity, systolic blood pressure, presence of each chronic condition, major reason for the visit, total number of existing medications, current hypertension medication use, total number of visits within the past year, insurance type, geographic region, and survey year and type. We primarily examined the conventional target SBP/DBP of 140/90 mm Hg but also tested an SBP target of 120 mm Hg and other levels for comparison.
In sensitivity analyses we assessed treatment intensification in the subset of otherwise eligible visits where neither nutrition nor exercise counseling was provided (or ordered) because health education for behavioral risk factor modifications may be attempted before pharmacologic intervention. Last, we examined the rate of treatment intensification in similar visits to cardiovascular specialists and compared it to those seen by general/family practitioners and internists.
The authors had full access to the public data in the study and take responsibility for the data analysis and its integrity.
Results
A total of 287 288 visits were surveyed in NAMCS from 2005 to 2012 and 233 963 in NHAMCS from 2005 to 2011, for a grand total of 521 251 visits. From these, we identified 14 064 visits among hypertensive adults with a documented SBP/DBP ≥140/90 mm Hg and known medication status in a noninjury or –surgery‐related primary care visit; this corresponded to 41.7 million yearly visits. Table 1 lists the characteristics of these visits and by existing hypertension medication use. Women outnumbered men, and about two‐thirds of visits concerned patients aged 50 to 79 and documented systolic blood pressure between 140 and 159 mm Hg. In addition, among people with existing hypertension medication use compared to those without, more had cerebrovascular disease, diabetes mellitus, or hyperlipidemia, were being seen for routine check‐ups of chronic problems (compared to new problems), and were on Medicare (compared to private insurance). We observed no marked differences in age or systolic blood pressure distribution with respect to existing hypertension medication use.
Table 1.
Characteristics of NAMCS and NHAMCS Visits 2005–2012a
| Characteristics | All Visits | Existing Hypertension Medication Use? | |
|---|---|---|---|
| Yes | No | ||
| Crude N | 14 064 | 8871 | 5193 |
| Weighted N | 41 702 385 | 26 305 818 | 15 396 567 |
| Sex | |||
| Female | 58.1 (56.8‐59.4) | 58.1 (56.4‐59.7) | 58.1 (55.9‐60.3) |
| Male | 41.9 (40.6‐43.2) | 41.9 (40.3‐43.6) | 41.9 (39.7‐44.1) |
| Age | |||
| 18 to 49 y | 18.4 (17.2‐19.8) | 15.9 (14.5‐17.3) | 22.9 (20.6‐25.3) |
| 50 to 64 y | 34.5 (33.2‐35.8) | 34.1 (32.4‐35.8) | 35.2 (33.2‐37.2) |
| 65 to 79 y | 31.1 (29.8‐32.5) | 32.2 (30.6‐33.8) | 29.3 (27.4‐31.2) |
| ≥80 y | 15.9 (14.8‐17.1) | 17.8 (16.3‐19.5) | 12.7 (11.2‐14.3) |
| Race/Ethnicity | |||
| White, non‐Hispanic | 68.8 (65.7‐71.7) | 69.3 (65.8‐72.5) | 68.0 (64.4‐71.3) |
| Black, non‐Hispanic | 17.5 (14.8‐20.7) | 17.7 (14.6‐21.3) | 17.3 (14.5‐20.5) |
| Hispanic | 9.0 (7.3‐11.0) | 8.6 (7.0‐10.6) | 9.6 (7.3‐12.4) |
| Other | 4.7 (3.7‐6.1) | 4.4 (3.2‐6.1) | 5.2 (3.8‐7.1) |
| Blood pressure, mm Hg (mean) | |||
| Systolic | 150 (149‐150) | 150 (150‐151) | 149 (148‐150) |
| Diastolic | 85 (84‐85) | 84 (84‐85) | 86 (86‐87) |
| Systolic blood pressure | |||
| 120 to 129 mm Hg | 2.7 (2.3‐3.2) | 2.0 (1.6‐2.4) | 3.9 (3.1‐4.9) |
| 130 to 139 mm Hg | 6.9 (6.2‐7.7) | 6.6 (5.7‐7.5) | 7.5 (6.4‐8.8) |
| 140 to 149 mm Hg | 44.7 (43.2‐46.1) | 44.3 (42.5‐46.1) | 45.4 (43.1‐47.6) |
| 150 to 159 mm Hg | 21.9 (20.9‐22.9) | 22.5 (21.0‐24.0) | 20.9 (19.2‐22.6) |
| 160 to 169 mm Hg | 13.0 (12.1‐14.0) | 13.8 (12.6‐15.2) | 11.5 (10.3‐12.9) |
| 170 to 179 mm Hg | 5.2 (4.7‐5.8) | 5.1 (4.5‐5.9) | 5.4 (4.4‐6.5) |
| ≥180 mm Hg | 5.1 (4.5‐5.8) | 5.3 (4.5‐6.2) | 4.8 (4.0‐5.8) |
| Chronic condition | |||
| Cerebrovascular disease | 4.1 (3.6‐4.7) | 4.8 (4.1‐5.6) | 3.0 (2.4‐3.8) |
| Chronic renal failure | 3.6 (3.1‐4.3) | 4.0 (3.4‐4.8) | 2.9 (2.1‐4.0) |
| Diabetes mellitus | 28.7 (27.1‐30.3) | 30.9 (29.0‐32.9) | 24.9 (23.1‐26.9) |
| Hyperlipidemia | 42.5 (40.3‐44.9) | 47.0 (44.4‐49.6) | 35.0 (32.3‐37.7) |
| Major reason for the visit | |||
| New problem (<3 months) | 26.1 (24.6‐27.6) | 22.1 (20.4‐23.9) | 32.8 (30.7‐35.0) |
| Chronic problem, routine | 47.6 (45.4‐49.8) | 52.5 (50.1‐54.9) | 39.2 (36.0‐42.6) |
| Chronic problem, flare‐up | 9.6 (8.4‐10.8) | 8.6 (7.5‐9.9) | 11.1 (9.2‐13.3) |
| Preventive care | 15.4 (14.1‐16.9) | 15.6 (14.1‐17.2) | 15.2 (13.4‐17.2) |
| Total number of existing medications | |||
| 0 | 20.8 (19.1‐22.7) | — | 56.4 (53.4‐59.2) |
| 1 | 12.2 (11.1‐13.3) | 10.6 (9.2‐12.2) | 14.9 (13.4‐16.4) |
| 2 | 11.5 (10.6‐12.5) | 12.3 (11.1‐13.6) | 10.2 (8.8‐11.8) |
| 3 | 11.1 (10.2‐12.1) | 14.0 (12.8‐15.2) | 6.2 (5.2‐7.4) |
| ≥4 | 44.4 (42.1‐46.7) | 63.1 (60.9‐65.3) | 12.4 (10.8‐14.2) |
| Total number of visits within the past year | |||
| 0 | 3.6 (3.2‐4.2) | 3.1 (2.5‐3.7) | 4.6 (3.8‐5.6) |
| 1 to 2 | 26.7 (25.4‐28.0) | 25.7 (24.1‐27.3) | 28.5 (26.6‐30.5) |
| 3 to 5 | 38.9 (37.4‐40.5) | 39.7 (37.9‐41.4) | 37.7 (35.3‐40.2) |
| ≥6 | 30.7 (28.9‐32.5) | 31.6 (29.6‐33.6) | 29.2 (26.8‐31.7) |
| Expected source of payment | |||
| Private insurance | 39.9 (38.1‐41.8) | 37.4 (35.2‐39.7) | 44.2 (41.6‐46.9) |
| Medicare | 42.3 (40.5‐44.2) | 45.0 (42.9‐47.2) | 37.7 (34.9‐40.6) |
| Medicaid or CHIP | 8.3 (7.3‐9.5) | 8.4 (7.3‐9.7) | 8.2 (6.6‐10.2) |
| Self‐pay | 3.7 (3.2‐4.3) | 3.4 (2.9‐4.0) | 4.2 (3.4‐5.3) |
| Other | 5.7 (4.8‐6.7) | 5.7 (4.7‐7.0) | 5.6 (4.6‐6.8) |
| US census region | |||
| Northeast | 16.2 (13.2‐19.8) | 16.6 (13.3‐20.5) | 15.5 (12.5‐19.1) |
| Midwest | 25.8 (21.9‐30.1) | 26.5 (22.4‐31.1) | 24.6 (20.2‐29.7) |
| South | 40.9 (36.7‐45.3) | 40.4 (35.9‐45.1) | 41.7 (36.8‐46.8) |
| West | 17.1 (14.3‐20.3) | 16.5 (13.6‐19.9) | 18.1 (14.9‐22.0) |
CHIP indicates Children's Health Insurance Program; NAMCS, National Ambulatory Medical Care Survey; NHAMCS, National Hospital Ambulatory Medical Care Survey.
Data are weighted % prevalence (or weighted means for blood pressure) with 95% confidence interval in parentheses among adult primary care visits with diagnosed hypertension and measured blood pressure at or above 140/90 mm Hg.
Prevalence of Treatment Intensification With New Medication in the United States
Among these nearly 42 million visits, treatment intensification, including medication initiation and medication addition, occurred in only 7.0 million (95% CI 6.2–7.8 million), a weighted prevalence of 16.8% (15.8% to 17.9%). This proportion decreased from 19.3% (16.0% to 23.1%) in 2007 to a nadir of 12.3% (10.4% to 14.5%) in 2012, largely driven by a drop of hypertension medication initiation from 31.8% (26.0% to 38.4%) in 2007 to 17.4% (14.0% to 21.4%) in 2012 (Figure 1, P=0.014 for trend over time). The overall weighted prevalence of treatment intensification in the group without existing hypertension medication use (medication initiation) was 26.4% (24.4% to 28.5%), compared with 11.2% (10.1% to 12.4%) in the group already on hypertension medication (medication addition).
Figure 1.
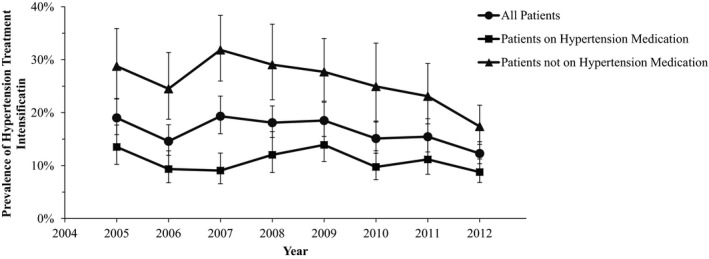
Prevalence of hypertension treatment intensification in the United States 2005–2012.
Even among visits in which providers offered neither nutrition nor exercise counseling, the weighted prevalence of medication initiation was only 25.8% (23.6% to 28.1%), and that of medication addition was only 11.4% (10.1% to 12.7%). Of the 5.1 million annual visits seen by cardiologists (crude N 2319, 2005–2012), medication initiation occurred in 27.2% (22.1% to 33.0%) of these visits, and medication addition in 14.1% (12.1% to 16.3%), which was 1.51 (1.21–1.89; adjusted odds ratio 1.68 [1.32–2.13]) times more likely than that in those seen by general/family practice physicians; there was no significant difference seen in intensification between cardiologists and internists.
Patterns of Treatment Intensification in Clinical and Demographic Subgroups
Table 2 provides weighted prevalence and odds ratios of treatment intensification with new medication by visit characteristics. Table 3 provides similar data by existing hypertension medication use. Among the clinical and demographic characteristics that were assessed, existing hypertension medication use predicted the lowest odds for treatment intensification with new medication.
Table 2.
Hypertension Treatment Intensification by Patient Characteristics in NAMCS and NHAMCS Visits 2005–2012a
| Characteristics | Prevalence | Crude OR | Adjusted ORb |
|---|---|---|---|
| Sex | |||
| Female | 15.4 (14.1‐16.8) | 0.79 (0.69‐0.90) | 0.81 (0.70‐0.95) |
| Male | 18.7 (17.3‐20.2) | Referent | Referent |
| Age | |||
| 18 to 49 y | 21.6 (19.3‐24.2) | 0.87 (0.83‐0.92) per a 10‐year increase | 0.91 (0.86‐0.96) per a 10‐year increase |
| ≥50 y | 15.7 (14.6‐16.8) | ||
| Race/Ethnicity | |||
| White, non‐Hispanic | 16.1 (14.9‐17.4) | Referent | Referent |
| Black, non‐Hispanic | 18.9 (16.3‐21.9) | 1.22 (0.99‐1.50) | 1.20 (0.95‐1.50) |
| Hispanic | 16.8 (13.8‐20.2) | 1.05 (0.82‐1.35) | 1.01 (0.77‐1.33) |
| Other | 19.4 (13.8‐26.5) | 1.26 (0.83‐1.91) | 1.24 (0.81‐1.91) |
| Systolic blood pressure | |||
| 120 to 129 mm Hg | 11.8 (6.7‐20.1) | 0.90 (0.47‐1.69) | 0.60 (0.30‐1.21) |
| 130 to 139 mm Hg | 14.1 (10.9‐18.0) | 1.10 (0.82‐1.47) | 0.91 (0.67‐1.22) |
| 140 to 149 mm Hg | 13.0 (11.8‐14.4) | Referent | Referent |
| 150 to 159 mm Hg | 17.2 (15.2‐19.4) | 1.39 (1.15‐1.68) | 1.48 (1.21‐1.79) |
| 160 to 169 mm Hg | 21.7 (18.9‐24.8) | 1.85 (1.52‐2.26) | 2.07 (1.68‐2.55) |
| 170 to 179 mm Hg | 27.3 (22.1‐33.3) | 2.51 (1.84‐3.44) | 2.67 (1.85‐3.85) |
| ≥180 mm Hg | 32.1 (26.2‐38.6) | 3.16 (2.33‐4.29) | 3.61 (2.62‐4.98) |
| Chronic condition | |||
| Cerebrovascular disease | 16.1 (11.3‐22.4) | 0.95 (0.63‐1.43) | 1.23 (0.78‐1.92) |
| Chronic renal failure | 18.1 (12.9‐24.6) | 1.09 (0.74‐1.62) | 1.34 (0.89‐2.02) |
| Diabetes mellitus | 13.6 (12.0‐15.4) | 0.71 (0.61‐0.84) | 0.77 (0.64‐0.93) |
| Hyperlipidemia | 14.9 (13.4‐16.4) | 0.78 (0.67‐0.91) | 1.01 (0.86‐1.18) |
| Major reason for the visit | |||
| New problem (<3 months) | 17.1 (15.1‐19.3) | 1.01 (0.84‐1.20) | 0.75 (0.62‐0.92) |
| Chronic problem, routine | 17.0 (15.5‐18.6) | Referent | Referent |
| Chronic problem, flare‐up | 15.9 (12.9‐19.4) | 0.92 (0.72‐1.17) | 0.77 (0.57‐1.03) |
| Preventive care | 15.6 (13.1‐18.5) | 0.90 (0.72‐1.14) | 0.76 (0.60‐0.97) |
| Total number of existing medications | |||
| 0 | 27.9 (24.8‐31.1) | 1.57 (1.22‐2.03) | 1.09 (0.82‐1.44) |
| 1 | 19.7 (16.8‐23.0) | Referent | Referent |
| 2 | 17.0 (13.7‐20.8) | 0.83 (0.59‐1.17) | 0.98 (0.69‐1.39) |
| 3 | 14.7 (12.0‐17.9) | 0.70 (0.52‐0.94) | 0.97 (0.70‐1.33) |
| ≥4 | 11.3 (9.9‐12.8) | 0.52 (0.40‐0.66) | 0.89 (0.68‐1.18) |
| Existing hypertension medication use | 11.2 (10.1‐12.4) | 0.35 (0.30‐0.41) | 0.37 (0.30‐0.46) |
| Total number of visits within the past year | |||
| 0 | 23.3 (17.8‐29.9) | Referent | Referent |
| 1 to 2 | 21.4 (19.3‐23.7) | 0.90 (0.62‐1.30) | 1.04 (0.69‐1.54) |
| 3 to 5 | 15.6 (14.0‐17.3) | 0.61 (0.43‐0.86) | 0.74 (0.51‐1.08) |
| ≥6 | 13.5 (11.6‐15.8) | 0.51 (0.35‐0.76) | 0.66 (0.43‐1.01) |
| Expected source of payment | |||
| Private insurance | 19.3 (17.5‐21.2) | Referent | Referent |
| Medicare | 14.1 (12.4‐16.0) | 0.69 (0.56‐0.84) | 0.88 (0.68‐1.13) |
| Medicaid or CHIP | 13.4 (9.9‐17.8) | 0.65 (0.45‐0.93) | 0.69 (0.47‐1.01) |
| Self‐pay | 21.9 (17.2‐27.4) | 1.17 (0.83‐1.64) | 0.99 (0.69‐1.44) |
| Other | 21.1 (17.0‐25.9) | 1.12 (0.82‐1.51) | 1.13 (0.82‐1.55) |
| US census region | |||
| Northeast | 14.6 (12.1‐17.4) | Referent | Referent |
| Midwest | 17.2 (15.1‐19.6) | 1.22 (0.94‐1.59) | 1.18 (0.91‐1.54) |
| South | 17.0 (15.4‐18.8) | 1.20 (0.95‐1.53) | 1.09 (0.86‐1.38) |
| West | 17.7 (15.5‐20.1) | 1.26 (0.97‐1.63) | 1.16 (0.88‐1.55) |
CHIP indicates Children's Health Insurance Program; NAMCS, National Ambulatory Medical Care Survey; NHAMCS, National Hospital Ambulatory Medical Care Survey; OR, odds ratio.
Data are weighted % prevalence or OR with 95% confidence interval in parentheses among adult primary care visits with diagnosed hypertension and measured blood pressure at or above 140/90 mm Hg.
The adjusted model accounted for all listed characteristics in this table, in addition to survey year and type.
Table 3.
Hypertension Treatment Intensification by Patient Characteristics and Existing Medication Status in NAMCS and NHAMCS Visits 2005–2012a
| Characteristics | With Existing Hypertension Medication Use | Without Existing Hypertension Medication Use | ||
|---|---|---|---|---|
| Prevalence | Adjusted ORb | Prevalence | Adjusted ORb | |
| Sex | ||||
| Female | 10.3 (8.9‐12.0) | 0.78 (0.61‐0.99) | 24.1 (21.4‐26.9) | 0.82 (0.66‐1.03) |
| Male | 12.4 (10.8‐14.1) | Referent | 29.6 (26.9‐32.4) | Referent |
| Age | ||||
| 18 to 49 y | 11.7 (9.1‐14.8) | 0.98 (0.89‐1.09) per a 10‐year increase | 33.5 (29.8‐37.3) | 0.88 (0.81‐0.95) per a 10‐year increase |
| ≥50 y | 11.1 (10.0‐12.3) | 24.3 (22.0‐26.6) | ||
| Race/Ethnicity | ||||
| White, non‐Hispanic | 10.5 (9.3‐11.8) | Referent | 25.9 (23.4‐28.5) | Referent |
| Black, non‐Hispanic | 13.8 (10.7‐17.6) | 1.47 (1.10‐1.96) | 27.9 (23.6‐32.8) | 1.06 (0.76‐1.48) |
| Hispanic | 10.3 (7.2‐14.5) | 0.97 (0.62‐1.52) | 26.7 (20.5‐34.0) | 1.03 (0.70‐1.51) |
| Other | 13.9 (8.5‐22.0) | 1.26 (0.78‐2.04) | 27.4 (18.0‐39.3) | 1.11 (0.59‐2.09) |
| Systolic blood pressure | ||||
| 120 to 129 mm Hg | 7.2 (2.1‐21.3) | 0.77 (0.21‐2.86) | 15.9 (8.6‐27.4) | 0.51 (0.23‐1.13) |
| 130 to 139 mm Hg | 6.8 (4.3‐10.7) | 0.75 (0.45‐1.27) | 24.9 (18.5‐32.8) | 1.00 (0.66‐1.52) |
| 140 to 149 mm Hg | 8.3 (6.9‐9.9) | Referent | 20.9 (18.4‐23.7) | Referent |
| 150 to 159 mm Hg | 11.1 (8.9‐13.7) | 1.38 (1.00‐1.91) | 28.5 (24.3‐33.0) | 1.63 (1.24‐2.16) |
| 160 to 169 mm Hg | 15.4 (12.7‐18.5) | 2.00 (1.49‐2.68) | 34.6 (28.7‐41.1) | 2.25 (1.64‐3.09) |
| 170 to 179 mm Hg | 23.4 (17.6‐30.5) | 3.27 (2.14‐4.99) | 33.7 (24.7‐44.0) | 1.99 (1.18‐3.36) |
| ≥180 mm Hg | 21.2 (15.1‐28.8) | 2.94 (1.78‐4.86) | 52.7 (42.7‐62.5) | 4.67 (3.04‐7.19) |
| Chronic condition | ||||
| Cerebrovascular disease | 15.7 (10.4‐22.9) | 1.54 (0.95‐2.50) | 17.3 (10.1‐27.9) | 0.70 (0.35‐1.41) |
| Chronic renal failure | 15.3 (10.2‐22.3) | 1.43 (0.86‐2.37) | 24.5 (13.3‐40.8) | 1.32 (0.60‐2.92) |
| Diabetes mellitus | 9.9 (8.2‐11.8) | 0.86 (0.69‐1.08) | 21.5 (18.1‐25.2) | 0.75 (0.57‐1.00) |
| Hyperlipidemia | 11.1 (9.5‐12.8) | 1.13 (0.90‐1.42) | 23.5 (20.6‐26.7) | 0.91 (0.73‐1.14) |
| Major reason for the visit | ||||
| New problem (<3 months) | 10.8 (8.7‐13.4) | 0.93 (0.70‐1.24) | 24.3 (21.1‐27.9) | 0.62 (0.46‐0.82) |
| Chronic problem, routine | 11.4 (10.0‐13.1) | Referent | 29.7 (26.2‐33.6) | Referent |
| Chronic problem, flare‐up | 14.7 (11.2‐19.1) | 1.29 (0.87‐1.91) | 17.4 (12.4‐23.9) | 0.45 (0.29‐0.70) |
| Preventive care | 8.6 (6.4‐11.6) | 0.71 (0.49‐1.01) | 27.9 (22.9‐33.6) | 0.76 (0.55‐1.06) |
| Total number of existing medications | ||||
| 0 | — | — | 27.9 (24.8‐31.1) | 1.33 (0.97‐1.83) |
| 1 | 16.7 (13.2‐20.8) | Referent | 23.5 (18.9‐28.7) | Referent |
| 2 | 12.8 (9.8‐16.5) | 0.74 (0.49‐1.12) | 25.7 (18.5‐34.4) | 1.22 (0.73‐2.04) |
| 3 | 13.4 (10.5‐17.0) | 0.76 (0.50‐1.14) | 19.9 (14.5‐26.7) | 1.03 (0.64‐1.66) |
| ≥4 | 9.5 (8.1‐11.1) | 0.50 (0.34‐0.73) | 26.9 (22.3‐32.0) | 1.57 (1.04‐2.39) |
| Total number of visits within the past year | ||||
| 0 | 12.2 (6.7‐21.1) | Referent | 36.1 (27.4‐45.8) | Referent |
| 1 to 2 | 12.1 (9.6‐15.0) | 1.07 (0.51‐2.25) | 35.8 (32.0‐39.8) | 1.03 (0.61‐1.74) |
| 3 to 5 | 11.1 (9.5‐12.8) | 0.96 (0.49‐1.89) | 23.7 (20.7‐27.0) | 0.63 (0.38‐1.03) |
| ≥6 | 10.6 (8.5‐13.1) | 0.96 (0.47‐1.98) | 19.0 (15.5‐23.2) | 0.48 (0.28‐0.83) |
| Expected source of payment | ||||
| Private insurance | 10.9 (9.2‐12.9) | Referent | 31.5 (28.5‐34.7) | Referent |
| Medicare | 11.6 (9.9‐13.6) | 1.11 (0.78‐1.59) | 19.2 (15.9‐22.8) | 0.69 (0.50‐0.95) |
| Medicaid or CHIP | 8.8 (4.9‐15.5) | 0.77 (0.41‐1.47) | 21.4 (16.8‐26.8) | 0.68 (0.46‐0.99) |
| Self‐pay | 10.9 (7.2‐16.1) | 0.87 (0.52‐1.46) | 37.0 (28.5‐46.5) | 1.13 (0.69‐1.85) |
| Other | 13.7 (9.7‐19.0) | 1.25 (0.77‐2.03) | 33.8 (26.0‐42.5) | 1.07 (0.72‐1.59) |
| US census region | ||||
| Northeast | 8.8 (6.4‐12.1) | Referent | 25.1 (20.1‐30.9) | Referent |
| Midwest | 12.4 (10.2‐15.0) | 1.40 (0.92‐2.12) | 26.2 (21.5‐31.6) | 1.08 (0.73‐1.59) |
| South | 10.9 (9.1‐12.8) | 1.17 (0.80‐1.71) | 27.2 (24.5‐30.2) | 1.09 (0.79‐1.50) |
| West | 12.5 (10.2‐15.3) | 1.45 (0.95‐2.22) | 25.7 (21.6‐30.3) | 0.99 (0.66‐1.50) |
CHIP indicates Children's Health Insurance Program; NAMCS, National Ambulatory Medical Care Survey; NHAMCS, National Hospital Ambulatory Medical Care Survey; OR, odds ratio.
Data are weighted % prevalence or OR with 95% confidence interval in parentheses among adult primary care visits with diagnosed hypertension and measured blood pressure at or above 140/90 mm Hg.
The adjusted model accounted for all listed characteristics in this table, in addition to survey year and type.
Among all visits, female sex, older age, lower systolic blood pressure (yet higher than 140 mm Hg), and diabetes mellitus diagnosis were significantly associated with lower likelihood of treatment intensification, although no difference was found in race/ethnicity, diagnosis of cerebrovascular disease or chronic renal failure, or geographic regions (Table 2). On adjustment, visits for new problems and preventive care became significant for lower likelihood of intensification, compared with routine check‐ups of chronic problems (Table 2).
These patterns were generally observed in both people with existing hypertension medication use and those without. There were, however, some apparent differences. Among adults with existing hypertension medication use, non‐Hispanic blacks were more likely to receive medication addition, whereas individuals on 4 or more existing medications were less likely to receive medication addition (Table 3). In contrast, among those without existing hypertension medication use, individuals on 4 or more existing medications were more likely to receive medication initiation (Table 3). In addition, in those already taking hypertension medication, medication addition occurred in 11.5% (9.1% to 14.6%) of those aged 80 and above, compared to 10.6% (8.9% to 12.6%) in those aged 50 to 64. In contrast, medication initiation occurred in 17.4% (12.1% to 24.5%) of those aged 80 and above, compared to 27.9% (24.7% to 31.2%) in those aged 50 to 64.
Prevalence and Patterns of Treatment Intensification at Different Blood Pressure Levels
We assessed treatment intensification with new medication at several different SBP levels by clinical and demographic characteristics (Figure 2). Overall, among 88.4 million yearly visits from hypertensive adults with a documented SBP ≥120 mm Hg, only 9.7 million received treatment intensification. This corresponds to a weighted prevalence of 11.0% (10.4% to 11.7%), which was particularly low among people aged 50 and above (10.1%; 9.5% to 10.8%), compared with younger adults (15.2%; 13.6% to 16.9%). As expected, intensification was more likely with higher levels of measured blood pressures, although prevalence only reached 25.2% (22.8% to 27.9%) even among visits with an SBP ≥160 mm Hg, corresponding to merely 2.5 out of 9.7 million visits annually where treatment intensification could have occurred.
Figure 2.
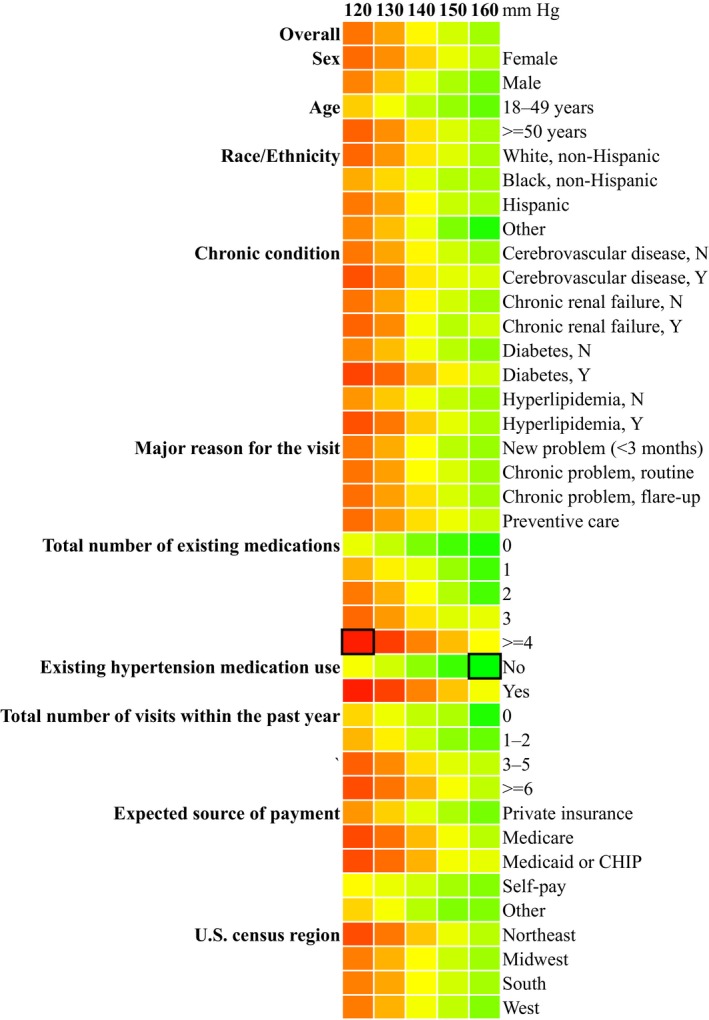
Weighted prevalence of hypertension treatment intensification at different systolic blood pressure levels by patient characteristics in NAMCS and NHAMCS visits 2005–2012. Data are color‐coded based on weighted prevalence from the lowest (red) to the highest (green). The minimum (6.9%) and the maximum (38.4%) are indicated with dark squares. Numbers are calculated among adult primary care visits with diagnosed hypertension and measured blood pressure at or above listed systolic blood pressure levels. CHIP indicates Children's Health Insurance Program; NAMCS, National Ambulatory Medical Care Survey; NHAMCS, National Hospital Ambulatory Medical Care Survey.
Discussion
In this study of US ambulatory medical care visits, hypertension treatment intensification with new medication occurred in only 1 out of 6 visits to a primary care physician. This low prevalence of intensification was observed across a wide variety of clinical and demographic groups and, perhaps most disturbingly, decreased over time, particularly for hypertension medication initiation. The driving force of this decline is unclear, but it may partly result from the competing demand on primary care physicians to address multiple chronic conditions and more medication needs per patient in addition to a growing number of professional society guideline recommendations, despite little change in per‐visit time with patients.19, 20 In addition, the variation in the trends of medication initiation and addition remains to be explained. Nonetheless, our results suggest that a physician treatment decision, specifically intensification with new medication, remains an important opportunity at the clinical visit level to further blood pressure control.
To our knowledge, this study is the first to examine national trends in clinical inertia for hypertension treatment. Our results cast a somewhat different light on the national problem of hypertension than previous studies. The National Health and Nutrition Examination Surveys3, 21, 22 have reported population‐wide improvement in hypertension control for a similar time period. However, this improvement may reflect poorly understood underlying population trends in blood pressure more than better control due to medication per se.23, 24 Put differently, our results at the visit level provide insight into the substantial and apparently growing clinical challenge of therapeutic inertia, whereas other approaches better address the dietary, environmenttal, and clinical contributions to blood pressure nationwide. Nonetheless, further research is needed to reconcile the apparent discrepancy between sustained treatment inertia and improved control of hypertension nationally.
In assessment of clinical and demographic subgroups, we did not find significant racial disparities in treatment intensification, except for higher adjusted odds for intensification among non‐Hispanic blacks than whites, consistent with some25, 26 but not all27 reports in the literature. We observed lower prevalence and odds of treatment intensification in older adults; this may result from a relative lack of evidence supporting a goal SBP less than 150 mm Hg in the elderly28, 29 until the recent SPRINT results.15, 16 In contrast, for people with diabetes mellitus, a goal SBP/DBP of 130/80 mm Hg was recommended in 2003,12 and yet treatment intensification from 2005 to 2012 among diabetic adults remained low even compared to those without diabetes mellitus. This appears concerning because diabetic patients commonly require at least 2 or 3 hypertension medications to achieve the recommended blood pressure,30, 31, 32 even though the specific level of goal blood pressure in this population remains a focus of discussion.4, 15, 33, 34
To achieve lower goal blood pressure, a dramatic increase in treatment intensification appears to be necessary. Of note, although the HOPE‐3 trial did not seem to support treatment intensification among intermediate‐risk patients without cardiovascular disease, the study was not designed to test lower blood pressure targets and cannot exclude the possibility of greater effectiveness with further reduction in blood pressure, as acknowledged by its authors.17 Given the low prevalence of intensification currently, it remains important to understand the reasons of clinical inertia, a topic that has been widely reviewed.35, 36, 37 Efforts to improve treatment inertia are apt to require multidimensional approaches, including cultural shifts led by medical opinion leaders, automated reminders at the visit level, and more widespread integration of pharmacists into primary care and hypertension management.36, 38, 39 Regardless of the methods used, a substantial effort will be needed to mobilize the forces necessary to overcome clinical inertia, given that opportunities for intensification are so often missed.
Last, it should be noted that clinical inaction may reflect appropriate care in certain circumstances40; these include prior visits with satisfactory blood pressure readings, side effects from previously prescribed hypertensive drugs that preclude new options, patients’ informed preference against intensified treatment, and the initiation of lifestyle interventions such as diet and exercise, particularly given low adherence to guidelines.41 Interestingly, our results showed that even among visits where lifestyle interventions were not attempted, the prevalence of treatment intensification was not appreciably different from that among all visits. Nonetheless, lifestyle modifications and patient engagement, as with organizational interventions and health system improvement, are crucial for improving and maintaining hypertension control35, 36, 37, 42 in addition to timely and appropriate treatment intensification with new medication.
Our study has important strengths but also limitations. The lack of data on medication dose contributes to underestimation of true treatment intensification, which would include dose escalation, but this does not affect estimates of medication initiation, which have been consistently low and declining over time. Furthermore, medication addition may have benefits over dose escalation including higher efficacy and fewer side effects,43, 44 and, in one cohort study of patients with diabetes mellitus, addition was ~3 times more common than dose escalation.45 Indeed, an average of 1 additional medication is needed to achieve an SBP target of 120 mm Hg,15 and multiple additions are typically necessary for people with common chronic conditions like diabetes mellitus30, 31, 32 and chronic kidney disease.46, 47
NAMCS and NHAMCS collected single blood pressure measurements; repeated blood pressure measures at multiple visits would have allowed us to estimate clinical inertia across groups of visits rather than single visits, where clinical uncertainty may be greater.48, 49 Nonetheless, the very low rates of intensification observed here suggest that 5 or more visits with elevated blood pressure occur before 1 results in intensification. Furthermore, limited information on clinical history and cardiovascular risk profile precluded us from extensive considerations of the clinical context in each visit, but we deliberately only included patients with diagnosed hypertension, who would likely warrant treatment, and not those with an isolated blood pressure elevation. Because we did not include subjects with undiagnosed hypertension, the true burden of undertreated hypertension is undoubtedly much larger than estimated here. Last, our results may be influenced by a change in the 2012 NAMCS that emphasized automated data collection by trained Census personnel, although formal evaluation by the NCHS suggests that this introduced little or no bias into its estimates.50
In summary, this study shows that among hypertensive adults in the United States with blood pressure over goal targets, treatment intensification with new medication occurs in only 17% of primary care visits. Given recent evidence supporting a lower goal blood pressure target, as many as 88 million yearly visits from hypertensive adults may potentially benefit from treatment intensification, but only 9.7 million currently receive new hypertension medication. Timely and appropriate intensification may markedly improve hypertension‐related morbidity and mortality nationwide, but this will require a profound increase in the likelihood of treatment intensification in physician practice while overcoming widespread and often persistent clinical inertia.
Disclosures
None.
(J Am Heart Assoc. 2016;5:e004188 doi: 10.1161/JAHA.116.004188)
References
- 1. Nwankwo T, Yoon SS, Burt V, Gu Q. Hypertension among adults in the United States: National Health and Nutrition Examination Survey, 2011–2012. NCHS data brief, no 133. Hyattsville, MD: National Center for Health Statistics. 2013. [PubMed] [Google Scholar]
- 2. Mozaffarian D, Benjamin EJ, Go AS, Arnett DK, Blaha MJ, Cushman M, de Ferranti S, Després J‐P, Fullerton HJ, Howard VJ, Huffman MD, Judd SE, Kissela BM, Lackland DT, Lichtman JH, Lisabeth LD, Liu S, Mackey RH, Matchar DB, McGuire DK, Mohler ER, Moy CS, Muntner P, Mussolino ME, Nasir K, Neumar RW, Nichol G, Palaniappan L, Pandey DK, Reeves MJ, Rodriguez CJ, Sorlie PD, Stein J, Towfighi A, Turan TN, Virani SS, Willey JZ, Woo D, Yeh RW, Turner MB; on behalf of the American Heart Association Statistics Committee and Stroke Statistics Subcommittee . Heart disease and stroke statistics—2015 update: a report from the American Heart Association. Circulation. 2015;131:e29–e322. [DOI] [PubMed] [Google Scholar]
- 3. Yoon SS, Gu Q, Nwankwo T, Wright JD, Hong Y, Burt V. Trends in blood pressure among adults with hypertension: United States, 2003 to 2012. Hypertension. 2015;65:54–61. [DOI] [PMC free article] [PubMed] [Google Scholar]
- 4. James PA, Oparil S, Carter BL, Cushman WC, Dennison‐Himmelfarb C, Handler J, Lackland DT, LeFevre ML, MacKenzie TD, Ogedegbe O, Smith SC Jr, Svetkey LP, Taler SJ, Townsend RR, Wright JT Jr, Narva AS, Ortiz E. 2014 evidence‐based guideline for the management of high blood pressure in adults: report from the panel members appointed to the Eighth Joint National Committee (JNC 8). JAMA. 2014;311:507–520. [DOI] [PubMed] [Google Scholar]
- 5. Osterberg L, Blaschke T. Adherence to medication. N Engl J Med. 2005;353:487–497. [DOI] [PubMed] [Google Scholar]
- 6. Sokol MC, McGuigan KA, Verbrugge RR, Epstein RS. Impact of medication adherence on hospitalization risk and healthcare cost. Med Care. 2005;43:521–530. [DOI] [PubMed] [Google Scholar]
- 7. Cummings DM, Letter AJ, Howard G, Howard VJ, Safford MM, Prince V, Muntner P. Medication adherence and stroke/TIA risk in treated hypertensives: results from the REGARDS study. J Am Soc Hypertens. 2013;7:363–369. [DOI] [PMC free article] [PubMed] [Google Scholar]
- 8. Rose AJ, Berlowitz DR, Manze M, Orner MB, Kressin NR. Intensifying therapy for hypertension despite suboptimal adherence. Hypertension. 2009;54:524–529. [DOI] [PMC free article] [PubMed] [Google Scholar]
- 9. Maddox TM, Ross C, Tavel HM, Lyons EE, Tillquist M, Ho PM, Rumsfeld JS, Margolis KL, O'Connor PJ, Selby JV, Magid DJ. Blood pressure trajectories and associations with treatment intensification, medication adherence, and outcomes among newly diagnosed coronary artery disease patients. Circ Cardiovasc Qual Outcomes. 2010;3:347–357. [DOI] [PMC free article] [PubMed] [Google Scholar]
- 10. Daugherty SL, Powers JD, Magid DJ, Masoudi FA, Margolis KL, O'Connor PJ, Schmittdiel JA, Ho PM. The association between medication adherence and treatment intensification with blood pressure control in resistant hypertension. Hypertension. 2012;60:303–309. [DOI] [PMC free article] [PubMed] [Google Scholar]
- 11. Xu W, Goldberg SI, Shubina M, Turchin A. Optimal systolic blood pressure target, time to intensification, and time to follow‐up in treatment of hypertension: population based retrospective cohort study. BMJ. 2015;350:h158. [DOI] [PMC free article] [PubMed] [Google Scholar]
- 12. Chobanian AV, Bakris GL, Black HR, Cushman WC, Green LA, Izzo JL Jr, Jones DW, Materson BJ, Oparil S, Wright JT Jr, Roccella EJ; National Heart, Lung, and Blood Institute Joint National Committee on Prevention, Detection, Evaluation, and Treatment of High Blood Pressure; National High Blood Pressure Education Program Coordinating Committee . The seventh report of the Joint National Committee on Prevention, Detection, Evaluation, and Treatment of High Blood Pressure: the JNC 7 report. JAMA. 2003;289:2560–2572. [DOI] [PubMed] [Google Scholar]
- 13. Mancia G, Fagard R, Narkiewicz K, Redón J, Zanchetti A, Böhm M, Christiaens T, Cifkova R, De Backer G, Dominiczak A, Galderisi M, Grobbee DE, Jaarsma T, Kirchhof P, Kjeldsen SE, Laurent S, Manolis AJ, Nilsson PM, Ruilope LM, Schmieder RE, Sirnes PA, Sleight P, Viigimaa M, Waeber B, Zannad F; Task Force Members . 2013 ESH/ESC guidelines for the management of arterial hypertension: the Task Force for the Management of Arterial Hypertension of the European Society of Hypertension (ESH) and of the European Society of Cardiology (ESC). J Hypertens. 2013;31:1281–1357. [DOI] [PubMed] [Google Scholar]
- 14. Xie X, Atkins E, Lv J, Bennett A, Neal B, Ninomiya T, Woodward M, MacMahon S, Turnbull F, Hillis GS, Chalmers J, Mant J, Salam A, Rahimi K, Perkovic V, Rodgers A. Effects of intensive blood pressure lowering on cardiovascular and renal outcomes: updated systematic review and meta‐analysis. Lancet. 2016;387:435–443. [DOI] [PubMed] [Google Scholar]
- 15. SPRINT Research Group , Wright JT Jr, Williamson JD, Whelton PK, Snyder JK, Sink KM, Rocco MV, Reboussin DM, Rahman M, Oparil S, Lewis CE, Kimmel PL, Johnson KC, Goff DC Jr, Fine LJ, Cutler JA, Cushman WC, Cheung AK, Ambrosius WT. A randomized trial of intensive versus standard blood‐pressure control. N Engl J Med. 2015;373:2103–2116. [DOI] [PMC free article] [PubMed] [Google Scholar]
- 16. Williamson JD, Supiano MA, Applegate WB, Berlowitz DR, Campbell RC, Chertow GM, Fine LJ, Haley WE, Hawfield AT, Ix JH, Kitzman DW, Kostis JB, Krousel‐Wood MA, Launer LJ, Oparil S, Rodriguez CJ, Roumie CL, Shorr RI, Sink KM, Wadley VG, Whelton PK, Whittle J, Woolard NF, Wright JT Jr, Pajewski NM; SPRINT Research Group . Intensive vs standard blood pressure control and cardiovascular disease outcomes in adults aged ≥75 years: a randomized clinical trial. JAMA. 2016;315:2673–2682. [DOI] [PMC free article] [PubMed] [Google Scholar]
- 17. Lonn EM, Bosch J, López‐Jaramillo P, Zhu J, Liu L, Pais P, Diaz R, Xavier D, Sliwa K, Dans A, Avezum A, Piegas LS, Keltai K, Keltai M, Chazova I, Peters RJ, Held C, Yusoff K, Lewis BS, Jansky P, Parkhomenko A, Khunti K, Toff WD, Reid CM, Varigos J, Leiter LA, Molina DI, McKelvie R, Pogue J, Wilkinson J, Jung H, Dagenais G, Yusuf S; HOPE‐3 Investigators . Blood‐pressure lowering in intermediate‐risk persons without cardiovascular disease. N Engl J Med. 2016;374:2009–2020. [DOI] [PubMed] [Google Scholar]
- 18. National Center for Health Statistics . Ambulatory health care data. Available at: http://www.cdc.gov/nchs/ahcd.htm. Accessed December 15, 2015.
- 19. Mechanic D, McAlpine DD, Rosenthal M. Are patients’ office visits with physicians getting shorter? N Engl J Med. 2001;344:198–204. [DOI] [PubMed] [Google Scholar]
- 20. Paez KA, Zhao L, Hwang W. Rising out‐of‐pocket spending for chronic conditions: a ten‐year trend. Health Aff (Millwood). 2009;28:15–25. [DOI] [PubMed] [Google Scholar]
- 21. Egan BM, Li J, Hutchison FN, Ferdinand KC. Hypertension in the United States, 1999 to 2012: progress toward Healthy People 2020 goals. Circulation. 2014;130:1692–1699. [DOI] [PMC free article] [PubMed] [Google Scholar]
- 22. Gu Q, Burt VL, Dillon CF, Yoon S. Trends in antihypertensive medication use and blood pressure control among United States adults with hypertension: the National Health and Nutrition Examination Survey, 2001 to 2010. Circulation. 2012;126:2105–2114. [DOI] [PubMed] [Google Scholar]
- 23. Tunstall‐Pedoe H, Connaghan J, Woodward M, Tolonen H, Kuulasmaa K. Pattern of declining blood pressure across replicate population surveys of the WHO MONICA project, mid‐1980s to mid‐1990s, and the role of medication. BMJ. 2006;332:629–635. [DOI] [PMC free article] [PubMed] [Google Scholar]
- 24. Goff DC Jr, Gillespie C, Howard G, Labarthe DR. Is the obesity epidemic reversing favorable trends in blood pressure? Evidence from cohorts born between 1890 and 1990 in the United States. Ann Epidemiol. 2012;22:554–561. [DOI] [PubMed] [Google Scholar]
- 25. Blair IV, Steiner JF, Hanratty R, Price DW, Fairclough DL, Daugherty SL, Bronsert M, Magid DJ, Havranek EP. An investigation of associations between clinicians’ ethnic or racial bias and hypertension treatment, medication adherence and blood pressure control. J Gen Intern Med. 2014;29:987–995. [DOI] [PMC free article] [PubMed] [Google Scholar]
- 26. Umscheid CA, Gross R, Weiner MG, Hollenbeak CS, Tang SS, Turner BJ. Racial disparities in hypertension control, but not treatment intensification. Am J Hypertens. 2010;23:54–61. [DOI] [PubMed] [Google Scholar]
- 27. Manze M, Rose AJ, Orner MB, Berlowitz DR, Kressin NR. Understanding racial disparities in treatment intensification for hypertension management. J Gen Intern Med. 2010;25:819–825. [DOI] [PMC free article] [PubMed] [Google Scholar]
- 28. JATOS Study Group . Principal results of the Japanese trial to assess optimal systolic blood pressure in elderly hypertensive patients (JATOS). Hypertens Res. 2008;31:2115–2127. [DOI] [PubMed] [Google Scholar]
- 29. Ogihara T, Saruta T, Rakugi H, Matsuoka H, Shimamoto K, Shimada K, Imai Y, Kikuchi K, Ito S, Eto T, Kimura G, Imaizumi T, Takishita S, Ueshima H; Valsartan in Elderly Isolated Systolic Hypertension Study Group . Target blood pressure for treatment of isolated systolic hypertension in the elderly: Valsartan in Elderly Isolated Systolic Hypertension study. Hypertension. 2010;56:196–202. [DOI] [PubMed] [Google Scholar]
- 30. Arauz‐Pacheco C, Parrott MA, Raskin P; American Diabetes Association . Treatment of hypertension in adults with diabetes. Diabetes Care. 2003;26:S80–S82. [DOI] [PubMed] [Google Scholar]
- 31. Buse JB, Ginsberg HN, Bakris GL, Clark NG, Costa F, Eckel R, Fonseca V, Gerstein HC, Grundy S, Nesto RW, Pignone MP, Plutzky J, Porte D, Redberg R, Stitzel KF, Stone NJ; American Heart Association; American Diabetes Association . Primary prevention of cardiovascular diseases in people with diabetes mellitus: a scientific statement from the American Heart Association and the American Diabetes Association. Circulation. 2007;115:114–126. [DOI] [PubMed] [Google Scholar]
- 32. American Diabetes Association . (8) Cardiovascular disease and risk management. Diabetes Care. 2015;38:S49–S57. [DOI] [PubMed] [Google Scholar]
- 33. ACCORD Study Group , Cushman WC, Evans GW, Byington RP, Goff DC Jr, Grimm RHJr, Cutler JA, Simons‐Morton DG, Basile JN, Corson MA, Probstfield JL, Katz L, Peterson KA, Friedewald WT, Buse JB, Bigger JT, Gerstein HC, Ismail‐Beigi F. Effects of intensive blood‐pressure control in type 2 diabetes mellitus. N Engl J Med. 2010;362:1575–1585. [DOI] [PMC free article] [PubMed] [Google Scholar]
- 34. Cushman WC, Whelton PK, Fine LJ, Wright JT Jr, Reboussin DM, Johnson KC, Oparil S; SPRINT Study Research Group . SPRINT Trial results: latest news in hypertension management. Hypertension. 2016;67:263–265. [DOI] [PMC free article] [PubMed] [Google Scholar]
- 35. Hill MN, Miller NH, DeGeest S; American Society of Hypertension Writing Group . ASH position paper: adherence and persistence with taking medication to control high blood pressure. J Clin Hypertens (Greenwich). 2010;12:757–764. [DOI] [PMC free article] [PubMed] [Google Scholar]
- 36. Glynn LG, Murphy AW, Smith SM, Schroeder K, Fahey T. Interventions used to improve control of blood pressure in patients with hypertension. Cochrane Database Syst Rev. 2010; 3: CD005182. doi: 10.1002/14651858.CD005182.pub4. [DOI] [PubMed] [Google Scholar]
- 37. O'Connor PJ, Sperl‐Hillen JM, Johnson PE, Rush WA, Biltz G. Clinical inertia and outpatient medical errors In: Henriksen K, Battles JB, Marks ES, Lewin DI, eds. Advances in Patient Safety: From Research to Implementation (Volume 2: Concepts and Methodology). Rockville, MD: Agency for Healthcare Research and Quality (US); 2005:293–308. [Google Scholar]
- 38. Shelley D, Tseng TY, Matthews AG, Wu D, Ferrari P, Cohen A, Millery M, Ogedegbe O, Farrell L, Kopal H. Technology‐driven intervention to improve hypertension outcomes in community health centers. Am J Manag Care. 2011;17:SP103–SP110. [PubMed] [Google Scholar]
- 39. Soumerai SB, McLaughlin TJ, Gurwitz JH, Guadagnoli E, Hauptman PJ, Borbas C, Morris N, McLaughlin B, Gao X, Willison DJ, Asinger R, Gobel F. Effect of local medical opinion leaders on quality of care for acute myocardial infarction: a randomized controlled trial. JAMA. 1998;279:1358–1363. [DOI] [PubMed] [Google Scholar]
- 40. Safford MM, Shewchuk R, Qu H, Williams JH, Estrada CA, Ovalle F, Allison JJ. Reasons for not intensifying medications: differentiating “clinical inertia” from appropriate care. J Gen Intern Med. 2007;22:1648–1655. [DOI] [PMC free article] [PubMed] [Google Scholar]
- 41. Mu L, Cohen AJ, Mukamal KJ. Prevalence and predictors of resistance and aerobic exercise among hypertensive adults in the United States. J Hum Hypertens. 2015;29:394–395. [DOI] [PubMed] [Google Scholar]
- 42. Maimaris W, Paty J, Perel P, Legido‐Quigley H, Balabanova D, Nieuwlaat R, McKee M. The influence of health systems on hypertension awareness, treatment, and control: a systematic literature review. PLoS Med. 2013;10:e1001490. [DOI] [PMC free article] [PubMed] [Google Scholar]
- 43. Law MR, Morris JK, Wald NJ. Use of blood pressure lowering drugs in the prevention of cardiovascular disease: meta‐analysis of 147 randomised trials in the context of expectations from prospective epidemiological studies. BMJ. 2009;338:b1665. [DOI] [PMC free article] [PubMed] [Google Scholar]
- 44. Law MR, Wald NJ, Morris JK, Jordan RE. Value of low dose combination treatment with blood pressure lowering drugs: analysis of 354 randomised trials. BMJ. 2003;326:1427. [DOI] [PMC free article] [PubMed] [Google Scholar]
- 45. Voorham J, Haaijer‐Ruskamp FM, Wolffenbuttel BH, Stolk RP, Denig P; Groningen Initiative to Analyze Type 2 Diabetes Treatment Group . Medication adherence affects treatment modifications in patients with type 2 diabetes. Clin Ther. 2011;33:121–134. [DOI] [PubMed] [Google Scholar]
- 46. Kidney Disease: Improving Global Outcomes (KDIGO) Blood Pressure Work Group . KDIGO clinical practice guideline for the management of blood pressure in chronic kidney disease. Kidney Int Suppl. 2012;2:337–414. [Google Scholar]
- 47. KDOQI . KDOQI clinical practice guidelines and clinical practice recommendations for diabetes and chronic kidney disease. Am J Kidney Dis. 2007;49:S12–S154. [DOI] [PubMed] [Google Scholar]
- 48. Voorham J, Haaijer‐Ruskamp FM, Wolffenbuttel BH, Stolk RP, Denig P; Groningen Initiative to Analyse Type 2 Diabetes Treatment Group . Cardiometabolic treatment decisions in patients with type 2 diabetes: the role of repeated measurements and medication burden. Qual Saf Health Care. 2010;19:411–415. [DOI] [PubMed] [Google Scholar]
- 49. Kerr EA, Zikmund‐Fisher BJ, Klamerus ML, Subramanian U, Hogan MM, Hofer TP. The role of clinical uncertainty in treatment decisions for diabetic patients with uncontrolled blood pressure. Ann Intern Med. 2008;148:717–727. [DOI] [PubMed] [Google Scholar]
- 50. Hing E, Shimizu IM, Talwalkar A. Nonresponse bias in estimates from the 2012 National Ambulatory Medical Care Survey. National Center for Health Statistics. Vital Health Stat 2. 2016;171:1–42. [PubMed] [Google Scholar]