Abstract
Correlation and linear regression are the most commonly used techniques for quantifying the association between two numeric variables. Correlation quantifies the strength of the linear relationship between paired variables, expressing this as a correlation coefficient. If both variables x and y are normally distributed, we calculate Pearson's correlation coefficient (r). If normality assumption is not met for one or both variables in a correlation analysis, a rank correlation coefficient, such as Spearman's rho (ρ) may be calculated. A hypothesis test of correlation tests whether the linear relationship between the two variables holds in the underlying population, in which case it returns a P < 0.05. A 95% confidence interval of the correlation coefficient can also be calculated for an idea of the correlation in the population. The value r2 denotes the proportion of the variability of the dependent variable y that can be attributed to its linear relation with the independent variable x and is called the coefficient of determination. Linear regression is a technique that attempts to link two correlated variables x and y in the form of a mathematical equation (y = a + bx), such that given the value of one variable the other may be predicted. In general, the method of least squares is applied to obtain the equation of the regression line. Correlation and linear regression analysis are based on certain assumptions pertaining to the data sets. If these assumptions are not met, misleading conclusions may be drawn. The first assumption is that of linear relationship between the two variables. A scatter plot is essential before embarking on any correlation-regression analysis to show that this is indeed the case. Outliers or clustering within data sets can distort the correlation coefficient value. Finally, it is vital to remember that though strong correlation can be a pointer toward causation, the two are not synonymous.
Keywords: Bland–Altman plot, correlation, correlation coefficient, intraclass correlation coefficient, method of least squares, Pearson's r, point biserial correlation coefficient, Spearman's rho, regression
Introduction
The word correlation is used in day-to-day life to denote some form of association. In statistics, correlation analysis quantifies the strength of the association between two numerical variables. If the association is “strong” then an attempt may be made mathematically to develop a predictive relationship between the two variables so that given the value of one, the value of the other may be predicted from it and vice versa. Defining this mathematical relationship as an equation is the essence of regression analysis. Correlation and regression analysis are therefore like two sides of the same coin.
The Scatter Plot
When exploring the relationship between two numerical variables, the first and essential step is to graphically depict the relationship on a scatter plot or scatter diagram or scattergram. This is simply a bivariate plot of one variable against the other. Before plotting, one or both variables may be logarithmically transformed to obtain a more normal distribution.
On a scatter diagram, it is customary to plot the independent variable on the X-axis and the dependent variable on the Y-axis. However, “independent” and “dependent” distinction can be puzzling at times. For instance, if we are exploring the relationship between age and stature in children, it is reasonable to assume that age is the “independent” variable on which the height depends. So customarily, we will plot age on the X-axis and height on the Y-axis. However, if we are exploring the relationship between serum potassium and venous plasma glucose levels, which variable do we treat as the “dependent” variable? In such cases, it usually does not matter which variable is attributed to a particular axis of the scatter diagram. If our intention is to draw inferences about one variable (the outcome or response variable) from the other (the predictor or explanatory variable), the observations from which the inferences are to be made are usually placed on the horizontal axis.
Once plotted, the closer the points lie to a straight line; the stronger is the linear relationship between two variables. Examine the two scatter plots presented in Figure 1. In Figure 1a, the individual dots representing the paired xy values are obviously, closely approximating a straight line and the value of y increases as the value of x increases. This type of relationship is referred to as direct linear relationship. In Figure 1b, the dots are also approximating a straight line, though not so closely, as in Figure 1a. Moreover, the value of y is declining as that of x is increasing. This type of relationship is an inverse or reciprocal linear relationship.
Figure 1.
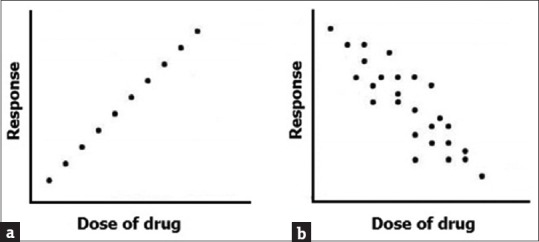
Scatter diagram depicting direct and inverse linear relationships
Now inspect the scatter plot shown in Figure 2. In this instance, there also is a strong relation between the dose of the drug and the response – the response is low to begin with, rises steadily in the subsequent portion of the dose range, but then tends to decline with further increase in dose. It is clear that although the relationship is strong it cannot be approximated by a single straight line but can be described by an appropriate curved line. The association, in this case, is curvilinear rather than linear. We are going to discuss correlation and regression assuming linear relationship between the variables in question. Although many biological phenomena will show nonlinear relationships, the mathematics of these are more complex and beyond the scope of this module.
Figure 2.
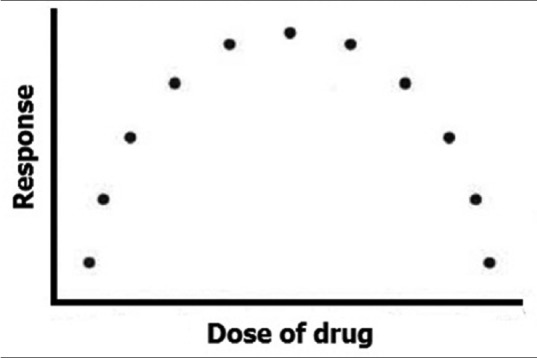
Scatter diagram depicting a curvilinear relationship
The Correlation Coefficient
To quantify the strength of the relationship between two variables shown to have a linear relationship on the scatter plot, we calculate the correlation coefficient. The coefficient takes values only between −1 and +1, with the numerical magnitude depicting the strength of the relationship, and the sign indicating its direction. Thus, the sign accompanying a correlation coefficient is not a +or −sign in the arithmetic sense. Rather the plus sign denotes a direct relationship, whereas minus denotes an inverse relationship.
If both variables x and y are normally distributed, we calculate Pearson's product moment correlation coefficient r or Pearson's correlation coefficient r, or simply r (after Karl Pearson). It is calculated as the covariance of the two variables divided by the product of their standard deviations (SDs), and the term “product moment” in the name derives from the mathematical nature of the relationship.
A value of r close to +1 indicates a strong direct linear relationship (i.e., one variable increases with the other; as in Figure 3a). A value close to −1 indicates a strong inverse linear relationship (i.e., one variable decreases as the other increases; Figure 3b). A value close to 0 indicates a random scatter of the values [Figure 3c]; alternatively, there could be a nonlinear relationship between the variables [Figure 3d]. The scatter plot is indispensable in checking the assumption of a linear relationship and it is meaningless to calculate a correlation coefficient without such a relation between the two variables. In between the state of “no correlation at all” (r = 0) and “perfect correlation” (r = 1), interim values of the correlation coefficient are interpreted by convention. Thus, values >0.7 may be regarded as “strong” correlation, values between 0.50 and 0.70 may be interpreted as “good” correlation, between 0.3 and 0.5 may be treated as “fair” or “moderate” correlation, and any value <0.30 would be poor correlation. However, we must remember that the interpretation of a correlation coefficient depends on the context and purposes. A correlation of 0.85 may be very low if one is verifying a physical law using high-quality instruments or trying to derive the standard curve for a quantitative assay but may be regarded as very high in the clinical context.
Figure 3.
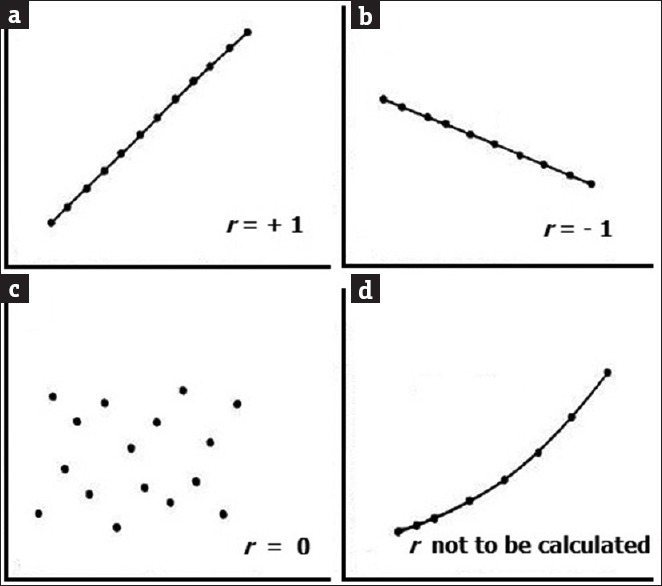
Scatter diagram depicting relationship patterns between two variables
Note that the correlation coefficient has no units and is, therefore, a dimensionless statistic. The position of x and y can be interchanged on a scatter plot without affecting the value of r.
If one or both variables in a correlation analysis is/are not normally distributed a rank correlation coefficient that depends on the rank order of the values rather than the actual observed values can be calculated. Examples include Spearman's rho (ρ) (after Charles Edward Spearman) and Kendall's tau (τ) (after Maurice George Kendall) statistics. In essence Spearman's rank correlation coefficient rho, which is the more frequently used nonparametric correlation, is simply Pearson's product moment correlation coefficient calculated for the rank values of x and y rather than their actual values. It is also appropriate to use ρ rather than r when at least one variable is measured on an ordinal scale or when the sample size is small (say n ≤10); ρ is also less sensitive to deviations from linear relation than r.
Although less often used, Kendall's tau is another nonparametric correlation offered by many statistical packages. Some statisticians recommend that it should be used, rather than Spearman's coefficient, when the data set is small with the possibility of a large number of tied ranks. This means that if we rank all of the scores and many scores have the same rank, Kendall's tau should be used. It is also considered to be a more accurate gauge of the correlation in the underlying population.
Hypothesis Test of Correlation and Confidence Interval for Correlation Coefficient
When we calculate the correlation coefficient for sample data, we quantify the strength of the linear relationship between two variables measured in the sample. A high correlation coefficient value indicates a strong correlation for the sample. However, what about the relationship in the population as a whole from which the sample has been drawn? A significance test, based on the t distribution, addresses this question. It allows us to test whether the association might have occurred merely by chance or whether it is a true association.
This significance test is applied with the null hypothesis that the population correlation coefficient equals 0. For any given value of r and taking the sample size into consideration, P values can be obtained from most statistical packages. As usual, P < 0.05 indicates that there is sufficient evidence to suggest that the true (population) correlation coefficient is not 0 and that the linear relationship between the two variables observed in the sample also holds for the underlying population.
However, although the hypothesis test indicates whether there is a linear relationship, it gives no indication of the strength of that association. This additional information can be obtained from the 95% confidence interval (CI) for the population correlation coefficient.
Calculation of this CI requires r to be transformed to give a normal distribution by making use of Fisher's z transformation. The width of the CI depends on the sample size, and it is possible to calculate the sample size required for a given level of accuracy.
Coefficient of Determination
When exploring linear relationship between numerical variables, a part of the variation in one of the variables can be thought of as being due to its relationship with the other variable with the rest due to undetermined (often random) causes. A coefficient of determination can be calculated to denote the proportion of the variability of y that can be attributed to its linear relation with x. This is taken simply as r multiplied by itself that is r2. It is also denoted as R2.
For any given value of r, the r2 will denote a value that is closer to 0 and will be devoid of a sign. Thus, if r is +0.7 or −0.7, r2 will be 0.49. We can interpret this 0.49 figures as that 49% of the variability in y is due to variation of x. Values of r2 close to 1 imply that most of the variability in y is explained by its linear relationship with x. The value (1 −r2) has sometimes been referred to as the coefficient of alienation.
In statistical modeling, the r2 statistics gives information about the goodness of fit of a model. In regression, it denotes how well the regression line approximates the real data points. An r2 of 1 indicates that the regression line perfectly fits the data. Note that values of r2 outside the range 0–1 can occur where it is used to measure the agreement between observed and modeled values, and the modeled values are not obtained by linear regression.
Point Biserial and Biserial Correlation
The point biserial correlation is a special case of the product-moment correlation, in which one variable is continuous, and the other variable is binary. The point biserial correlation coefficient measures the association between a binary variable x, taking values 0 or 1, and a continuous numerical variable y. It is assumed that for each value of x, the distribution of y is normal, with different means but same variance. It is often abbreviated as rPB.
The binary variable frequently has categories such as yes or no, present or absent, success or failure, etc.
If the variable x is not naturally dichotomous but is artificially dichotomized, we calculate the biserial correlation coefficient rB instead of the point-biserial correlation coefficient.
Although not often used, an example where we may apply the point biserial correlation coefficient would be in cancer studies. How strong is the association between administering the anticancer drug (active drug vs. placebo) and the length of survival after treatment? The value would be interpreted in the same way as Pearson's r. Thus, the value would range from −1 to +1, where −1 indicates a perfect inverse association, +1 indicates a perfect direct association, and 0 indicates no association at all. Take another example. Suppose we want to calculate the correlation between intelligence quotient and the score on a certain test, but all the test scores are not available with us although we know whether each subject passed or failed. We could then use the biserial correlation.
The Phi Coefficient
The phi coefficient (also called the mean square contingency coefficient) is a measure of association for two binary variables. It is denoted as φ or rφ.
Also introduced by Karl Pearson, this statistic is similar to the Pearson's correlation coefficient in its derivation. In fact, a Pearson's correlation coefficient estimated for two binary variables will return the phi coefficient. The interpretation of the phi coefficient requires caution. It has a maximum value that is determined by the distribution of the two variables. If both have a 50/50 split, values of phi will range from −1 to +1.
Application of the phi coefficient is particularly seen in educational and psychological research, in which the use of dichotomous variables is frequent. Suppose we are interested in exploring whether in a group of students opting for university courses, there is gender preference for physical sciences or life sciences. Here, we have two binary variables – gender (male or female) and discipline (physical science or life science). We can arrange the data as a 2 × 2 contingency table and calculate the phi coefficient.
Simple Linear Regression
If two variables are highly correlated, it is then feasible to predict the value of one (the dependent variable) from the value of the other (the independent variable) using regression techniques. In simple linear regression, the value of one variable (x) is used to predict the value of the other variable (y) by means of a simple mathematical function, the linear regression equation, which quantifies the straight-line relationship between the two variables. This straight line, or regression line, is actually the “line of best fit” for the data points on the scatter plot showing the relationship between the variables in question.
The regression line has the general formula:
y = a + bx.
Where “a” and “b” are two constants denoting the intercept of the line on the Y-axis (y-intercept) and the gradient (slope) of the line, respectively. The other name for b is the “regression coefficient.”
Physically, “b” represents the change in y, for every 1 unit change in x; while “a” represents the value that y would take, if x is 0. Once the values of a and b have been established, the expected value of y can be predicted for any given value of x, and vice versa. Thus, a model for predicting y from x is established. There may be situations, in which a straight line passing through the origin will be appropriate for the data, and in these cases, the equation of the regression line simplifies to y = bx.
But how do we fit a straight line to a scattered set of points which seem to be in linear relationship? If the points are not all on a single straight line, we can, by eye estimation, draw multiple lines that seem to fit the series of data points on the scatter diagram. But which is the line of best fit? This problem had mathematicians stumped literally for centuries. The solution was in the form of the method of least squares, which was first published by the French mathematician Adrien-Marie Legendre in 1805 but used earlier by Carl Friedrich Gauss in Germany in 1795 to calculate the orbit of celestial bodies. Gauss developed the idea further and today is known as the father of regression.
Look at Figure 4. When we have a scattered series of dot which are lying approximately but not exactly on a straight line, we can, by eye estimation, draw a number of lines that seem to fit the series. But which is the line of best fit? The method of least squares, in essence, selects the line that would provide the least sum of squares for the vertical residuals or offsets. In Figure 4, it is line B as is shown in the lower panel. For a particular value of x, the vertical distance between the observed and fitted value of y is known as the residual or offset. Since some of the residuals are above and some below the line of best fit, we require a +or −sign to mathematically denote the residuals. Squaring removes the effect of the −sign. The method of least squares finds the values of “a” and “b” that minimizes the sum of the squares of all the residuals. The method of least squares is not the only technique, but is regarded as the simplest technique for linear regression, that is for the task of finding the straight line of best fit for a series of points depicting a linear relationship on a scatter diagram.
Figure 4.
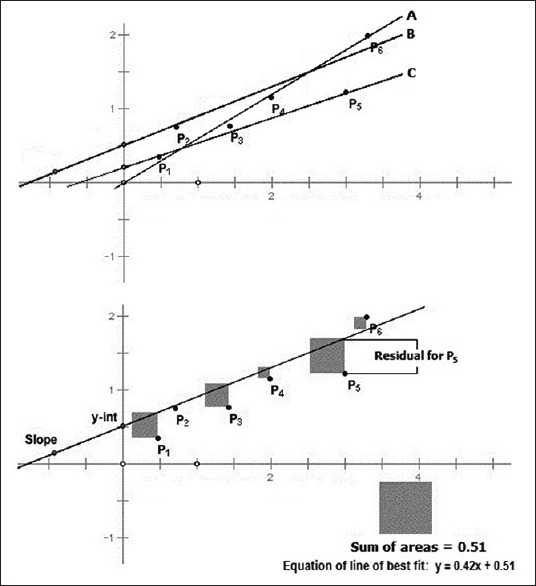
The principle of the method of least squares for linear regression. The sum of the squared “Residuals” is the least for the line of best fit
You may wonder why the statistical procedure of fitting a line is called “regression” which in common usage means “going backward.” Interestingly, the term was used neither by Legendre or Gauss but is attributed to the English scientist Francis Galton who had a keen interest in heredity. In Victorian England, Galton measured the heights of 202 fathers and their first born adult sons and plotted them on a graph of median height versus height group. The scatter for fathers and sons approximated to two lines that intersected at a point representing the average height of the adult English population. Studying this plot, Galton made the very interesting observation that tall fathers tend to have tall sons but they are not as tall as their fathers, and short fathers tend to have short sons but they are not as short as their fathers; and in the course of just two or three generations the height of individuals tended to go back or “regress” to the mean population height. He published a famous paper titled “Regression towards mediocrity in hereditary stature.” This phenomenon of regression to the mean can be observed in many biological variables. The term regression subsequently somehow got attached to the procedure of line fitting itself.
Note that in our discussion above; we have discussed the predictive relationship between two numerical variables. This is simple linear regression. If the value of y requires more than one numerical variable for a reasonable prediction, we are encountering the situation called multiple linear regression. We will be discussing the basics of this in a future module.
Pitfalls in Correlation and Regression Analysis
Correlation and linear regression analysis are based on certain assumptions pertaining to the data sets. If these assumptions are not met, conclusions drawn can be misleading. Both assume that the relationship between the two variables is linear. The observations have to be independent – they are not independent if there is more than one pair of observations (that is repeat measurements) from one individual. For correlation, both variables should be random variables although for regression, only the response variable y needs to be random.
Inspecting a scatter plot is of utmost importance before estimation of the correlation coefficient for many reasons:
A nonlinear relationship may exist between two variables that would be inadequately described, or possibly even undetected, by the correlation coefficient. For instance, the correlation coefficient if calculated for the set of data points in Figure 2, would be almost zero, but we will be grossly wrong if we conclude that there is no association between the variables. The zero coefficient only tells us that there is no linear (straight-line) association between the variables, when in reality there is a clear curvilinear (curved-line) association between them
An outlier may create a false correlation. Inspect the scatter plot in Figure 5a. The r value of 0.923 suggests a strong correlation. However, a closer look makes it obvious that the series of dots is actually quite scattered, and the apparent correlation is being created by the outlier point. This kind of outlier is called univariate outlier. If we consider the x value of this point, it is way beyond the range of rest of the x values; similarly, the y value of the point is much beyond the range of y values for the rest of the dots. An univariate outlier is easy to spot by simply sorting the values or constructing boxplots
Conversely, an outlier can also spoil a correlation. The scatter plot in Figure 5b suggests only moderate correlation at r value of 0.583, but closer inspection reveals that a single bivariate outlier reduces what is otherwise an almost perfect association between the variables. Note that the deviant case is not an outlier in the usual univariate sense. Individually, its x value and y value are unexceptional. What is exceptional is the combination of values on the two variables that it exhibits, making it an outlier, and this would be evident only on a scatter plot
Clustering within datasets may also inflate a correlation. Look at Figure 5c. Two clusters are evident, and individually they do not appear to show strong correlation. However, combining the two suggests a decent correlation. This combination may be undesirable in real life. Clustering within datasets may be a pointer that the sampling has not really been random.
Figure 5.
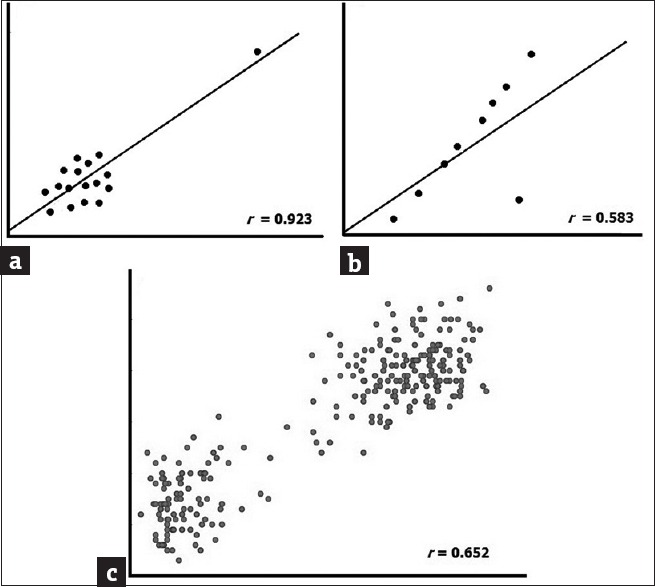
Examples of misleading correlations
When using a regression equation for prediction, errors in prediction may not be just random but may also be due to inadequacies in the model. In particular, extrapolating beyond the range of observed data can be risky and is best avoided. Consider the simple regression equation:
Weight = a + b × height.
Suppose we give a height value of 0. The corresponding weight value, strangely, is not 0 but equals a. What is the matter here? Is the equation derived through regression faulty? The fact is that the equation is not at fault, but we are trying to extrapolate its use beyond the range of values used in deriving the equation through least squares regression. This is a common pitfall. Equations derived from one sample should not be automatically applied to another sample. Equations derived from adults, for instance, should not be applied to children.
Correlation is Not Causation
One of the common errors in interpreting the correlation coefficient is failure to consider that there may be a third variable related to both of the variables being investigated, which is responsible for the apparent correlation. Therefore, it is wrong to infer that there is cause and effect relationship between two variables that are correlated, even if the correlation is strong. In other words, correlation does not imply causation.
As a now widely stated example, numerous epidemiological studies showed that women taking combined hormone replacement therapy (HRT) also had a lower-than-average incidence of coronary heart disease (CHD). The correlation was strong leading researchers to propose that HRT was protective against CHD. However, subsequent randomized controlled trials showed that HRT causes a small but statistically significant increase in the risk of CHD. Reanalysis of the data from the epidemiological studies showed that women undertaking HRT were more likely to be from higher socioeconomic groups, with better-than-average diet and exercise regimens. The use of HRT and decreased the incidence of CHD were coincident effects of a common cause (i.e., the benefits associated with a higher socioeconomic status), rather than a direct cause and effect, as had been supposed.
Correlation may simply be due to chance. For example, one could compute r between the abdominal circumference of subjects and their shoe sizes, intelligence, or income. Irrespective of the value of r, these associations would make no sense.
For any two correlated variables, A and B, the following relationships are possible:
A causes B or vice versa (direct causation)
A causes C which causes B or the other way round (indirect causation)
A causes B and B causes A (bidirectional or cyclic causation)
A and B are consequences of a common cause but do not cause each other
There is no causal connection between A and B; the correlation is just coincidence.
Thus, causality ascertainment requires consideration of several other factors, including temporal relationship, dose-effect relationship, effect of dechallenge and rechallenge, and biological plausibility. Of course, a strong correlation may be an initial pointer that a cause-effect relationship exists, but per se it is not sufficient to infer causality. There must also be no reasonable alternative explanation that challenges causality. Establishing causality is one of the most daunting challenges in both public health and drug research. Carefully controlled studies are needed to address this question.
Assessing Agreement
In the past correlation has been used to assess this degree of agreement between sets of paired measurements. However, correlation quantifies the relationship between numerical variables and has limitations if used for assessing comparability between methods. Two sets of measurements would be perfectly correlated if the scatter diagram shows that they all lie on a single straight line, but they are not likely to be in perfect agreement unless this line passes through the origin. It is very likely that two tests designed to measure the same variable would return figures that would be strongly correlated, but that does not automatically mean that the repeat measurements are also in strong agreement. Data which seem to be in poor agreement can produce quite high correlations. In addition, a change in scale of measurement does not affect the correlation, but it can affect the agreement.
Bland-Altman Plot
Bland and Altman devised a simple but informative graphical method of comparing repeat measurements. When repeat measurements have been taken on a series of subjects or samples, the difference between pairs of measurements (Y-axis) is plotted against the arithmetic mean of the corresponding measurements (X-axis). The resulting scatter diagram such as figure is the Bland–Altman plot (after John Martin Bland and Douglas G. Altman, who first proposed it in 1983 and then popularized it through a Lancet paper in 1986) an example of which is given in Figure 6. The repeat measurements could represent results of two different assay methods or scores from the same subjects by two different raters.
Figure 6.
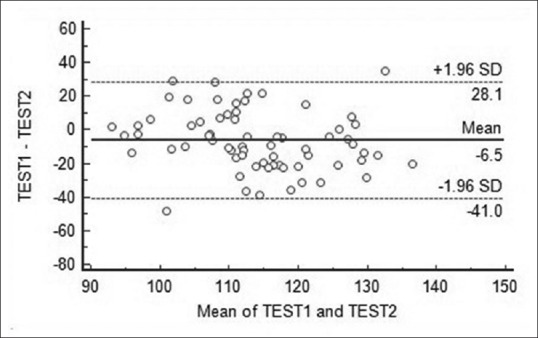
Example of a Bland–Altman plot used to compare two test methods. The bias line with the limits of agreement is provided
Computer software that draws a Bland–Altman plot can usually add a ‘bias’ line parallel to the X-axis. This represents the difference between the means of the two sets of measurements. Lines denoting 95% limits of agreement (mean difference ± 1.96 SD of the difference) can be added on either side of the bias line. Alternatively, lines denoting 95% confidence limits of mean of differences can be drawn surrounding the bias line.
Bland–Altman plots are generally interpreted informally. Three things may be looked at:
How big is the average discrepancy between the methods, which is indicated by the position of the bias line. This discrepancy may be too large to accept clinically. However, if the differences within mean ± 1.96 SD are not clinically important, the two methods may be used interchangeably
Whether the scatter around the bias line is too much, with a number of points falling outside the 95% agreement limit lines
Whether the difference between the methods tends to get larger or smaller as the values increase. If it does, as is indicated in Figure 7, it indicates the existence of a proportional bias which means that the methods do not agree equally through the range of measurements.
Figure 7.
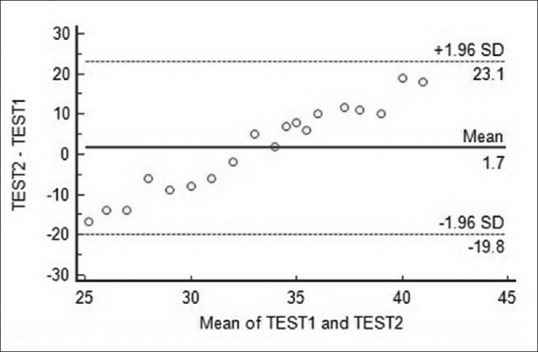
Example of a Bland–Altman plot showing proportional bias. In this case, the difference between the methods first tends to narrow down and then increase as the value of measurements increase
The Bland–Altman plot may also be used to assess the repeatability of a method by comparing repeated measurements on a series of subjects or samples by that single method. A coefficient of repeatability can be calculated as 1.96 times the SD of the differences between the paired measurements. Since the same method is used for the repeated measurements, it is expected that the mean difference should be zero. This can be checked from the plot.
Intraclass Correlation Coefficient
Although originally introduced in genetics to judge sibling correlations, the intraclass correlation coefficient (ICC) statistic is now most often used to assess the consistency, or conformity, of measurements made by multiple observers measuring the same parameter or two or more raters scoring the same set of subjects.
The methods of ICC calculation have evolved over time. The earliest work on intraclass correlations focused on paired measurements, and the first ICC statistics to be proposed was modifications of the Pearson's correlation coefficient (which can be regarded interclass correlation) calculations. Beginning with Ronald Fisher, the intraclass correlation has been regarded within the framework of analysis of variance and its calculation is now based on the true (between subject) variance and variance of the measurement error (during repeat measurement).
The ICC takes a value between 0 and 1. Complete inter-rater agreement is indicated by a value of 1 but this is seldom achieved. Arbitrarily, the agreement boundaries proposed are <0.40: Poor; 0.40–0.60: Fair; 0.60–0.74: Good, and >0.75: Strong. Software may report two coefficients with their respective 95% CIs. ICC for single measures is an index for the reliability of the multiple ratings by a single typical rater. ICC for average measures is an index for the reliability of different raters averaged together. This ICC is always slightly higher than the single measures ICC. Software may also offer different models for ICC calculation. One model assumes that all subjects were rated by the same raters. A different model may be used when this precondition is not true. The model may test for consistency when systematic differences between raters are irrelevant, or absolute agreement, when systematic differences are relevant.
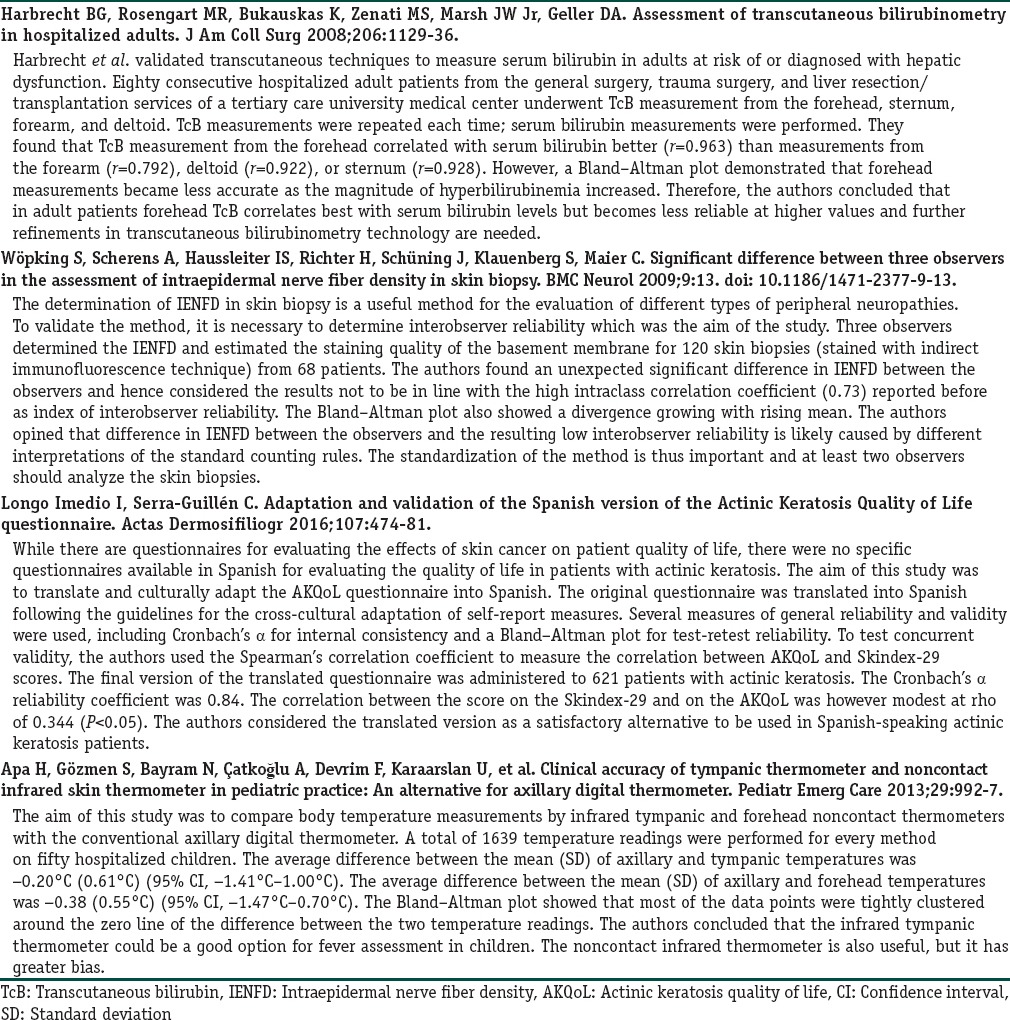
Some published examples of the use of correlation analysis are provided in the Box 1.
Box 1.
Examples of correlation and agreement analysis from published literature
Finally, note that assessing agreement between categorical variables requires different indices such as Cohen's kappa. This will be discussed in a future module.
Financial support and sponsorship
Nil.
Conflicts of interest
There are no conflicts of interest.
Further Reading
- 1.Samuels MA, Witmer JA, Schaffner AA, editors. Statistics for the life sciences. 4th ed. Boston: Pearson Education; 2012. Linear regression and correlation; pp. 493–549. [Google Scholar]
- 2.Kirk RE, editor. Statistics: An introduction. 5th ed. Belmont: Thomson Wadsworth; 2008. Correlation; pp. 123–57. [Google Scholar]
- 3.Kirk RE, editor. Statistics: An introduction. 5th ed. Belmont: Thomson Wadsworth; 2001. Regression; pp. 159–81. [Google Scholar]
- 4.Glaser AN, editor. High-yield biostatistics. Baltimore: Lippincott Williams and Wilkins; 2001. Correlational techniques; pp. 50–7. [Google Scholar]
- 5.Bewick V, Cheek L, Ball J. Statistics review 7: Correlation and regression. Crit Care. 2003;7:451–9. doi: 10.1186/cc2401. [DOI] [PMC free article] [PubMed] [Google Scholar]
- 6.Giavarina D. Understanding Bland Altman analysis. Biochem Med (Zagreb) 2015;25:141–51. doi: 10.11613/BM.2015.015. [DOI] [PMC free article] [PubMed] [Google Scholar]


