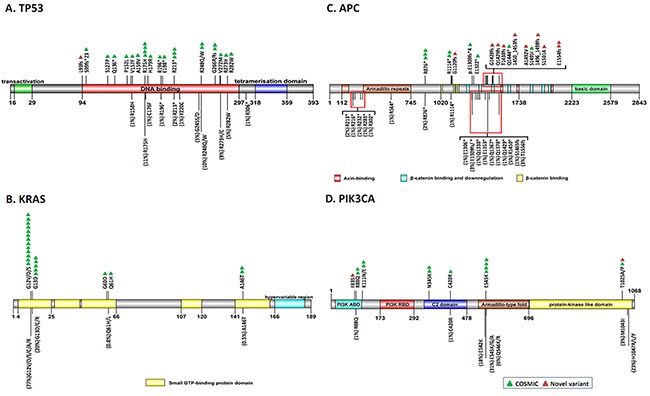
Figure 3. Spatial distribution of somatic variants on the protein function domains of the top-4 mutated genes.

One triangle represents one variant found in one tumor (green = COSMIC mutation; red = novel variant). Color blocks illustrate the different functional domains of each protein. For comparison, the variants of each gene with a frequency of ≥1% recorded in the COSMIC database are marked with a black line below the domain bar, and the mutation rate is indicated in parentheses and indicated by the length of the line. A. TP53; B. KRAS; C. APC; D. PIK3CA.
