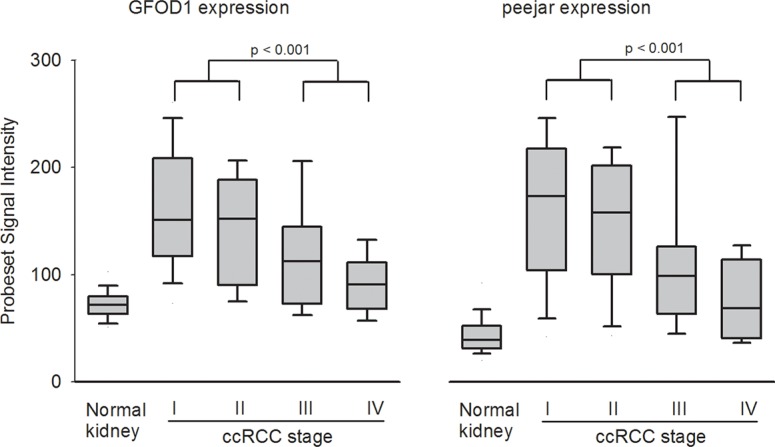
Figure 2. Probeset signal intensity of 219821_s_at (GFOD1) and 230179_at (peejar) from Dataset E-GEOD-53757.
Both probesets shown lowest gene expression from 72 normal kidney samples, with highest average gene expression in 24 ccRCC Stage I tumor samples, and gradually decreasing in 19 stage II tumor samples, 14 stage II tumor samples and 15 stage IV samples. There were significant difference between gene expression from patients' samples with early stage and late stage diseases.

