Figure 6.

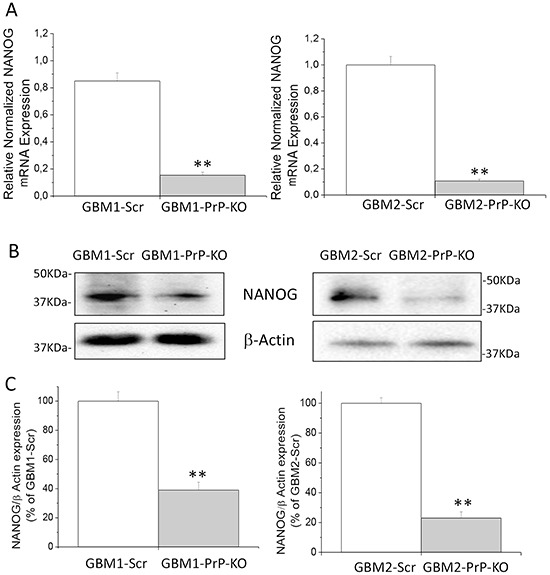
A. Expression of NANOG mRNA in GBM1 and GBM2-Scr and PrP-KO cells, evaluated by quantitative RT-PCR. NANOG expression values were normalized to respective GBM-Scr cells (white bars). Results are expressed as means ± SEM. **p < 0.01 vs. respective GBM-Scr cells. B. Representative immunoblots of NANOG protein expression level in GBM-Scr and GBM PrP-KO cells. Immunoblot analysis of β-actin levels was performed to normalize the data for the total protein input of cell lysates. C. Densitometric analysis of NANOG expression from three independent Western blot experiments and expressed as percentage of GBM-Scr cells ± SEM.**p<0.01 vs. respective GBM-Scr cells.
