Abstract
Rationale: Acute respiratory distress syndrome (ARDS) is an acute hypoxemic respiratory failure seen in critically ill patients after an inciting injury. The burden of ARDS mortality in the United States in recent years is not well characterized.
Objectives: In this study, we aimed to describe trends in the annual incidence of ARDS mortality in the United States from 1999 to 2013. We also describe demographic characteristics, geographic and seasonal trends, and other associated underlying causes of death in this population.
Methods: Data on all deceased U.S. residents are available through the Multiple Cause of Death (MCOD) database of the National Center for Health Statistics. ARDS-related deaths were identified in the MCOD database using International Classification of Diseases, 10th Revision.
Measurements and Main Results: Aggregate annual crude and age-adjusted mortality rates and mortality rate ratios were used to compare various demographic subpopulations. Over the 15-year period, the national ARDS-related age-adjusted mortality rate demonstrated an annual seasonal variation, peaking in winter. The annual rate decreased in a nonlinear fashion, with a plateau from 2010 to 2013. The ARDS-related age-adjusted mortality rate was 5.01 per 100,000 persons (95% confidence interval, 4.92–5.09) in 1999 and 2.82 per 100,000 persons (95% confidence interval, 2.76–2.88) in 2013. Males had a higher average ARDS-related mortality rate than did females. Asian/Pacific Islanders had the lowest average age-adjusted ARDS-related mortality rate, and black/African-American individuals, the highest.
Conclusions: National age-adjusted ARDS-related mortality rates decreased between 1999 and 2013 in the United States, yet still show relative racial and sex disparities. However, death certificates largely underestimate the overall mortality burden from ARDS when compared with studies of clinically ascertained cases.
Keywords: acute respiratory distress syndrome, epidemiology, critical illness, critical care, acute lung injury
Acute respiratory distress syndrome (ARDS) is a critical illness characterized by an acute, inciting inflammatory event followed by hypoxemic respiratory failure. The inciting injury, commonly pneumonia, sepsis, or trauma, is not necessarily located anatomically within the respiratory system but leads to diffuse inflammatory pulmonary infiltrates, hypoxemic respiratory failure, and an associated high probability of mortality (1–3). The syndrome has been described in the literature since 1967, with the first consensus definition introduced by the American European Consensus Conference in 1994 (4, 5). In 2012, this definition was revised and validated by an international panel of experts to produce the Berlin Definition, a clinical tool that endeavors to maintain diagnostic and prognostic usefulness, as well as compatibility with previous research (1, 6).
Despite significant advances in the understanding of the pathophysiology and treatment of ARDS, the burden of ARDS mortality in the United States in recent years has not been well characterized, with the majority of published work from single hospital systems in restricted geographic regions (7–15). One study, from a 16-month period in 1999 in King County, Washington, estimated an ARDS incidence of 79 cases per 100,000 person-years, with a 38.5% case fatality rate (9). Another report, from Olmsted County, Minnesota, showed a decline in ARDS incidence from 82 to 39 cases per 100,000 person-years from 2001 to 2008, with the case fatality rate remaining largely unchanged (21–19% over the time period) (8).
Moss and Mannino examined US national trends in ARDS mortality from 1979 to 1996, showing an increase in ARDS-related deaths from 1979 to 1993 (five to eight per 100,000 persons) that subsequently decreased toward the end of the study period in 1996 (seven deaths per 100,000 persons) (11). Another study examining U.S. national trends from 1992 to 2007 demonstrated an increase in incidence from 36 cases per 100,000 to 106 cases per 100,000, with a steady decline in case fatality rates (7).
In this study, we aimed to describe the temporal and geographic trends in the annual incidence of ARDS mortality in the United States from 1999 to 2013 using a complete national sample. We also aimed to describe demographic characteristics and other associated causes of death in this population.
Methods
Data Source and Definitions
All data for these analyses were collected from the National Center for Health Statistics’ (NCHS) Multiple Cause of Death (MCOD) database. The MCOD database is derived from the National Death Index and contains information from death certificates of every U.S. resident who died within the 50 states and District of Columbia; it is publicly available through the Centers for Disease Control and Prevention’s (CDC) Wide-ranging Online Data for Epidemiologic Research (WONDER) website as aggregated, not individual-level, data (16). MCOD data designates one underlying cause of death (UCOD) and up to 20 additional contributing causes of death. The multiple sequential human and then computer systems developed by the National Center for Health Statistics to extract text diagnoses from the death certificate, convert them into numeric codes, and then process and organize them are described in documentation from the CDC (17).
All deaths in the United States from 1999 to 2013 were eligible for inclusion in this study. We excluded deaths of individuals with an age of under 1 year old or whose age was missing. We narrowed the study time period to 1999–2013 for uniformity in the outcome definition, because 1999 was the year that cause of death coding transitioned to the International Classification of Diseases, 10th Revision (ICD-10).
We defined ARDS-related mortality as a death with the ICD-10 code J80 (Adult Respiratory Distress Syndrome) listed among any of the 20 causes of death. Other variables reported included age category, race, ethnicity, sex, other associated causes of death, and the urban-rural designation and U.S. Census Bureau geographic division of the legal residence at time of death. We included deaths with race coded as Asian or Pacific Islander, black or African American, and white; those coded as American Indian or Alaska Native were excluded because of the small numbers.
Geographic information was based on location of legal residence at time of death as indicated on the death certificate and, if not provided, residence was assigned to the place where the death occurred. Urbanization classification was determined by county per the 2006 NCHS Urban-Rural Classification Scheme (18).
To characterize other acute injuries associated with ARDS-related mortality, we further categorized cases as associated with septicemia, influenza and pneumonia, trauma, or pneumonitis caused by food and vomit by the other ICD-10 codes listed on the death record. We used a previously published ICD-10 definition of septicemia-associated cases (see Table E1 in the online supplement) (19). Trauma-associated deaths were defined by modifying the National Trauma Data Standard inclusion criteria (Table E2) (20). Influenza and pneumonia–associated deaths were defined by ICD-10 codes J09 through J18 (Table E3). Pneumonitis caused by food and vomit–associated deaths were defined by ICD-10 code J69.0. Of note, these subcategorizations of ARDS associated with other specified causes of death are not mutually exclusive. For example, a hypothetical death record listing ARDS, a trauma diagnosis, and a septicemia diagnosis would be counted twice as both an ARDS associated with trauma death and an ARDS associated with septicemia death for this particular part of the analysis.
Sensitivity Analyses
In responding to scientific review and revising this work, several post hoc sensitivity analyses were performed. We reperformed analyses of ARDS trends in the United States, with ARDS death defined only as the underlying causes of death (i.e., when it was listed in the first position on the death record). Of note, this predictably produces smaller death counts; therefore, not all analyses could be performed, because CDC WONDER suppresses the output of any estimates that are based on death counts below a certain cutoff (generally, either 10 or 20, depending on the geographic substrata of analysis). Furthermore, we graphed temporal mortality trends of other respiratory failure diagnoses that may have mimicked or been recorded in place of ARDS, including acute pulmonary edema (J81.0); acute respiratory failure, unspecified (J96.0); and respiratory failure, unspecified (J96.9). Although we attempted to include transfusion-related lung injury (J95.84) in this list, the MCOD database does not delineate the J95.8 group to the hundredth decimal position; therefore, we could not isolate this diagnosis from the others in the group, which include other postoperative pulmonary complications.
Finally, we graphed the published results of death counts from clinically determined ARDS in Olmsted County, Minnesota, from 2001 to 2008 alongside death counts from various acute respiratory diagnoses within this same county as determined by the MCOD database to highlight the disparity between clinical diagnosis of ARDS-related deaths and that determined by death certificate records (8).
Statistical Analysis
Age-adjusted mortality incidences were generated by the direct method using the 2000 U.S. Census Bureau’s population estimates. Incident rate ratios were calculated using quasi-Poisson regression, allowing for possible overdispersion. Effect modification of time on incident rate ratios was assessed using the χ2 test. Details on preparing WONDER aggregate age-adjusted rates for quasi-Poisson regression are provided in the online supplement. All data analysis was done using R 3.1.2 (http://www.R-project.org).
This study was submitted to the Emory University Institutional Review Board and deemed exempt from requiring full review for approval.
Results
Trends in ARDS-related Mortality in the United States
In the 15-year time period 1999–2013, a total of 36,424,223 deaths occurred in the Unites States, with 156,357 entries listing ARDS as any cause of death, meeting our study definition of ARDS-related mortality. The proportion of ARDS-related mortality in which ARDS was listed as the principal UCOD was 15.6% in 1999 and 16.5% in 2013. The majority of these deaths (94.9%) occurred in an inpatient medical facility, with small proportions occurring before arrival at the hospital (0.1%), in the emergency room (1.2%), in the decedent’s home (1.0%), in a hospice facility (0.3%), in a long-term care facility (1.5%), or in an unknown location (1.0%).
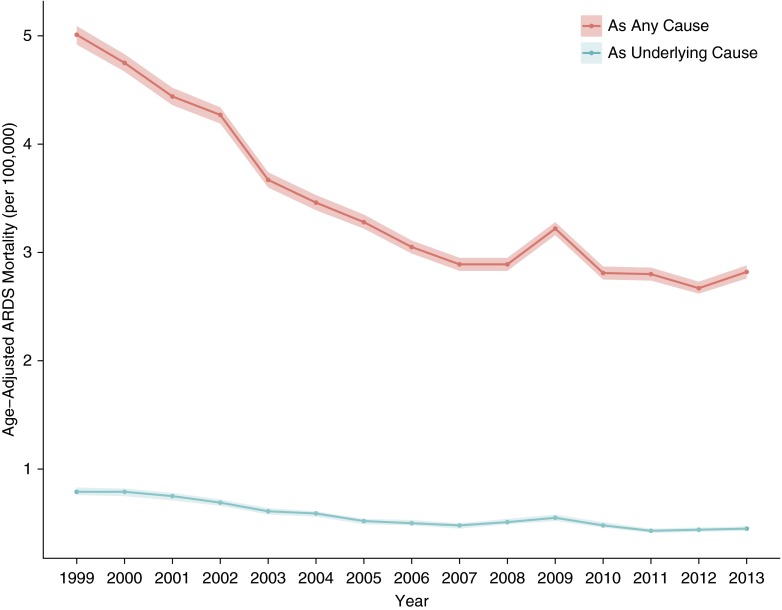
The overall number of ARDS-related deaths in the United States as determined by MCOD records decreased over the study period, from 13,612 in 1999 to 9,762 in 2013. The corresponding ARDS-related age-adjusted mortality rates also decreased, from 5.01 per 100,000 persons (95% confidence interval [CI], 4.92–5.09) to 2.82 per 100,000 persons (95% CI, 2.76–2.88) for 1999 and 2013, respectively (Figure 1; Table E4).
Figure 1.
Age-adjusted rates of acute respiratory distress syndrome (ARDS)–related mortality in the United States, 1999–2013. The red line displays mortality rates determined by a case definition of ARDS listed among any of the potentially 20 causes of death listed on a death record. The blue line displays mortality rates determined by ARDS listed as the principal underlying cause of death on a death record. The ribbons represent the 95% confidence limits of the estimates.
Demographic Characteristics
Table 1 describes ARDS-related mortality in the United States over the 1999–2013 study period by using demographic characteristics. The crude ARDS-related mortality rate was lower in the 5- to 14-year-old age group compared with the 1- to 4-year-old age group; it then increased in nearly every subsequent older age group. When adjusted for age, males had a higher average ARDS-related mortality rate than did females (incidence rate ratio [IRR], 1.33; 95% CI, 1.26–1.41). Asian/Pacific Islanders had the lowest average age-adjusted ARDS-related mortality rate, at 3.04 per 100,000 person-years (95% CI, 2.95–3.13), followed by white individuals at 3.33 per 100,000 person-years (95% CI, 3.31–3.35), with black/African-American individuals having the highest mortality rate (4.07 per 100,000 [95% CI, 4.01–4.12]) (Figure E1).
Table 1.
Average annual age-adjusted rates of acute respiratory distress syndrome–related mortality by demographic characteristic in the United States, 1999–2013
| Variable | No. Deaths (%) | Age-adjusted Rate Per 100,000 (95% CI) | Incident Rate Ratio (95% CI) | P Value |
|---|---|---|---|---|
| Sex | ||||
| Female | 76,029 (48.6) | 3.03 (3.01–3.05) | Referent | |
| Male | 80,328 (51.4) | 4.00 (3.97–4.03) | 1.33 (1.26–1.41) | <0.001 |
| Race* | ||||
| White | 130,216 (83.3) | 3.33 (3.31–3.35) | 1.06 (0.94–1.19) | 0.34 |
| Black or African American | 19,504 (12.5) | 4.07 (4.01–4.12) | 1.30 (1.14–1.48) | <0.001 |
| Asian or Pacific Islander | 4,895 (3.1) | 3.04 (2.95–3.13) | Referent | |
| Hispanic origin | ||||
| Hispanic or Latino | 13,101 (8.4) | 3.46 (3.39–3.52) | 1.05 (0.97–1.14) | 0.23 |
| Not Hispanic or Latino | 142,894 (91.4) | 3.43 (3.41–3.45) | Referent | |
| Urbanization (2006) | ||||
| Noncore (nonmetro) | 13,395 (8.6) | 3.79 (3.72–3.85) | 1.25 (1.16–1.36) | <0.001 |
| Micropolitan (nonmetro) | 19,829 (12.7) | 3.87 (3.81–3.92) | 1.28 (1.19–1.37) | <0.001 |
| Small metro | 16,328 (10.4) | 3.69 (3.63–3.74) | 1.23 (1.14–1.32) | <0.001 |
| Medium metro | 31,224 (20.0) | 3.38 (3.35–3.42) | 1.13 (1.07–1.20) | <0.001 |
| Large fringe metro | 32,131 (20.6) | 2.99 (2.96–3.02) | Referent | |
| Large central metro | 43,450 (27.8) | 3.49 (3.46–3.52) | 1.15 (1.09–1.21) | <0.001 |
| 10-yr age groups† | ||||
| 1–4 yr | 868 (0.5) | 0.37 (0.34–0.39) | 2.05 (1.50–2.81) | <0.001 |
| 5–14 yr | 1,095 (0.7) | 0.18 (0.17–0.19) | Referent | |
| 15–24 yr | 2,926 (1.8) | 0.46 (0.45–0.48) | 2.61 (2.05–3.34) | <0.001 |
| 25–34 yr | 4,838 (3.1) | 0.80 (0.78–0.82) | 4.49 (3.57–5.66) | <0.001 |
| 35–44 yr | 9,980 (6.4) | 1.55 (1.52–1.58) | 8.60 (6.91–10.72) | <0.001 |
| 45–54 yr | 20,177 (12.9) | 3.19 (3.14–3.23) | 18.04 (14.56–22.35) | <0.001 |
| 55–64 yr | 27,835 (17.8) | 5.86 (5.79–5.93) | 33.85 (27.36–41.87) | <0.001 |
| 65–74 yr | 34,569 (22.1) | 11.38 (11.26–11.50) | 64.86 (52.47–80.16) | <0.001 |
| 75–84 yr | 37,872 (24.2) | 19.51 (19.31–19.70) | 109.61 (88.71–135.44) | <0.001 |
| ≥85 yr | 16,197 (10.4) | 21.77 (21.43–22.10) | 124.66 (100.49–154.65) | <0.001 |
Definition of abbreviation: CI = confidence interval.
Race group “American Indian or Alaska Native” excluded because of small population size and large variance, making rate estimates unreliable.
Unable to calculate age-adjusted rates for age groups; therefore, these numbers represent crude rates and CIs.
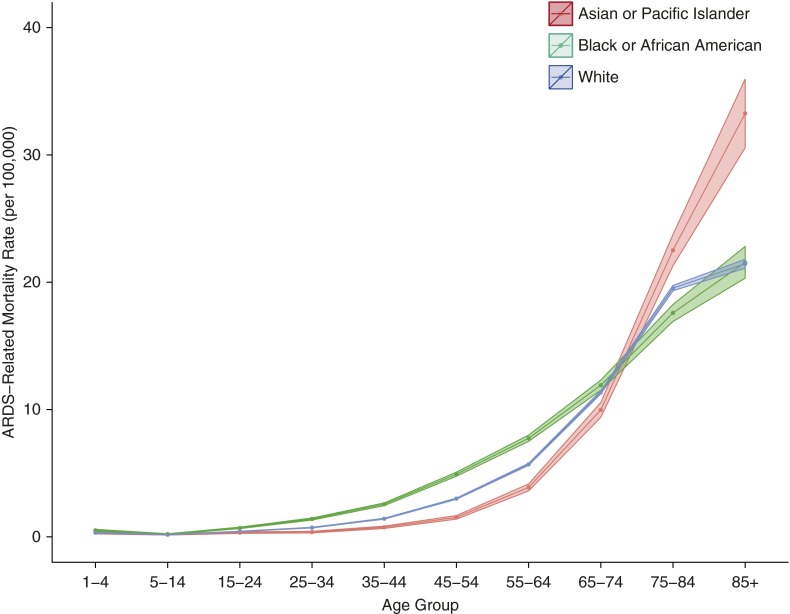
There was no effect modification of time in years on the relative age-adjusted mortality rates by race (χ2 test for interaction P = 0.24), as exemplified by the observation that the rate ratio between black/African-American individuals and Asian/Pacific Islanders did not grossly change from 1999 to 2013 (IRRs, 1.30 and 1.27, respectively). Furthermore, the differences in mortality rates by race depended on age and were the most pronounced in the 45- to 64-year-old age groups, with a changing pattern after an age of approximately 70 years (Figure 2). There were no significant differences in the average age-adjusted mortality rates between Hispanics and non-Hispanics (IRR, 1.05; 95% CI, 0.97–1.14).
Figure 2.
Average annual crude rates of acute respiratory distress syndrome (ARDS)–related mortality by age group and race in the United States, 1999–2013. The ribbons represent the 95% confidence limits of the estimates.
Geographic Distributions
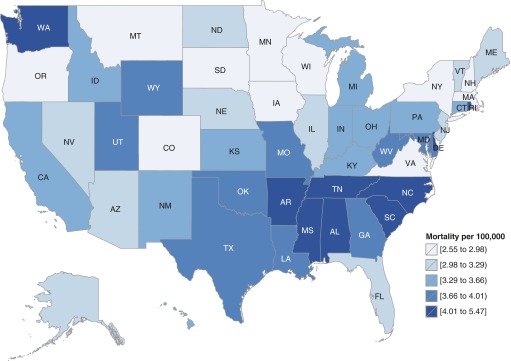
The average annual age-adjusted ARDS-related mortality rates varied by US Census Region (maximum, 3.39; minimum, 2.96; and absolute difference, 0.43 deaths per 100,000) and U.S. Census Division (maximum, 4.50; minimum, 2.95; and absolute difference; 1.55 deaths per 100,000) (Table 2). There was even more variation among states, with Alabama having the highest annual average mortality rate (5.47 per 100,000) and New York having the lowest (2.55 per 100,000) (Table E5; Figure 3). In addition to a geographic distribution with higher risk concentrated in the southeastern states, the pattern of ARDS-related deaths also demonstrates a seasonal periodicity over the course of each calendar year, with the higher death counts in the winter months and a nadir in the summer months (Figures E2 and E3).
Table 2.
Average annual age-adjusted rates of acute respiratory distress syndrome–related mortality by census geographic distributions in the United States, 1999–2013
| Geographic Designation | Average Age-adjusted Rate Per 100,000 (95% CI) | Incidence Rate Ratio (95% CI)* |
|---|---|---|
| Census region | ||
| Northeast | 2.96 (2.93–3.00) | 0.86 (0.81–0.92) |
| Midwest | 3.27 (3.24–3.31) | 0.95 (0.90–1.01) |
| South | 3.80 (3.77–3.83) | 1.11 (1.06–1.16) |
| West | 3.39 (3.35–3.42) | 1.00 (0.94–1.06) |
| Census division | ||
| New England | 3.00 (2.93–3.07) | 0.88 (0.80–0.96) |
| Middle Atlantic | 2.95 (2.91–2.99) | 0.86 (0.81–0.91) |
| East North Central | 3.32 (3.28–3.37) | 0.96 (0.91–1.01) |
| West North Central | 3.17 (3.11–3.23) | 0.92 (0.85–0.99) |
| South Atlantic | 3.49 (3.45–3.53) | 1.02 (0.98–1.07) |
| East South Central | 4.50 (4.42–4.58) | 1.31 (1.22–1.41) |
| West South Central | 3.94 (3.89–4.00) | 1.16 (1.10–1.23) |
| Mountain | 3.19 (3.12–3.25) | 0.94 (0.87–1.01) |
| Pacific | 3.50 (3.45–3.54) | 1.02 (0.97–1.07) |
Definition of abbreviation: CI = confidence interval.
Rate ratios are calculated using the US national annual average age-adjusted rate of 3.45 per 100,000 as the referent because there is no inherent order of interest in geography.
Figure 3.
Average annual age-adjusted rates of acute respiratory distress syndrome–related mortality by state in the United States, 1999–2013.
Other Causes of Death Associated with ARDS-related Deaths
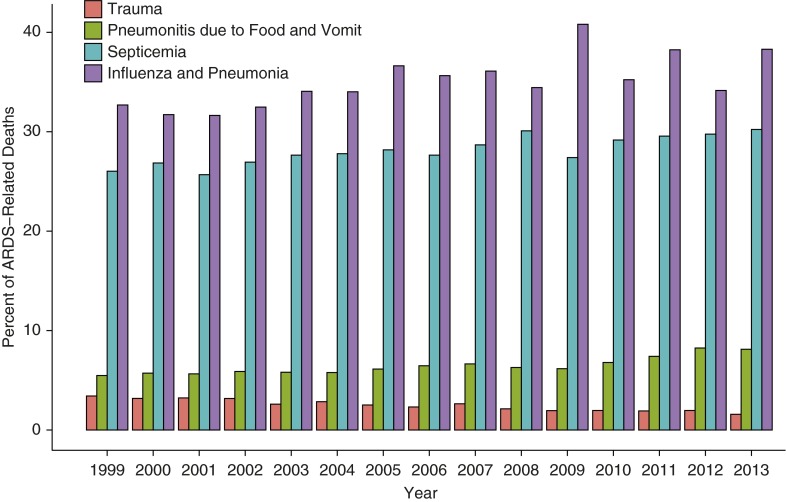
Averaged over the study period, influenza and pneumonia diagnoses were listed as other underlying causes of death in 35.1% of ARDS-related deaths. Septicemia diagnoses, trauma diagnoses, and pneumonitis caused by food and vomit diagnoses were each listed as other diagnoses in ARDS-related deaths in 28.1%, 2.5%, and 6.4% of death records, respectively (these are potentially overlapping categories). Figure 4 displays the annual percentages of ARDS-related deaths with these diagnostic categories also listed on the death record. Influenza and pneumonia had an average 0.4% increase per year with a notable spike in 2009, septicemia had a 0.3% increase per year, and pneumonitis caused by food and vomit had a 0.2% increase per year, whereas trauma had a 0.1% decrease (Table E6).
Figure 4.
Annual proportions of acute respiratory distress syndrome (ARDS)–related deaths with other accompanying diagnoses in the United States, 1999–2013. The categories for associated diagnoses are not mutually exclusive and may be counted in multiple categories. For example, a death record with ARDS, a septicemia diagnosis, and a pneumonia diagnosis would be counted in both the Septicemia and the Influenza and Pneumonia groups.
Post Hoc Sensitivity Analyses
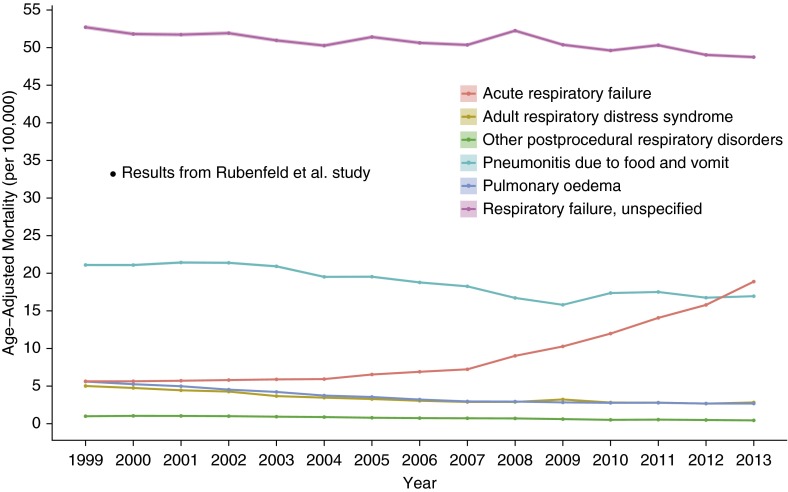
Figure 5 demonstrates temporal trends of ARDS-related mortality alongside the rates of deaths with codes for other respiratory diagnoses that may be assigned instead of an ARDS diagnosis on a death certificate. Although the majority of the temporal trends are declining similarly, “Acute respiratory failure” is the exception, with a nonlinear increasing rate starting around 2004.
Figure 5.
Age-adjusted mortality rates from acute respiratory causes in the United States, 1999–2013. The superimposed data point is extrapolated from published study results (9). It represents 33.2 deaths per 100,000, which was calculated by multiplying the 86.2 acute respiratory distress syndrome cases per 100,000 by the 38.5% in-hospital case fatality reported in the study.
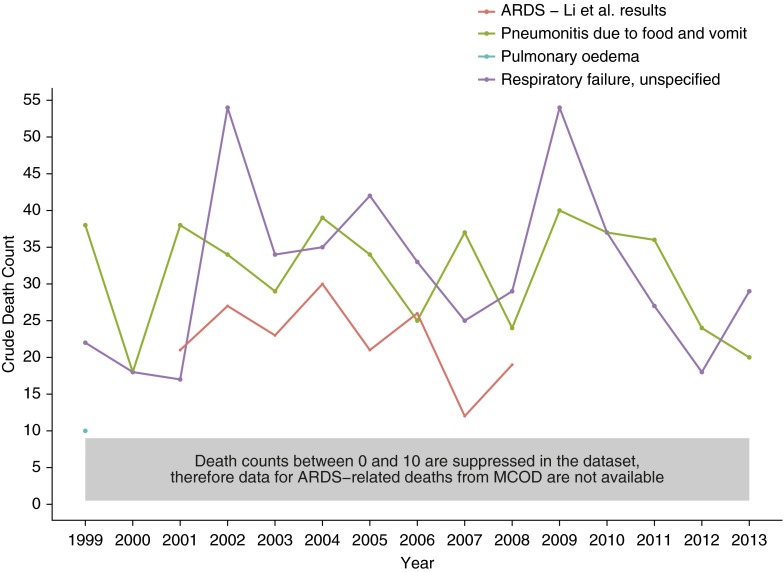
Because the MCOD database can provide data at the county level, we graphed temporal trends of ARDS-related death counts alongside death counts from other respiratory diagnoses in Olmstd County, Minnesota (Figure 6). We then superimposed the annual ARDS death counts provided in the results from the Li and colleagues clinical study of ARDS incidence that captured all of Olmsted County from 2001 to 2008 (8). Given the dataset’s rules regarding the suppression of data with counts below 10 at the county level, ARDS-related deaths and “Acute respiratory failure” do not appear on the graph, whereas the counts from “Respiratory failure, unspecified” and “Pneumonitis due to food and vomit” lie above the clinically determined counts from Li and colleagues (8).
Figure 6.
Comparison of crude death counts from acute respiratory causes as determined by death certificates and a clinical study in Olmsted County, Minnesota, 1999–2013. The red line represents in-hospital death counts of acute respiratory distress syndrome (ARDS) as reported in published study results (8). The other data were extracted for Olmsted County, Minnesota, using the Centers for Disease Control and Prevention’s (CDC) Wide-ranging Online Data for Epidemiologic Research (WONDER) Multiple Cause of Death (MCOD) dataset. Although ARDS defined in the MCOD database was included in the data request, the data did not meet the CDC’s minimal requirements of >10 counts to be reported.
Finally, the primary analyses were reperformed using an alternative case definition, with an ARDS death defined as the ARDS diagnosis listed as the principal UCOD rather than among any of the potentially 20 diagnoses listed on the death record (MCOD). Figure 1 includes the temporal trends of ARDS mortality as UCOD in the United States, showing a decreased magnitude of cases when compared with ARDS as MCOD, but with a similar nonlinear, downward trend with a slight increase in 2009, and then a plateau. More specifically, the age-adjusted mortality from ARDS as UCOD decreased from 0.79 per 100,000 (95% CI, 0.76–0.83) in 1999 to 0.45 per 100,000 in 2013 (95% CI. 0.43–0.47). Regarding the relative risks calculated using the UCOD and MCOD definitions, the directions of the IRRs are consistent, with some differences in magnitude (Table E7). Some of the geographic comparisons of ARDS-related mortality do change depending on case definition, particularly in the Northeast and West Census Regions and the Middle Atlantic, South Atlantic, and Pacific Census Divisions (Table E8; Figure E4).
Discussion
This study represents an important examination of the national epidemiology of ARDS-related mortality in the United States from 1999 to 2013, addressing temporal, seasonal, geographic, and demographic trends, as well as highlighting inconsistencies between administrative and clinical data. The national ARDS-related mortality generally decreased from 1999 to 2007, increased in 2009 when the United States was afflicted by the H1N1 influenza pandemic, and was relatively stable from 2010 to 2013. The current observed trend is a consistent continuation of the trends noted by a prior U.S. study spanning 1979 to 1996, which used the same dataset but used International Classification of Diseases, Ninth Revision, Clinical Modification codes to define ARDS. (We used the ICD-10 codes that were implemented in this dataset in 1999). That study demonstrated an increase in ARDS mortality from 1979 to 1993 from 5.0 to 8.1 deaths per 100,000 persons, with a subsequent decrease from 1993 to 1996 to 7.4 per 100,000 persons, identifying a nearly continuous decline of ARDS-related deaths coded on death certificates from 1993 to 2013 (11).
Dataset
This study used a dataset accounting for every recorded death certificate within the United States; however, its results are representative only of the trends and burden of ARDS-related deaths captured by ICD-10 coding practices. Although its strength is that it includes the entire US population without any sampling performed, a limitation of this study is that it cannot address the specific reasons for these trends. The decline in ARDS-related mortality from 1999 to 2007 could be a result of decreases in (1) the incidence of ARDS, (2) the case fatality rate from ARDS, (3) both of these metrics, and/or (4) death certificate coding.
Comparison with Other Studies
In trying to disentangle these mechanisms using results of other studies that clinically define ARDS cases, we discover conflicting results. We find similar absolute numbers in several European studies, much higher numbers in U.S. studies, and at least two different patterns of the case incidence/case fatality trends. An incidence study using a sample of hospitals in Spain in 2008 estimated 7.2 cases per 100,000 persons, with 47.8% in-hospital mortality (21). With the assumption that most fatalities do not occur outside the hospital, this estimates 3.4 ARDS-related deaths per 100,000 persons, similar to our 2008 estimate of 3.0. Similarly, a longitudinal study of hospitals in Iceland from 1988 to 2010 demonstrated an average of 7.2 cases per 100,000, with a 37.0% in-hospital fatality, estimating an average of 2.6 ARDS-related deaths per 100,000 (22). This Icelandic study also demonstrated increasing ARDS case incidence, with a concurrently decreasing ARDS case fatality (22).
In the United States, one study examining a large representative sample of national hospital discharges from 1992 to 2007 demonstrated a similar longitudinal pattern of an increase in the incidence of ARDS with an overall decline in case fatality, yet with significantly larger incidences ranging from 36.1 to 106.1 per 100,000 persons (7). Another study of patients participating in clinical trials of ARDS, although unable to estimate a population incidence, demonstrated decreases in case fatalities from ARDS from 1996 to 2005 (23). In contrast, a study of Olmsted County, Minnesota, from 2001 to 2008 showed a declining incidence of ARDS (ranging from 82.4 to 38.9 cases per 100,000), without a change in case fatality (8). Finally, in a 16-month study spanning 1999 to 2000 in King County, Washington, there were an estimated 86.2 cases per 100,000, with an in-hospital mortality of 38.5%, estimating 33.2 ARDS-related deaths per 100,000 (estimate plotted in Figure 5 for comparisons) (9). Therefore, there is not a completely uniform pattern of trends in case incidence and case fatality across these studies that determined ARDS cases using clinical data.
Coding Practices
Regarding the confounding of coding practices on the results, our data suggest several key points. Changing our case definition from ARDS as a diagnosis listed among any on the death record to ARDS listed as the principal UCOD did not greatly affect estimates of relative risk of ARDS-related death across demographic characteristics but did reveal different relative risk estimates on the basis of geographic characteristics. This suggests regional differences in ARDS death certificate coding practices. In addition, the low estimates of ARDS deaths observed in this study when compared with results from clinical studies suggests that a majority of ARDS-related deaths are not being coded for on death certificates.
Figure 5 leads us to hypothesize that other codes, such as “Respiratory failure, unspecified,” may be coded in death certificates instead of ARDS. Furthermore, when we compared the data from a clinical study encompassing all of Olmsted County and data from the MCOD database in this county over the same time period, there were fewer than 10 cases per year of deaths with ARDS recorded on death certificates, whereas the clinical study determined 16–20 ARDS deaths per year (Figure 6) (8).
Furthermore, regarding the other causes of death associated with ARDS-related mortality, trauma as an additional cause of death comprised only 2.5% of ARDS-related deaths. This may be because ARDS secondary to trauma seems to have a lower incidence and a lower case fatality or because surgeons may be less likely than internists to code for this diagnosis (9, 22, 23). Septicemia diagnoses listed as another cause of death comprised a major portion of ARDS-related deaths, at 28.1%. The limitations of this dataset, unfortunately, did not allow us to calculate precisely how many ARDS-related deaths were recorded on death records without an accompanying causal diagnosis.
These are troubling findings because ARDS and the severe respiratory and commonly associated multiorgan failure should be sentinel clinical events proximate to the time of death. Given that the listing of diagnoses on a death certificate has no financial incentives, the conceivable hypotheses as to why ARDS is undercoded on death certificates are numerous. We hypothesize that these findings result from a combination of the following: (1) physicians not confidently recognizing the diagnosis, (2) decreasing use of routine chest radiographs and arterial blood gases needed to make the diagnosis; (3) physicians filling out the document erroneously; (4) ARDS cases surviving longer until time of death, leading to the diagnosis being less salient; and (5) increases in transfers to palliative care facilities, where the diagnosis may be less commonly used.
Demographics
This study does reveal relative disparities in ARDS-related mortality. Of note, it did not determine whether these disparities are necessarily specific to ARDS and therefore, the observed disparities may be a reflection of overall trends for all-cause mortality. With this in mind, we found that males had an approximately 30% higher age-adjusted mortality rate over the study period. Regarding race, black/African-American individuals suffer an approximately 30% higher mortality rate compared with whites or Asian/Pacific Islanders. However, given that the overall mortality rates from ARDS have been decreasing over time, the absolute mortality difference among racial groups may be decreasing.
Regarding geographic trends, it is not surprising that more variation in ARDS-related mortality is revealed the smaller the geographic unit analysis, and at the state level, there are states that have ARDS-related mortality rates outside of the 95% CI of the national average rate. In general, there seem to be higher rates of ARDS-related mortality in the southeastern states, as well as in Washington State. Because the granularity of the data source does not allow further investigation as to the causes of this geographical distribution, explanations remain purely speculative but include: differences in underlying all-cause mortality rates, differences in underlying comorbidity and severity of illness, differences in recognition and coding, and potentially true differences in underlying ARDS-inciting events.
A further important implication of this geographical variation may be that it advises caution in generalizing the results of epidemiological studies drawn from a specific geographic area (8, 9). Regarding the seasonal variation of ARDS-related mortality, there is a peak in the winter months that we speculate is likely because influenza and pneumonia diagnoses are associated with 35.1% of ARDS-related deaths and these respiratory illnesses cluster in the fall and winter seasons in the northern hemisphere.
Conclusions
The national ARDS-related mortality rates as recorded on U.S. death certificates likely largely underestimate the true number of ARDS deaths, yet show patterns of seasonal periodicity with increases in fall and winter, relative racial and sex disparities, and an overall decrease from 1999 to 2013, with stabilization of the age-adjusted mortality rates in recent years.
Footnotes
Supported by National Center for Advancing Translational Sciences of the National Institutes of Health grants UL1 TR000454 and KL2 TR000455 (J.A.K.) and, in part, by Food and Drug Administration grant FD R01003440 (G.S.M.) and National Institutes of Health grants UL1 TR000454 and P50 AA013757 (G.S.M.).
Author Contributions: S.E.C. contributed to data acquisition, data management, study design, and manuscript writing; J.A.K. contributed to study design, data analysis, and manuscript writing; S.A. contributed to study design, data acquisition, and manuscript preparation; M.R.K. contributed to study design, data analysis, and manuscript preparation; and G.S.M. contributed to study design and manuscript preparation.
This article has an online supplement, which is accessible from this issue’s table of contents at www.atsjournals.org
Author disclosures are available with the text of this article at www.atsjournals.org.
References
- 1.Ranieri VM, Rubenfeld GD, Thompson BT, Ferguson ND, Caldwell E, Fan E, Camporota L, Slutsky AS ARDS Definition Task Force. Acute respiratory distress syndrome: the Berlin Definition. JAMA. 2012;307:2526–2533. doi: 10.1001/jama.2012.5669. [DOI] [PubMed] [Google Scholar]
- 2.Fujishima S. Pathophysiology and biomarkers of acute respiratory distress syndrome. J Intensive Care. 2014;2:32. doi: 10.1186/2052-0492-2-32. [DOI] [PMC free article] [PubMed] [Google Scholar]
- 3.Wheeler AP, Bernard GR. Acute lung injury and the acute respiratory distress syndrome: a clinical review. Lancet. 2007;369:1553–1564. doi: 10.1016/S0140-6736(07)60604-7. [DOI] [PubMed] [Google Scholar]
- 4.Bernard GR, Artigas A, Brigham KL, Carlet J, Falke K, Hudson L, Lamy M, LeGall JR, Morris A, Spragg R The Consensus Committee. Report of the American-European consensus conference on ARDS: definitions, mechanisms, relevant outcomes and clinical trial coordination. Intensive Care Med. 1994;20:225–232. doi: 10.1007/BF01704707. [DOI] [PubMed] [Google Scholar]
- 5.Ashbaugh DG, Bigelow DB, Petty TL, Levine BE. Acute respiratory distress in adults. Lancet. 1967;2:319–323. [Google Scholar]
- 6.Hernu R, Wallet F, Thiollière F, Martin O, Richard JC, Schmitt Z, Wallon G, Delannoy B, Rimmelé T, Démaret C, et al. An attempt to validate the modification of the American-European consensus definition of acute lung injury/acute respiratory distress syndrome by the Berlin definition in a university hospital. Intensive Care Med. 2013;39:2161–2170. doi: 10.1007/s00134-013-3122-6. [DOI] [PubMed] [Google Scholar]
- 7.Cooke CR, Erickson SE, Eisner MD, Martin GS. Trends in the incidence of noncardiogenic acute respiratory failure: the role of race. Crit Care Med. 2012;40:1532–1538. doi: 10.1097/CCM.0b013e31824518f2. [DOI] [PMC free article] [PubMed] [Google Scholar]
- 8.Li G, Malinchoc M, Cartin-Ceba R, Venkata CV, Kor DJ, Peters SG, Hubmayr RD, Gajic O. Eight-year trend of acute respiratory distress syndrome: a population-based study in Olmsted County, Minnesota. Am J Respir Crit Care Med. 2011;183:59–66. doi: 10.1164/rccm.201003-0436OC. [DOI] [PMC free article] [PubMed] [Google Scholar]
- 9.Rubenfeld GD, Caldwell E, Peabody E, Weaver J, Martin DP, Neff M, Stern EJ, Hudson LD. Incidence and outcomes of acute lung injury. N Engl J Med. 2005;353:1685–1693. doi: 10.1056/NEJMoa050333. [DOI] [PubMed] [Google Scholar]
- 10.Goss CH, Brower RG, Hudson LD, Rubenfeld GD ARDS Network. Incidence of acute lung injury in the United States. Crit Care Med. 2003;31:1607–1611. doi: 10.1097/01.CCM.0000063475.65751.1D. [DOI] [PubMed] [Google Scholar]
- 11.Moss M, Mannino DM. Race and gender differences in acute respiratory distress syndrome deaths in the United States: an analysis of multiple-cause mortality data (1979- 1996) Crit Care Med. 2002;30:1679–1685. doi: 10.1097/00003246-200208000-00001. [DOI] [PubMed] [Google Scholar]
- 12.Amato MB, Barbas CS, Medeiros DM, Magaldi RB, Schettino GP, Lorenzi-Filho G, Kairalla RA, Deheinzelin D, Munoz C, Oliveira R, et al. Effect of a protective-ventilation strategy on mortality in the acute respiratory distress syndrome. N Engl J Med. 1998;338:347–354. doi: 10.1056/NEJM199802053380602. [DOI] [PubMed] [Google Scholar]
- 13.Ventilation with lower tidal volumes as compared with traditional tidal volumes for acute lung injury and the acute respiratory distress syndrome. The Acute Respiratory Distress Syndrome Network. N Engl J Med. 2000;342:1301–1308. doi: 10.1056/NEJM200005043421801. [DOI] [PubMed] [Google Scholar]
- 14.Guérin C, Reignier J, Richard JC, Beuret P, Gacouin A, Boulain T, Mercier E, Badet M, Mercat A, Baudin O, et al. PROSEVA Study Group. Prone positioning in severe acute respiratory distress syndrome. N Engl J Med. 2013;368:2159–2168. doi: 10.1056/NEJMoa1214103. [DOI] [PubMed] [Google Scholar]
- 15.Papazian L, Forel JM, Gacouin A, Penot-Ragon C, Perrin G, Loundou A, Jaber S, Arnal JM, Perez D, Seghboyan JM, et al. ACURASYS Study Investigators. Neuromuscular blockers in early acute respiratory distress syndrome. N Engl J Med. 2010;363:1107–1116. doi: 10.1056/NEJMoa1005372. [DOI] [PubMed] [Google Scholar]
- 16.CDC WONDERAbout multiple cause of death, 1999–2014 [updated 2015; accessed 2015. July]. Available from: http://wonder.cdc.gov/mcd-icd10.html
- 17.CDC National Center for Health StatisticsMortality Medical Data System [updated 2015 November 6; accessed 2016 February 18]. Available from: http://www.cdc.gov/nchs/nvss/mmds.htm
- 18.Ingram DD, Franco SJ. NCHS urban-rural classification scheme for counties. Vital Health Stat 2. 2012. pp. 1–65. [PubMed]
- 19.Melamed A, Sorvillo FJ. The burden of sepsis-associated mortality in the United States from 1999 to 2005: an analysis of multiple-cause-of-death data. Crit Care. 2009;13:R28. doi: 10.1186/cc7733. [DOI] [PMC free article] [PubMed] [Google Scholar]
- 20.National Trauma Data Standard of the National Trauma DatabankNTDS 2015 admissions data dictionary [accessed 2016 Jan]. Available from: http://www.ntdsdictionary.org/
- 21.Villar J, Blanco J, Añón JM, Santos-Bouza A, Blanch L, Ambrós A, Gandía F, Carriedo D, Mosteiro F, Basaldúa S, et al. ALIEN Network. The ALIEN study: incidence and outcome of acute respiratory distress syndrome in the era of lung protective ventilation. Intensive Care Med. 2011;37:1932–1941. doi: 10.1007/s00134-011-2380-4. [DOI] [PubMed] [Google Scholar]
- 22.Sigurdsson MI, Sigvaldason K, Gunnarsson TS, Moller A, Sigurdsson GH. Acute respiratory distress syndrome: nationwide changes in incidence, treatment and mortality over 23 years. Acta Anaesthesiol Scand. 2013;57:37–45. doi: 10.1111/aas.12001. [DOI] [PubMed] [Google Scholar]
- 23.Erickson SE, Martin GS, Davis JL, Matthay MA, Eisner MD NIH NHLBI ARDS Network. Recent trends in acute lung injury mortality: 1996-2005. Crit Care Med. 2009;37:1574–1579. doi: 10.1097/CCM.0b013e31819fefdf. [DOI] [PMC free article] [PubMed] [Google Scholar]


