Abstract
Aberrant cellular accumulation of cholesterol is associated with neuronal lysosomal storage disorders such as Niemann-Pick disease Type C (NPC). We have shown previously that l-norephedrine (l-Nor), a sympathomimetic amine, induces necrotic cell death associated with massive cytoplasmic vacuolation in SH-SY5Y human neuroblastoma cells. To reveal the molecular mechanism underling necrotic neuronal cell death caused by l-Nor, we examined alterations in the gene expression profile of cells during l-Nor exposure. DNA microarray analysis revealed that the gene levels for cholesterol transport (LDL receptor and NPC2) as well as cholesterol biosynthesis (mevalonate pathway enzymes) are increased after exposure to 3 mm l-Nor for ∼6 h. Concomitant with this observation, the master transcriptional regulator of cholesterol homeostasis, SREBP-2, is activated by l-Nor. The increase in cholesterol uptake as well as biosynthesis is not accompanied by an increase in cholesterol in the plasma membrane, but rather by aberrant accumulation in cytoplasmic compartments. We also found that cell death by l-Nor can be suppressed by nec-1s, an inhibitor of a regulated form of necrosis, necroptosis. Abrogation of SREBP-2 activation by the small molecule inhibitor betulin or by overexpression of dominant-negative SREBP-2 efficiently reduces cell death by l-Nor. The mobilization of cellular cholesterol in the presence of cyclodextrin also suppresses cell death. These results were also observed in primary culture of striatum neurons. Taken together, our results indicate that the excessive uptake as well as synthesis of cholesterol should underlie neuronal cell death by l-Nor exposure, and suggest a possible link between lysosomal cholesterol storage disorders and the regulated form of necrosis in neuronal cells.
Keywords: cell death, cholesterol, neuroblastoma, toxicology, transcription regulation, DNA microarray, SREBP-2, necroptosis, norephedrine
Introduction
Norephedrine (Nor),2 also called phenylpropanolamine, is an alkaloid from Ephedra with the properties of sympathomimetic amines in that it acts as an adrenergic as well as dopamine receptor agonist (1, 2). Nor has been used in over-the-counter cough and appetite suppressants, weight loss agents, and cold medicines, but its use is restricted in the United States due to its risks of causing hemorrhagic stroke (3, 4). Among several stereoisomers of phenylpropanolamine, l-norephedrine (l-Nor) has the most potent psychoactive properties. We have shown previously that l-Nor induces cytoplasmic vacuolation as well as necrotic death in SH-SY5Y human neuroblastoma cells (5). During the cell death process, cytoprotective autophagy is rapidly suppressed due to the impairment of lysosome function (5). However, events that connect lysosome dysfunction and necrotic death in l-Nor-treated neuronal cells are largely unknown.
Cholesterol supply is essential for the development and homeostasis of the central nervous system (CNS). Cholesterol is synthesized mainly in the liver, and supplied to other organs as a component of low-density lipoprotein (LDL), in which cholesterol is included in an esterified form (cholesteryl ester) (6, 7). After binding to the LDL receptor (LDLR), cholesteryl ester is transported into lysosomes and released in its non-esterified form (free cholesterol) to be utilized in the construction of cellular membranous structures (7). The cholesterol synthesis pathway (mevalonate pathway) comprises more than 20 enzymes and uses acetyl-CoA as the starting material. Because cholesterol cannot be transported across the blood-brain barrier, the amounts required by the CNS are supplied mainly from the glia and, to a lesser extent, from the neurons (8, 9). The intracellular accumulation of cholesterol has been reported in the brains of the patients suffering from neurodegenerative disorders such as Alzheimer's disease (10) and Niemman-Pick syndrome (11), suggesting that cholesterol homeostasis is important for the maintenance of the CNS.
Both the uptake and biosynthesis of cholesterol are regulated by sterol regulatory element binding protein-2 (SREBP-2) (12). SREBP-2 is a basic helix-loop-helix leucine zipper (b-HLH-ZIP)-type transcriptional regulator that resides on the ER membrane in cholesterol-rich cells. A decrease in cellular cholesterol levels is sensitized by the SREBP-cleavage activating protein (SCAP), which contains a sterol-sensing domain and regulates SREBP-2 activation together with the insulin-inducible gene (Insig) protein (13, 14). Upon a decrease in cellular cholesterol levels, the SREBP-2·SCAP complex is transported to the Golgi apparatus where SREBP-2 is cleaved at its N-terminal portion by the sequential activation of site-1 and site-2 proteases (15). The N-terminal DNA-binding and transcriptional activation domains of SREBP-2 are liberated from its precursor, and enter into the nucleus to induce the genes for cholesterol uptake, transport, and synthesis (e.g. LDLR, NPC1, and HMG-CoA reductase).
Necroptosis (regulated or programmed necrosis) is a form of cell death that has the morphological features of necrosis, but is executed by defined molecules in a regulated manner (16). Necroptosis was first observed in the necrotic death of L929 murine fibroblasts caused by TNFα stimulation in the presence of the caspase inhibitor Z-VAD (17). In these cells, TNFα induces necrosis instead of apoptosis due to the presence of Z-VAD and the resultant suppression of the caspase cascade. Later studies revealed that receptor-interacting protein kinases 1 and 3 (RIP1 and RIP3) (18), along with the mixed lineage kinase domain-like (MLKL) protein as the downstream effecter (19), play pivotal roles in necroptosis. Necroptosis is inhibited by small molecule inhibitors such as necrostatin-1 (nec-1) and necrosulfonamide, which are specific inhibitors of RIP1 (20) and MLKL (19), respectively. Recently, an optimized analogue of nec-1, nec-1s, has been developed. The side effects of nec-1 on indoleamine-2,3-dioxygenase activity are eliminated by using nec-1s (21). Necroptosis is not an artificial form of cell death observed only in the presence of Z-VAD in vitro: for example, neuronal cell death in ischemic mouse brain has been shown to include necroptosis (20). Necroptosis has been implicated in multiple human diseases including neurodegenerative and systemic inflammatory diseases (22).
In this study, we examined the cellular events occurring in human neuronal SH-SY5Y cells, as well as the primary culture of mouse neurons, undergoing necrotic cell death during l-Nor exposure. DNA microarray analysis suggested the up-regulation of cholesterol biosynthesis, which was confirmed by quantitative real-time PCR and gas chromatography-mass spectrometry (GC-MS). However, fluorescent microscopic analysis revealed the accumulation of cholesterol in cellular vesicular structures including lysosomes, indicating impairment in cholesterol transport to the plasma membrane. Altered cholesterol homeostasis leads to the death of neuronal cells through a necroptotic pathway, representing a novel connection among sympathomimetic amines, cholesterol homeostasis, and neuronal necrotic cell death.
Results
Increased Expression of the Genes for Cholesterol Metabolism in l-Nor-treated SH-SY5Y Cells
Alterations in gene expression during l-Nor exposure (3 mm, 2 and 6 h) in differentiated SH-SY5Y cells were examined by DNA microarray analysis. Many of the genes for cholesterol metabolism were found to be up-regulated simultaneously in l-Nor-treated cells: 11 genes in the cholesterol biosynthesis pathway (mevalonate pathway) were induced more than 2-fold, and one gene (farnesyl-diphosphate synthase) was induced by 1.5-fold after exposure to l-Nor for 6 h (Table 2). Key genes for cholesterol uptake and transport, LDLR and NPC1 and 2, were also up-regulated by l-Nor (Table 2).
TABLE 2.
Increased expression of the genes for the cholesterol biosynthetic mevalonate pathway as well as cholesterol uptake and transport in Nor-treated SH-SY5Y cells
| Gene symbol | Ref Seq transcript ID | Fold-change |
Gene name | |
|---|---|---|---|---|
| 2 h | 6 h | |||
| HMGCS1 | NM_002130 | 1.67 | 3.70 | 3-Hydroxy-3-methylglutaryl-coenzyme A synthase 1 |
| HMGCR | NM_000859 | 1.66 | 2.33 | 3-Hydroxy-3-methylglutaryl-coenzyme A reductase |
| MVK | NM_000431 | 1.49 | 2.27 | Mevalonate kinase |
| MVD | NM_002461 | 1.14 | 2.37 | Mevalonate (diphospho) decarboxylase |
| FDPS | NM_002004 | 1.02 | 1.51 | Farnesyl-diphosphate synthase |
| IDI1 | NM_004508 | 1.86 | 2.17 | Isopentenyl-diphosphate δ-isomerase 1 |
| FDFT1 | NM_004462 | 1.54 | 2.67 | Farnesyl-diphosphate farnesyltransferase 1 |
| SQLE | NM_003129 | 1.39 | 2.21 | Squalene epoxidase |
| LSS | NM_002340 | 1.03 | 2.34 | Lanosterol synthase |
| SC4MOL | NM_006745 | 2.13 | 3.34 | Sterol-C4-methyl oxidase-like |
| CYP51A1 | NM_000786 | 1.47 | 2.85 | Cytochrome P450, family 51, subfamily A, polypeptide 1 |
| DHCR7 | NM_001360 | 2.14 | 5.57 | 7-Dehydrocholesterol reductase |
| NPC1 | NM_000271 | 1.05 | 1.42 | Niemann-Pick disease, type C1 |
| NPC2 | NM_006432 | 1.31 | 1.75 | Niemann-Pick disease, type C2 |
| LDLR | NM_000527 | 4.87 | 4.84 | Low density lipoprotein receptor |
Increased Expression of the Genes for Cholesterol Biosynthesis, Uptake, and Turnover in Nor-treated SH-SY5Y Cells
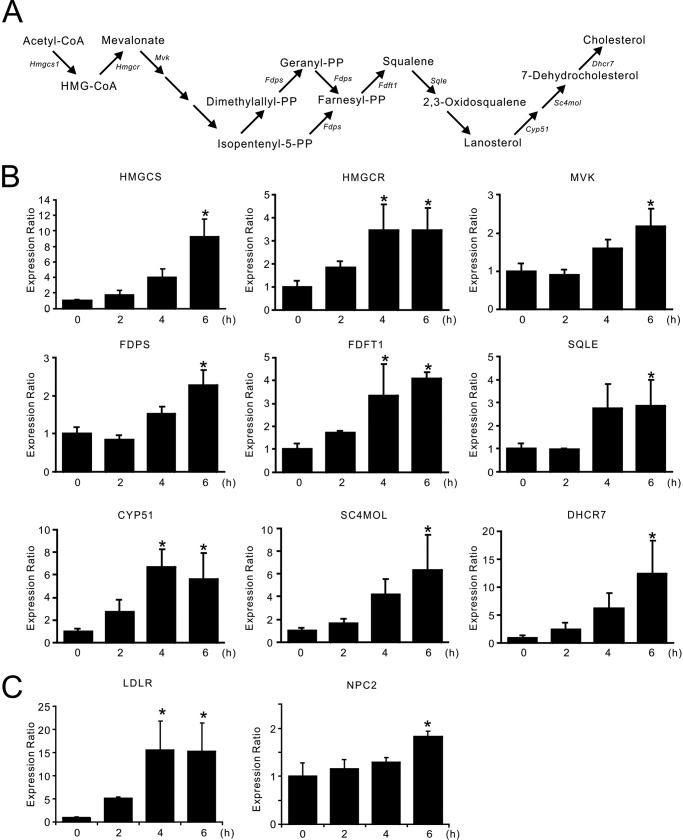
The pathway for cholesterol biosynthesis is summarized schematically in Fig. 1A. To confirm the results of the DNA microarray analysis, qPCR analysis was performed. Among the 12 genes in the mevalonate pathway that were suggested to be induced by l-Nor (Table 2), the elevation of 9 genes was confirmed (Fig. 1B). The increased expressions of LDLR as well as NPC2 in l-Nor-treated cells were also confirmed (Fig. 1C). We found approximately a 15-fold increase in the qPCR analysis (Fig. 1C) and 4.84-fold increase in the microarray analysis (Table 1) of LDLR gene expression after 6 h of 3 mm l-Nor treatment. Although estimated magnitudes of expression changes of each gene was different between the results from microarray analysis and qPCR analysis, all of the gene expressions tested by qPCR confirmed significant increases in response to l-Nor treatment (Fig. 1, B and C). These results indicate that the genes for cholesterol biosynthesis, uptake, and transport, are indeed induced in l-Nor-treated cells.
FIGURE 1.
Increased expression of the genes for cholesterol synthesis, uptake, and transport in SH-SY5Y cells exposed to l-Nor. A, pathway of cholesterol biosynthesis. B and C, increased expression of the genes for cholesterol biosynthesis (B) as well as uptake and transport (C). The cells were treated with 3 mm l-Nor for 2, 4, or 6 h, and the relative expression levels of the genes to that of β-actin were evaluated by qPCR. Data are shown as mean ± S.D. (n = 3). Essentially the same results were obtained in two independent experiments and a typical result is shown. *, p < 0.05 versus 0 h. NPC2, Niemann-Pick disease type C2.
TABLE 1.
Sequences of primers used for qPCR
| Gene | Forward primer (5′-3′) | Reverse primer (5′-3′) |
|---|---|---|
| HMGCS | GATGCTACACCGGGGTCTG | ATCATTTGGAGTGGGACGCC |
| HMGCR | ATTGCCTGTGGACAGGATGC | CCACACACAATTCGGGCAAG |
| MVK | CCAGCCCCGGAGCAGTACCT | TCTGGGTGGGGCTGCAGTGT |
| FDPS | GTGTGTGGAACTGCTGCAAG | GCAGGCGGTAGATACATGCT |
| FDFT1 | CCTCGAAGCACCTACTCCAC | AGCGAGTCCTGGTCCATCTT |
| SQLE | CTGCCACAGATGATTCCCTG | ACTGAGAAGGGCTCGAGGTT |
| CYP51 | CGACCTCGGCCTTCAGTGTT | ATGGAGGACTTTTCACCCCTG |
| SC4MOL | TTCATCATGAGTTTCAGGCTCCA | TGATGCCGAGAACCAGCATA |
| DHCR7 | ACAGAACCGCATCTCAAGGG | ACGTGTACAGAAGCACCTGG |
| LDLR | CATCAAAGAGTGCGGGACCA | CACTTGTAGCCACCCTCCAG |
| NPC2 | CAGGTTTGTCTTGTGACCGC | CTCCATCCACAGAACCGCAG |
| β-ACTIN | CCACGAAACTACCTTCAACTCC | TCATACTCCTGCTGCTTGCTGATCC |
Activation of SREBP-2 in l-Nor-treated SH-SY5Y Cells
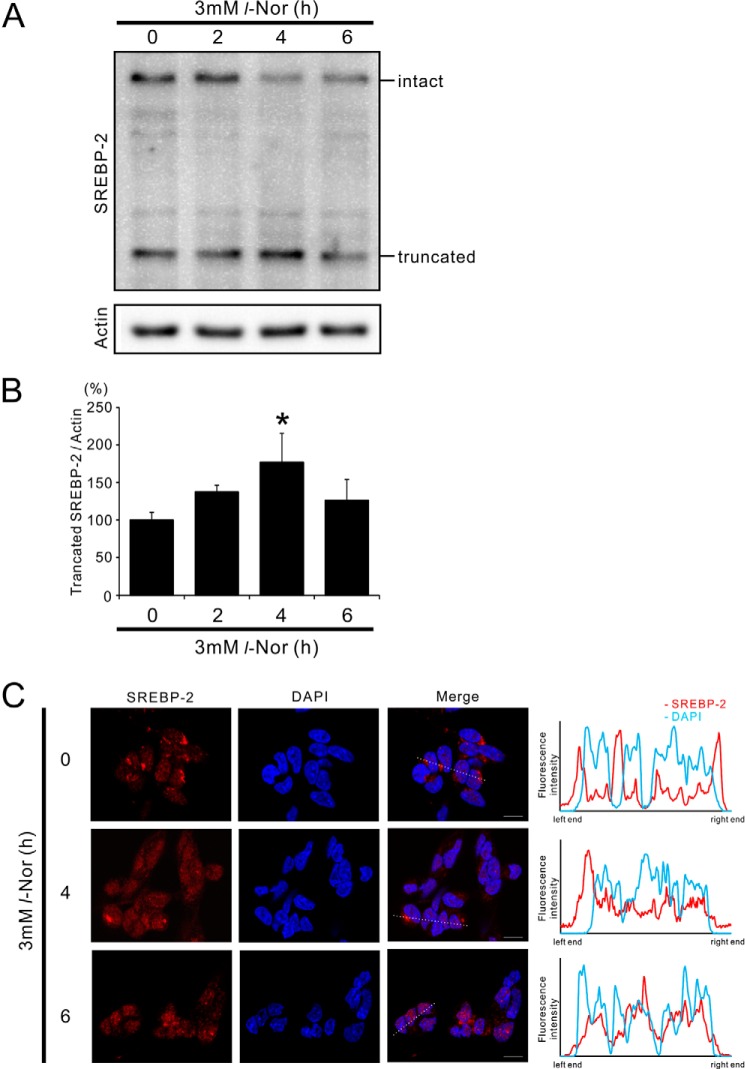
SREBP-2 is the master regulator of cholesterol homeostasis, and therefore we examined SREBP-2 activation in Nor-stimulated cells. SREBP-2 is anchored at the ER membrane in its precursor form, and is activated upon proteolysis by site-1 and site-2 proteases on the Golgi membrane (12). Western blot analysis showed that during l-Nor exposure the levels of the truncated active form of SREBP-2 increased with a concomitant decrease in its uncleaved intact form (Fig. 2, A and B). Corresponding to the induction of the genes for cholesterol metabolism within 4–6 h (Fig. 1, B and C), a significant increase in the level of truncated SREBP-2 was observed within 4 h of l-Nor exposure (Fig. 2, A and B). Parallel with the processing of SREBP-2 into its active form, SREBP-2 moved to the nucleus during l-Nor exposure: SREBP-2 was localized mainly to the perinuclear region in control cells, but localized to the nucleus in l-Nor-treated cells (Fig. 2C). Fluorescence intensity plot across the nucleus also confirmed the nuclear localization of SREBP2 in response to l-Nor (Fig. 2C). These results are consistent with the results shown in Table 2 and Fig. 1, and suggest that the up-regulation of cholesterol synthesis and uptake should be mediated by SREBP-2 activation.
FIGURE 2.
Activation of SREBP-2 in SH-SY5Y cells exposed with l-Nor. A, processing of SREBP-2 into its active form in l-Nor-treated SH-SY5Y cells. The cells were treated with 3 mm l-Nor for the indicated time periods and the cell lysates were subjected to immunoblot analysis using anti-SREBP-2 antibody. Processing of SREBP-2 from its inactive precursor form (intact) to truncated active form (truncated) is shown. Actin served as a loading control. Typical result from four independent experiments is shown. B, increased levels of truncated active SREBP-2 relative to actin in l-Nor-treated SH-SY5Y cells. Data are shown as mean ± S.D. from four experiments (n = 4). *, p < 0.05 versus 0 h. C, nuclear translocation of SREBP-2 in response to l-Nor stimulation. The cells were treated with 3 mm l-Nor for 0–6 h and subjected to immunofluorescence analysis with anti-SREBP-2 antibody and Alexa 549-labeled secondary antibody (red). Nuclei were also counterstained with DAPI (blue). Typical result from two experiments is shown. Right panels show fluorescence intensity plots along the dotted lines shown in fluorescence images. Scale bar, 10 μm.
Increase in Cellular Cholesterol Levels and Its Accumulation in Lysosomes in l-Nor-treated SH-SY5Y Cells
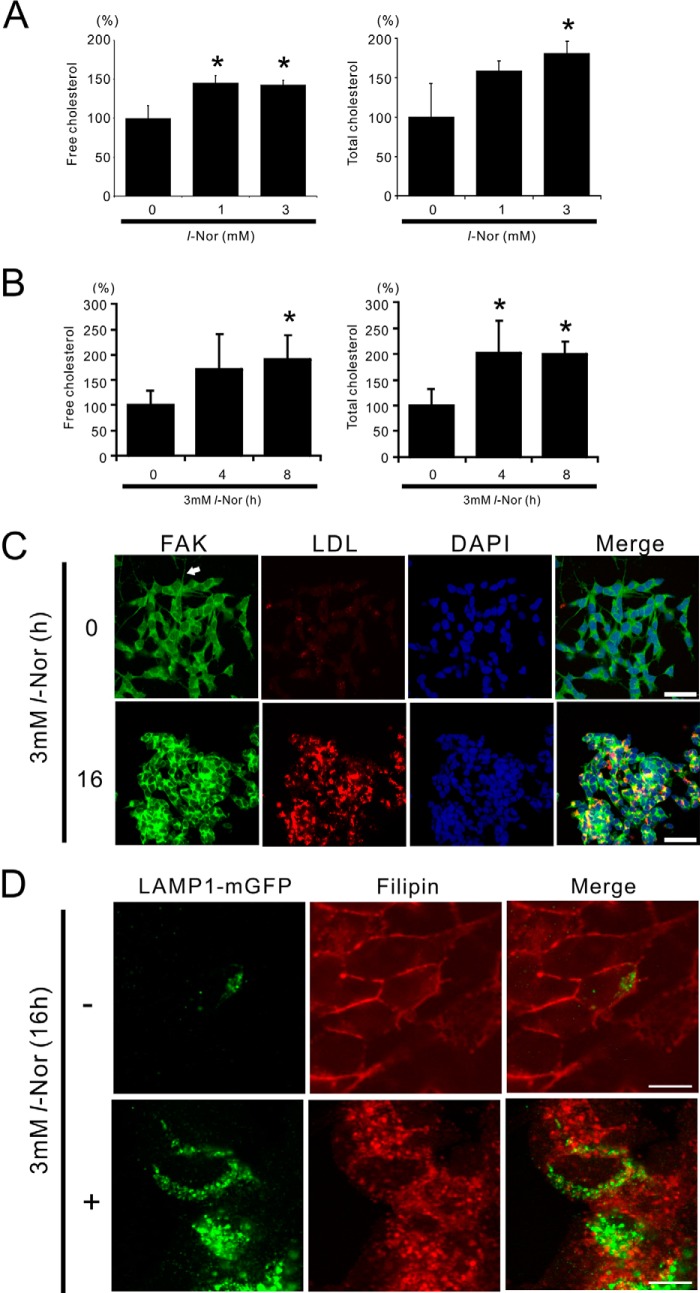
Intracellular levels of total (esterified plus unesterified) as well as free (unesterified) cholesterol were measured in cells treated with or without 1 or 3 mm l-Nor for 4 or 8 h. As shown in Fig. 3, A and B, the levels of both intracellular total and free cholesterol were increased in concentration and time dependently in response to l-Nor stimulation: the increase was reached by about 2-fold in 3 mm l-Nor-treated cells as compared with untreated cells. Cellular LDL uptake was also increased in response to l-Nor exposure, as demonstrated by the increased uptake of fluorescence dye-labeled LDL in l-Nor-treated cells (Fig. 3C). Interestingly, staining of the cells with an antibody against FAK, which is used as a marker of neuronal projections (23), showed that the projections are retracted in the cells treated with l-Nor (Fig. 3C). Thus, the induction of the genes for cholesterol biosynthesis, uptake, and transport (Table 2 and Fig. 1) should lead to the increase in cellular cholesterol levels in l-Nor-treated cells. However, the mobilization of cholesterol from intracellular vesicles to the plasma membrane seemed to be disrupted in l-Nor-treated cells. Cholesterol is incorporated into cells as a component of LDL, and delivered to lysosomes where the cholesteryl ester is converted into non-esterified free cholesterol for further transport to the ER, Golgi, or plasma membrane. Visualization of the cellular localization of cholesterol by filipin, which selectively stains free cholesterol (24), showed the free cholesterol distributed in intracellular vesicles including lysosomes in l-Nor-treated cells; the lysosomal membrane marker LAMP1 partially colocalized with the filipin-positive vesicular structures in Nor-treated cells (3 mm, 16 h; Fig. 3D). In contrast, free cholesterol localized mainly to the plasma membrane in non-treated cells (Fig. 3D). Taken together, despite the up-regulation in cholesterol levels, the proper transport of free cholesterol from intracellular vesicles to the plasma membrane was severely impaired in l-Nor-treated cells.
FIGURE 3.
Increased cholesterol levels in SH-SY5Y cells exposed to l-Nor. A and B, l-Nor increases cellular free and total cholesterol levels in SH-SY5Y cells. The cells were treated with 0, 1, or 3 mm l-Nor for 24 h (A) or 3 mm l-Nor for 0, 4, and 8 h (B), and the levels of cellular free and total cholesterol were determined by GC-MS. Cellular protein levels were also determined. Levels of cellular free (left panels) and total (right panels) cholesterol relative to cellular proteins are shown. Data are shown as mean ± S.D. (n = 3). Essentially the same results were obtained in two independent experiments and a typical result is shown. *, p < 0.05 versus 0 mm. C, l-Nor facilitates LDL uptake. The cells were incubated with a fluorescence dye-labeled LDL (LDL-DyLight 549, red) for 4 h and treated with 3 mm l-Nor for a further 16 h. The cells were also incubated with anti-FAK antibody to visualize neuronal projections and DAPI to stain the nucleus just before observation under confocal fluorescence microscopy. A typical result from two independent experiments is shown. Arrow indicates neurite-like protrusion. Scale bar, 50 μm. D, l-Nor causes the intracellular accumulation of free cholesterol. The cells were transfected with LAMP1-mGFP, stimulated with l-Nor (3 mm, 16 h), and stained with filipin dye. To show the colocalization of cholesterol and LAMP1 (green), the fluorescence from filipin was converted digitally from blue to red. A typical result from three independent experiments is shown. Scale bar, 10 μm.
Vacuolation of Lysosomes in l-Nor-treated SH-SY5Y Cells
We have shown previously that lysosomes are vacuolated in SH-SY5Y cells exposed to 3 mm l-Nor (5). This observation was also confirmed in the current experiments: fluorescent microscopic observation of LAMP1-mGFP-transfected cells indicated enlargement/dilation of the lysosomes after treatment with l-Nor (3 mm, 24 h; Fig. 4A). Transmission electron microscopic images of l-Nor-treated cells are shown in Fig. 4B. Consistent with the fluorescence observations (Fig. 4A), l-Nor-treated cells include numerous vacuoles in the cytoplasm (Fig. 4B), which was confirmed by counting large diameter (>2 μm) lysosomes in LAMP1-mGFP expressing stable cells after treatment with or without l-Nor (Fig. 4C). Many of these vacuoles contain cytoplasmic contents in their luminal milieu, suggesting that these are autophagic vacuoles (autolysosomes) (Fig. 4B). These results confirm our previous observation that lysosomal vacuolation inhibits autophagic flux in Nor-treated SH-SY5Y cells (5).
FIGURE 4.
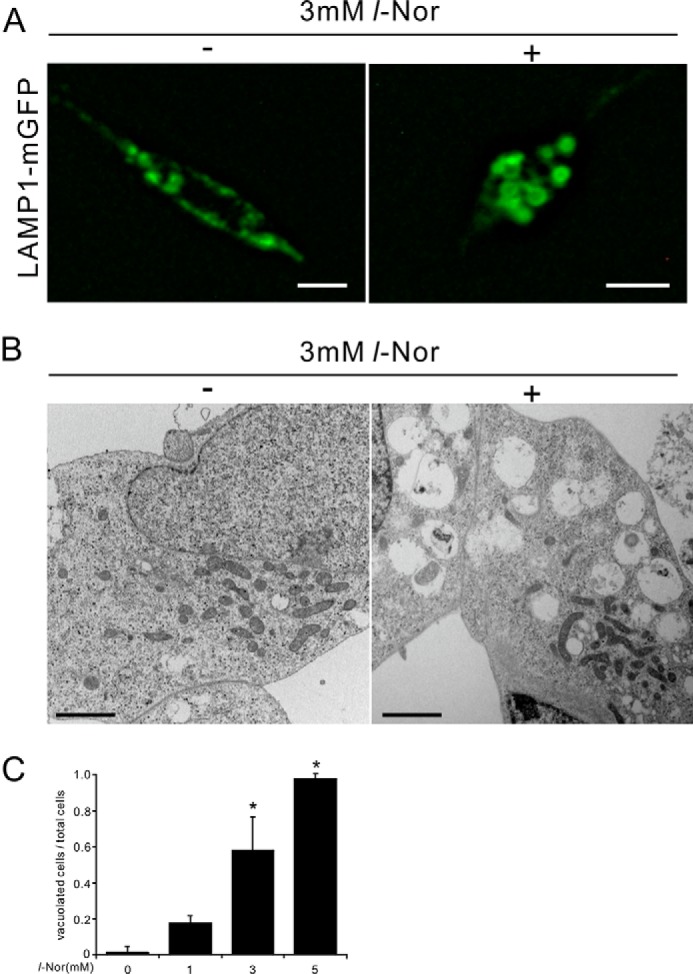
Lysosomal vacuolation in SH-SY5Y cells exposed to l-Nor. A, dilation of lysosomes in l-Nor-exposed SH-SY5Y cells. The cells were transfected with LAMP1-mGFP vector and treated with or without 3 mm l-Nor for 24 h. Fluorescence microscopy indicates LAMP1-positive membrane-closed vacuoles, suggesting lysosomal vacuolation. Scale bar, 10 μm. B, representative images of transmission electron micrographs of SH-SY5Y cells treated with or without l-Nor (3 mm, 24 h). Numerous vacuoles, often containing cytoplasmic contents in their structures, were observed in l-Nor-treated cells. Scale bar, 2 μm. C, l-Nor-exposed SH-SY5Y cells contain large vacuoles derived from lysosomes. SH-SY5Y cells stably expressing LAMP1-mGFP were treated with 0, 1, 3, or 5 mm l-Nor for 24 h and the ratios of the cells containing large vacuoles (>2 μm in diameter) to total cells were calculated. Data are shown as mean ± S.D. (n = 4). Essentially the same results were obtained in two independent experiments and a typical result is shown. *, p < 0.05 versus 0 mm.
Increased Phosphorylation of Necroptosis Mediator RIP3 in l-Nor-treated SH-SY5Y Cells
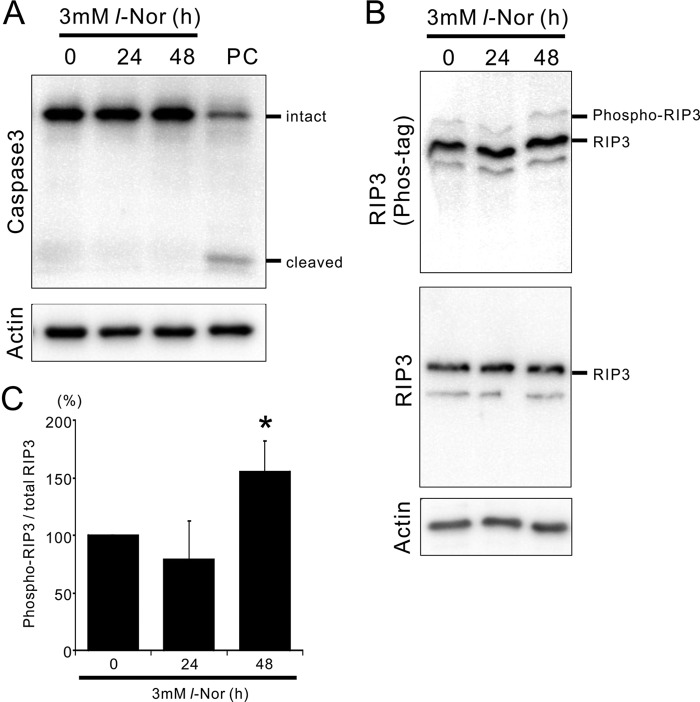
Next, we examined the mechanism responsible for cell death by l-Nor. The cleavage of caspase-3 into its active form was scarcely observed in cells treated with 3 mm l-Nor for ∼48 h (Fig. 5A), refuting the involvement of apoptosis and confirming the necrotic features of cell death as demonstrated in our previous report (5). Therefore, we examined the possible involvement of the machinery of necroptosis. It has been shown that RIP3, a mediator of necroptosis, is phosphorylated during the execution of necroptosis. Thus, we resolved the phosphorylated and non-phosphorylated forms of RIP3 using a phos-tag gel system. Electorphoresis in phos-tag gels and subsequent immunoblot analysis showed that the amount of phosphorylated RIP3 was significantly increased after exposure to 3 mm l-Nor for 48 h (Fig. 5, B and C). Total RIP3 levels remained constant during l-Nor exposure (Fig. 5B). Thus, it is plausible that necroptosis is involved in the death of l-Nor-treated cells.
FIGURE 5.
Activation of the necroptosis mediator RIP3 in SH-SY5Y cells exposed to l-Nor. A, caspase-3 is not activated by l-Nor. The cells were treated with 3 mm l-Nor for 24 or 48 h and subjected to immunoblot analysis using caspase 3. PC, positive control of apoptotic cells. B, increased phosphorylation of RIP3 in l-Nor-treated cells. The cells were treated with 3 mm l-Nor for 24 or 48 h and subjected to immunoblot analysis. Phosphorylated and non-phosphorylated forms of RIP3 were resolved by Phos-tag SDS-PAGE (upper panel). Total (phospho- and nonphospho-) RIP3 levels were also examined by conventional SDS-PAGE (middle panel). Actin served as a loading control (lower panel). C, increased levels of phospho-RIP3 in l-Nor-treated cells. Levels of phosphorylated RIP3 relative to total RIP3 are shown. Data are shown as mean ± S.D. from three independent experiments (n = 5). *, p < 0.05 versus 0 h.
The Death of l-Nor-treated SH-SY5Y Cells Can Be Suppressed by Necroptosis Inhibitors
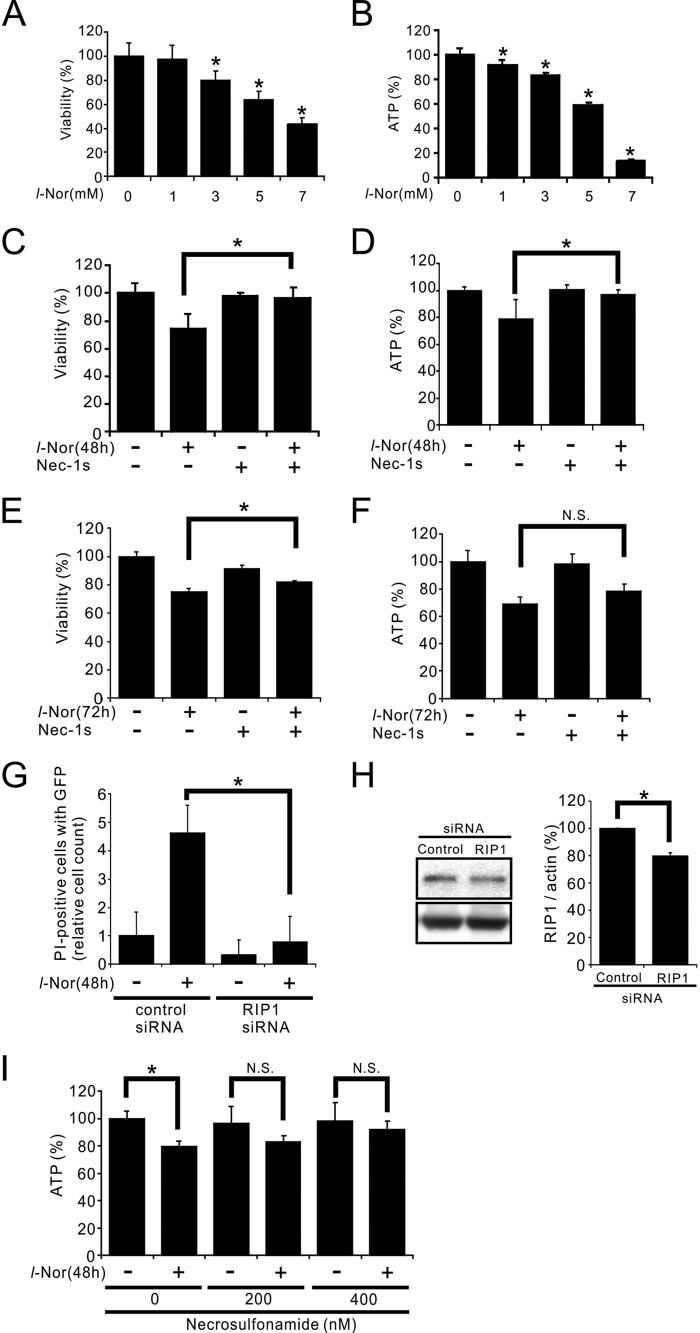
The possible involvement of necroptosis in l-Nor-treated SH-SY5Y cell death was further examined. Both the viabilities and intracellular ATP levels were decreased in the cells treated with or without 1–7 mm l-Nor for 48 h: the decreases were reached by about 20–30% after exposure to 3 mm l-Nor for 48 h compared with control cells (Fig. 6, A and B). These decreases were prevented by pretreating the cells with the RIP1 inhibitor nec-1s prior to l-Nor exposure (Fig. 6, C and D). Nec-1s could significantly suppress the loss of viability, but could not suppress the loss of ATP after 72 h of 3 mm l-Nor treatment (Fig. 6, E and F). This might indicate that nec-1s cannot suppress sustained cell death. To further confirm the requirement for RIP1 in l-Nor-induced cell death, siRNA against RIP1 was transfected into the cells. We transfected the cells with RIP1 siRNA together with the GFP expression vector to select transfection-successful cells. As shown in Fig. 6G, cells that incorporated the RIP1-targeted siRNA were resistant to l-Nor-induced cell death as compared with cells transfected with control siRNA. Immunoblot analysis showed that the siRNA knocked down RIP1, although reduction of the protein by siRNA transfection was relatively small (∼20%) (Fig. 6H) probably due to low transfection efficiency (2–30%). Furthermore, the l-Nor-induced decrease in cellular ATP levels was also suppressed by another necroptosis inhibitor, necrosulfonamide (Fig. 6I). Taken the results shown in Figs. 5 and 6 together, we conclude that l-Nor causes SH-SY5Y cell death through the necroptosis pathway.
FIGURE 6.
SH-SY5Y cell death by l-Nor is suppressed by necroptosis inhibitors. A-F, decreases in cell viabilities (A, C, and E) and intracellular ATP levels (B, D, and F) by l-Nor treatment, and their attenuation by a necroptosis inhibitor, nec-1s. The cells were treated with 0–7 mm l-Nor or nec-1s or both for 48 h (A–D) or 3 mm l-Nor and/or nec-1s for 72 h (E and F). Cell viabilities were determined by a modified MTT assay (A, C, and E). Intracellular ATP levels were determined by luciferase assay (B, D, and F). Data are shown as mean ± S.D. from one experiment (n = 8 for A-D; n = 6 for E and F). Experiments were repeated two (A and B) and three (C and D) times with the same results. *, p < 0.05. N.S., not significant. G, necrotic cell death by l-Nor was attenuated by the RNAi-mediated knockdown of RIP1. The cells were transfected with control or RIP1-targeted siRNA together with a GFP-expression vector to visualize cells successfully transfected. The cells were then incubated with l-Nor (3 mm, 48 h) and stained with propidium iodide (PI). The relative numbers of cells positive for both PI and GFP fluorescences are shown. H, immunoblot analysis of RIP1. Data are shown as mean ± S.D. (n = 3). Essentially the same results were obtained in two independent experiments and a typical result is shown. *, p < 0.05. I, decrease in intracellular ATP levels and its attenuation by an MLKL inhibitor, necrosulfonamide. The cells were treated with the indicated concentrations of necrosulfonamide, followed by exposure to 3 mm l-Nor for 48 h. Intracellular ATP levels were determined by luciferase assay. Data are shown as mean ± S.D. (n = 8). Essentially the same results were obtained in two independent experiments and a typical result is shown. *, p < 0.05. N.S., not significant.
SREBP-2 Suppression Reduces Necroptosis in l-Nor-treated SH-SY5Y Cells
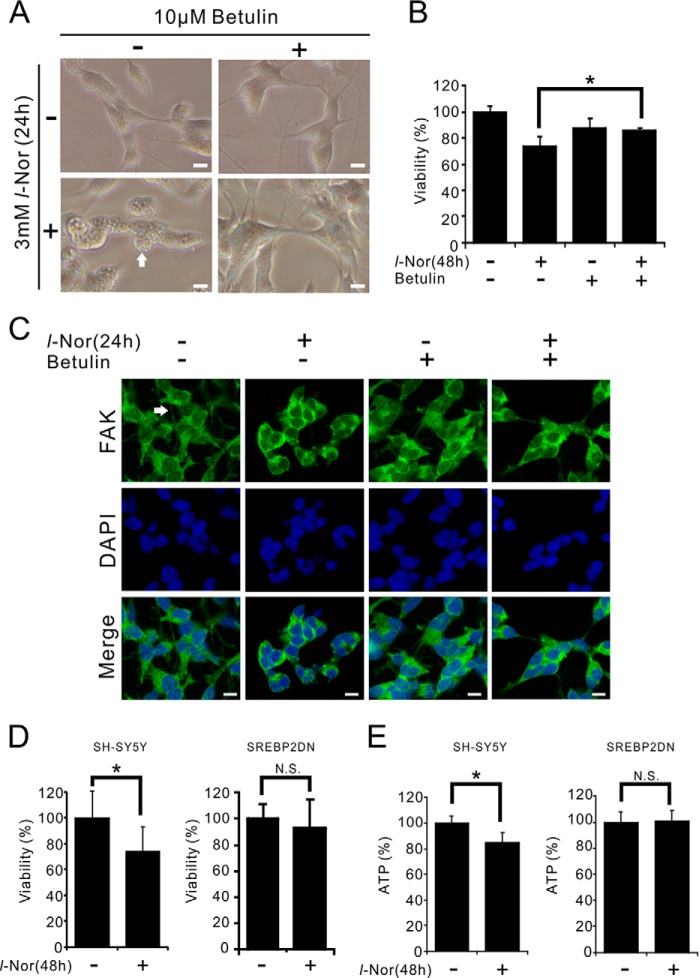
To evaluate the relationship between increased cholesterol uptake/synthesis and the execution of necroptosis in l-Nor-treated cells, the effect of a small molecule inhibitor of SREBP-2, betulin (25), on cell death was examined. In cells administered betulin, none of the typical features of cellular degenerations observed in l-Nor-treated cells, such as cytoplasmic vacuolation and the involution of neurite-like protrusions, were observed (Fig. 7A). The l-Nor-induced loss of viability was also prevented in cells pre-treated with betulin (Fig. 7B). Immunofluorescence analysis using anti-FAK antibody also confirmed that FAK-positive neurite-like protrusions were also retracted by l-Nor and the retraction was cancelled by co-administration of betulin (Fig. 7C). Furthermore, SH-SY5Y cells that stably express the dominant-negative form of SREBP-2 (26) were more resistant to the l-Nor-induced loss of viability and decrease in ATP levels as compared with parental SH-SY5Y cells (Fig. 7, D and E). These results indicate that SREBP-2 activation by l-Nor participates in subsequent cellular degeneration and cell death. Increased cholesterol uptake and biosynthesis appear to be involved in the induction of necroptosis-like cell death in l-Nor-treated cells.
FIGURE 7.
SREBP-2 is involved in necroptosis of l-Nor-treated SH-SY5Y cells. A–C, the SREBP-2 inhibitor betulin suppressed l-Nor-induced vacuolation, neurite retraction, and cell death. The cells were treated with 10 μm betulin or 3 mm l-Nor or both for 24–48 h. Representative phase-contrast images of cells 24 h after treatment (A), and cell viabilities 48 h after treatment (B) are shown. Data are shown as mean ± S.D. from two experiments (n = 5). *, p < 0.05. N.S., not significant. Scale bar, 10 μm. Arrow indicates cytoplasmic vacuoles. C, betulin attenuates the retraction of neurite-like projections caused by l-Nor. The cells were incubated with anti-FAK antibody to visualize neuronal projections and DAPI to stain the nucleus and observed under confocal fluorescence microscopy. Scale bar, 10 μm. Arrow indicates neurite-like projection. D and E, dominant-negative SREBP-2 suppressed l-Nor-induced cell death. SH-SY5Y cells stably expressing dominant-negative SREBP-2 (SREBP2DN) were treated with 3 mm l-Nor for 48 h and examined for viability (D) and intracellular ATP levels (E). Parental SH-SY5Y cells were also used as a control. Data are shown as mean ± S.D. from two experiments (n = 16). *, p < 0.05. N.S., not significant.
Amelioration of Cell Death by a Cholesterol-mobilizing Agent in l-Nor-treated SH-SY5Y Cells
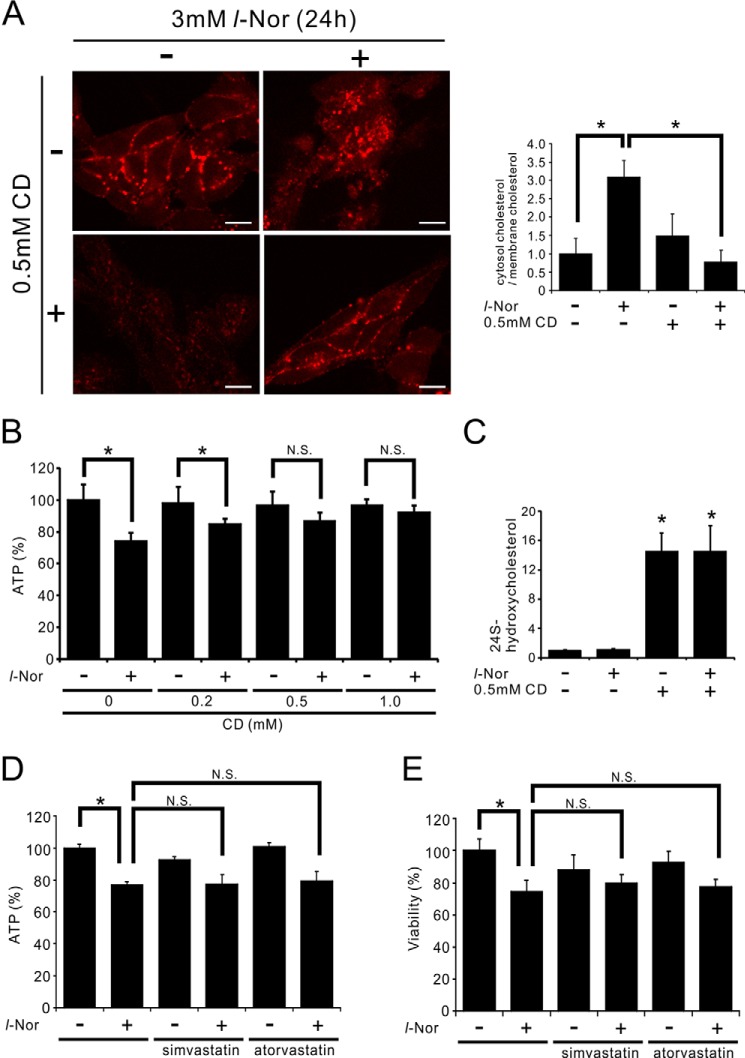
Given the indications of increased cholesterol levels (Figs. 1 and 3), the aberrant cytoplasmic accumulation of free cholesterol (Fig. 3), and necroptosis-like cell death (Fig. 6) in l-Nor-treated cells, the relationship between cellular cholesterol accumulation and cell death was examined. 2-Hydroxypropyl-β-cyclodextrin (CD), which mobilizes cellular cholesterol from intracellular stores to the plasma membrane or extracellular spaces (27, 28), and can ameliorate neurodegeneration in animal models of lysosomal cholesterol storage diseases (29), was used. Because CD reacts with lipophilic drugs as well as with serum components, we examined the effects administering CD to l-Nor-treated cells. We first exposed the cells to l-Nor in serum-containing medium for 24 h, and then incubated the treated cells with CD in serum-free medium. Although 24 h incubation with serum-free medium slightly mobilized cholesterol from plasma membrane to intracellular vesicles (compare Fig. 8A with Fig. 3D), this post-CD treatment of l-Nor-treated cells efficiently mobilized the accumulated free cholesterol to the plasma membrane as shown by filipin staining (Fig. 8A) and confirmed by quantifying cytosolic and membranous filipin fluorescences (Fig. 8A). Furthermore, this post-treatment with CD significantly reduced the l-Nor-induced loss of ATP levels (Fig. 8B), confirming that cellular cholesterol accumulation is involved in cell death by l-Nor exposure. An ELISA of extracellular levels of 24(S)-hydroxycholesterol, the major excretory form of cholesterol in the CNS (28), also confirmed that CD mobilizes cholesterol efficiently from intracellular storage sites into the extracellular milieu (Fig. 8C). Pretreatment of simvastatin or atorvastatin, inhibitors of rate-limiting enzyme of cholesterol synthesis HMG-CoA reductase, scarcely affected the cell death by l-Nor, suggesting that cholesterol biosynthesis might contribute less to cell death than cholesterol uptake (Fig. 8, D and E).
FIGURE 8.
Suppression of l-Nor-induced SH-SY5Y cell death by post-treatment with a cholesterol-mobilizing reagent. A–C, treatment of SH-SY5Y cells with CD (0.5 mm, 24 h) after l-Nor treatment (3 mm, 24 h) depletes intracellularly accumulated free cholesterol and improves cellular ATP levels. The cells were treated with or without l-Nor (3 mm) in serum-containing medium for 24 h, followed by treatment with or without CD in serum-free medium for an additional 24 h. Then, the cells were stained with filipin and observed under fluorescence microscopy (A). A typical result from two independent experiments is shown. Percentages of filipin fluorescences observed in cytosol and plasma membrane are also shown in right panel. Data are shown as mean ± S.D. from two experiments (n = 7). *, p < 0.05. Intracellular levels of ATP (B) and extracellular levels of 24(S)-hydroxycholesterol (C) were also determined (n = 7 for B, n = 5 for C). D and E, simvastatin and atorvastatin scarcely affect l-Nor-induced loss of ATP and viabilities. The cells were treated with 3 mm l-Nor and/or simvastatin or atorvastatin (10 μm) for 48 h. Data are shown as mean ± S.D. (n = 7). Essentially the same results were obtained in two independent experiments and a typical result is shown. *, p < 0.05. N.S., not significant.
The Death of l-Nor-treated Primary Striatal Neurons Can Be Suppressed by Necroptosis Inhibitor
To confirm that the necroptosis-like cell death by l-Nor is observed not only in SH-SY5Y cells but also in post-mitotic neurons, we exposed the primary culture of mouse striatal neurons to l-Nor. Retraction of neurite (Fig. 9A), nuclear translocation of SREBP-2 (Fig. 9B), and cell death, which was inhibited by nec-1s (Fig. 9, C and D), were also observed in striatal neurons after exposure to l-Nor for 48 h.
FIGURE 9.
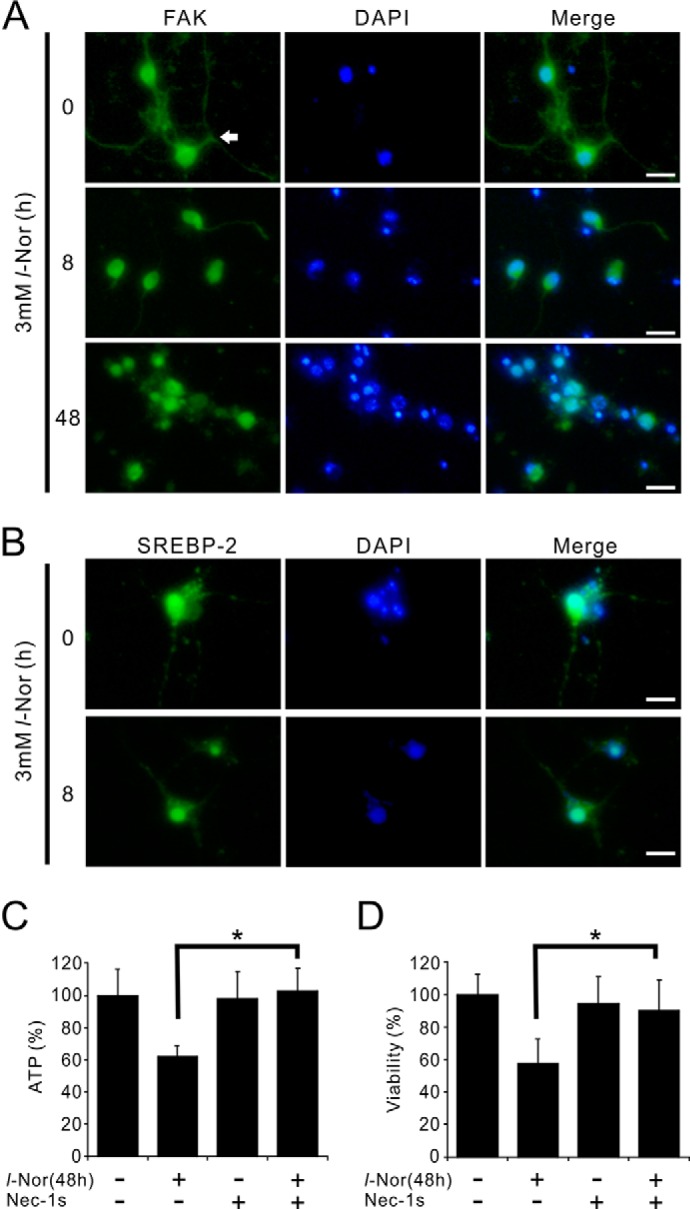
Nec-1s suppresses death of primary mouse striatal neurons caused by l-Nor. A, retraction of neurites of striatal neurons by l-Nor. Primary culture of mouse striatal neurons was treated with l-Nor (3 mm, 8 or 48 h) and the cells were stained with anti-FAK antibody (green) and observed under fluorescence microscopy. Arrow indicates neurite. B, nuclear translocation of SREBP-2 in the striatal neurons by l-Nor. The cells were stained with anti-SREBP-2 antibody (green) and observed under fluorescence microscopy. Nuclei were also stained with DAPI (blue). C, l-Nor-induced loss of ATP and viabilities in striatal neurons and its suppression by nec-1s. The cells were treated with l-Nor (3 mm), nec-1s, or both for 48 h. Intracellular ATP levels (C) and viabilities (D) were determined by luciferase assay. Data are shown as mean ± S.D. (n = 6). Essentially the same results were obtained in two independent experiments and a typical result is shown. *, p < 0.05.
Lysosomal Cholesterol Transport Inhibitor U18666A Mimics the Toxicity of l-Nor on SH-SY5Y Cells
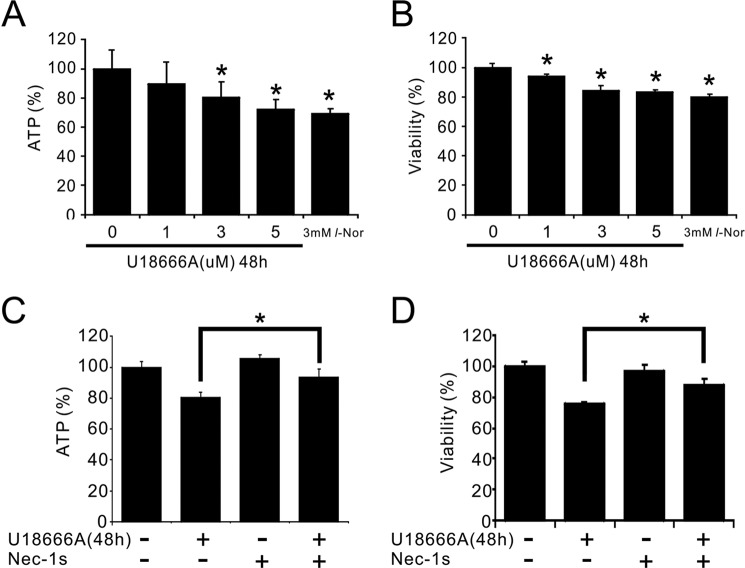
Finally we examined whether lysosomal accumulation of cholesterol is involved in necroptosis or not by use of a lysosomal cholesterol export inhibitor U18666A. We first checked the concentration-cell death relationship on SH-SY5Y cells, and found that ∼5 μm U18666A caused cell death to the extent similar to 3 mm l-Nor (Fig. 10, A and B). The cell death by U18666A could be inhibited by nec-1s, suggesting that U18666A-induced cell death is also necroptotic (Fig. 10, C and D). These results further support that intracellular cholesterol accumulation is one of the causative events leading to necroptosis in SH-SY5Y cells.
FIGURE 10.
Suppression of U18666A-induced cell death by nec-1s. Concentration-dependent decreases in intracellular ATP levels (A) and cell viabilities (B) by U18666A treatment, and their attenuation by the necroptosis inhibitor, nec-1s (C and D). The cells were treated with 1–5 μm U18666A or nec-1s or both for 48 h. Intracellular ATP levels were determined by luciferase assay (A and C). Cell viabilities were determined by a modified MTT assay (B and D). Data are shown as mean ± S.D. from two experiments (n = 13 for A and B; n = 6 for C and D). *, p < 0.05.
Discussion
Here we demonstrate that increased cholesterol uptake as well as biosynthesis leads to the accumulation of free cholesterol in cytoplasmic compartments including lysosomes in l-Nor-treated neuronal SH-SY5Y cells. Cytoplasmic free cholesterol accumulation resulted in the induction of necrosis executed through the machinery of necroptosis, a form of regulated necrosis.
Although its pathophysiological significance has not been determined to date, SREBP-2 activation and increased cholesterol synthesis in cells derived from the CNS or other tissues have been reported during exposure to anti-psychotic drugs such as chlorpromazine, olanzapine, and haloperidol (30–32). Because increased cholesterol synthesis has been observed at micromolar concentrations of these drugs, most authors have concluded that these effects are not mediated through the antagonistic and/or agonistic action of dopamine and/or serotonin receptors (30–32). Rather, it has been postulated that the cationic amphiphilic properties of these phycotropic drugs might be responsible for their lipogenic effects (33). Indeed, it has been shown that the SCAP protein, which is responsible for sensing cellular cholesterol levels and the subsequent proteolytic activation of SREBP-2, is regulated not only by cholesterols, but also by cationic amphiphiles (34). Like chlorpromazine, olanzapine, and haloperidol, l-Nor has the properties of a cationic amphiphile. Another possible explanation is that l-Nor causes ER stress in cells, which has been shown to induce SREBP-2 activation (35). To our knowledge, this is the first report demonstrating that not only antipsychotics but also phychostimulants induce SREBP-mediated lipogenic effects when administered at high concentrations.
Cholesterol is taken up by cells in its esterified form, and the incorporated cholesteryl ester is delivered to the lysosomes, where free cholesterol is liberated after hydrolysis by acid lipase. Then, the free cholesterol is transported to the ER and further distributed into other cellular membranous compartments. Although both the uptake and synthesis of cholesterol increased in response to l-Nor (Figs. 1–3), the accumulation of free cholesterol in lysosomes (Fig. 3) indicates that intracellular cholesterol transport processes are perturbed in l-Nor-treated cells. NPC1, together with NPC2, mediates the egress of cholesterol from lysosome to other membranous structures including the plasma membrane. Very recently, it has been reported that NPC1 is a cellular target of U18666A, a cationic sterol and well known inhibitor of cholesterol exit from lysosomes and/or late endosomes: U18666A binds to the sterol binding domain of NPC1 and blocks cholesterol export from lysosomes (36). Because U18666A also induces necroptosis-like death of SH-SY5Y cells (Fig. 10), l-Nor might cause the accumulation of cholesterol in lysosomes by suppressing NPC1, in addition to its stimulation of cholesterol uptake and synthesis. It has been reported that the accumulation of cholesterol in lysosomes leads to an impairment in autophagic flux due to the loss of lysosomal autophagic degradation (37). Thus, our previous results that l-Nor disrupts autophagic flux by inducing a loss of lysosomal function in SH-SY5Y cells (5) are consistent with the current results. It has also been reported that the accumulation of cholesterol in neuronal cells results in the prevention of lysosomal membrane permeabilization-induced apoptosis (38, 39). Our current results that cholesterol accumulation in lysosomes leads to necrosis (necroptosis) rather than apoptosis are also consistent with these reports.
Excessive cholesterol uptake/synthesis often results in the production of oxysterols, oxidized derivatives of cholesterol that are involved in the regulation of cholesterol homeostasis as well as the mediation of adverse outcomes of impaired cholesterol homeostasis (40). 24(S)-Hydroxycholesterol, which is produced in the CNS and effluxed from the CNS across the blood-brain barrier due to its high hydrophobicity, is believed to be involved not only in the reduction of cholesterol levels in the CNS, but also in the mediation of adverse side effects (41). Interestingly, the induction of necroptosis has been suggested in undifferentiated SH-SY5Y cells after exposure to ∼50 μm 24(S)-hydroxycholesterol (42), indicating the potential relationship between the impairment in cholesterol homeostasis and the induction of necroptosis. The authors have also shown that exogenously added 24(S)-hydroxycholesterol creates intracellular lipid droplets at an early stage due to the esterification of 24(S)-hydroxycholesterol by acyl-CoA:cholesterol acyltransferase 1 (ACAT1) (43). In our current study, the levels of extracellular 24(S)-hydroxycholesterol reached levels of only several ng/ml (∼100 nm) (data not shown), several orders of magnitude lower than the concentrations that induce necroptosis in SH-SY5Y cells (42). In addition, electron microscopic analysis of l-Nor-treated cells (Fig. 4B) revealed that almost all of the cellular vacuoles include electron-dense contents, suggesting that these were not lipid droplets. Thus, the slight secretion of 24(S)-hydroxycholesterol from l-Nor-treated cell cannot account for the subsequent necroptosis-like cell death. However, we believe there may be a possibility that intracellularly accumulated 24(S)-hydroxycholesterol plays a crucial role in the l-Nor-induced necroptosis-like neuronal cell death. Further studies are required to elucidate the precise mechanism responsible for the link between cellular cholesterol accumulation and the necroptosis-like death of neuronal cells.
Experimental Procedures
Materials
SH-SY5Y human neuroblastoma cells were obtained from American Type Culture Collection (ATCC). Primary mouse brain striatum neuronal cells were obtained from Lonza (M-Cp-302, Basel, Switzerland). Antibodies against cleaved caspase3, RIP3, SREBP-2, FAK, and actin were purchased from Cell Signaling Technology, Beverly, MA (number 9662); Abcam, London, UK, (ab56164); Cayman Chemical Ann Arbor, MI (10007663); Cell Signaling Technology (number 13009), and Sigma (A2066). The peroxidase-conjugated secondary antibodies were obtained from Promega (Madison, WI). l-Norephedrine chloride was purchased from Wako Pure Chemical (Osaka, Japan). CD was purchased from Sigma. All other chemicals are available commercially. A vector that expresses LAMP1 fused to monomeric-GFP (LAMP1-mGFP) was a kind gift from Dr. Esteban C. Dell'Angelica (University of California, Los Angeles, CA). Scrambled and RIP1-targeted siRNA were purchased from Santa Cruz Biotechnology (Santa Cruz, CA).
Cell Culture and Differentiation
SH-SY5Y human neuroblastoma cells were grown in medium (1:1 mixture of Ham's F-12 medium and modified Eagle's medium) supplemented with 10% fetal calf serum at 37 °C in a humidified atmosphere of 5% CO2. For the induction of neuronal differentiation, retinoic acid was added to the medium at a concentration of 10 μm and incubation was continued further for 4 days. The differentiation medium was changed every 2 days. Cell lines that stably express dominant-negative SREBP-2 or LAMP1-mGFP were established as follows. SH-SY5Y cells were transfected with CMV500 A-SREBP-2 plasmid (a kind gift from Dr. Charles Vinson (Addgene plasmid number 33358) (26), which expresses the b-HLH-ZIP region of SREBP-2 and interferes with endogenous native SREBP-2 transcriptional activity, or LAMP1-mGFP, and selected for resistance to G418 (500 μg/ml). The successful generation of stable cell lines was confirmed by immunofluorescence analysis using anti-FLAG tag antibody or confirmation of LAMP1-mGFP fluorescence from the cells (data not shown). Mouse brain striatum neurons were maintained according to the manufacturer's instruction (Lonza).
Transmission Electron Microscopy
Differentiated SH-SY5Y cells, treated with or without 3 mm Nor for 4 h, were fixed with 2.5% glutaraldehyde and 0.1% OsO4 and embedded in Epon 812. Ultrathin sections were stained with uranyl acetate and lead citrate and examined under a transmission electron microscopy (H-7100, Hitachi, Hitachinaka, Japan).
DNA Microarray and Real Time-PCR
For DNA microarray analysis, total RNA was isolated from cells using an RNeasy Mini kit (Qiagen). The quality of the total RNA was checked by a Bioanalyzer 2100 (Agilent Technologies). Total RNAs were labeled with Cy3, hybridized to a Human Gene Expression 4 × 44K v2 Microarray kit (Agilent Technologies), and scanned by a G2505B array scanner (Agilent Technologies). The results of the microarray analysis were deposited in the GEO database (accession number GSE67643). For real-time qPCR analysis, total RNA was extracted using TRIzol reagent (Life Technologies), and cDNA was synthesized using oligo(dT)15 and SuperScriptII reverse transcriptase (Life Technologies). qPCR was performed by the SYBR Green method using a GoTaq qPCR master mixture (Promega). Quantitation of mRNA levels was performed by the comparable Cτ (2−ΔΔCτ) method using the StepOnePlus Real-time PCR System (Applied Biosystems). Primers used for qPCR are listed in Table 1.
Immunoblot Analysis
Immunoblotting was carried out as described previously (5). Briefly, adherent cells were collected together with floating cells by centrifugation, and the cell pellets were disrupted by a sonicator in STE buffer (0.32 m sucrose, 10 mm Tris-HCl, pH 7.4, 5 mm EDTA) containing protease inhibitor mixture (Complete, Roche, Mannheim, Germany) and phosphatase inhibitors (2 mm Na3VO4, 10 mm NaF). Protein concentrations were determined by the method of Bradford (44) using Coomassie staining reagent (Pierce). The phosphorylated and unphosphorylated forms of RIP3 were resolved in phos-tag (Wako) containing acrylamide gels. A Western Lightning Chemiluminescence Reagent Plus kit (PerkinElmer Life Sciences, Boston, MA) was used to visualize antigens. The band densities were determined by an image analyzer (CS analyzer; Atto, Tokyo, Japan).
Immunofluorescence Analysis
Cells were treated with 3 mm l-Nor for the indicated time periods, fixed in 4% paraformaldehyde, peameabilized with 0.5% Triton X-100, and incubated with anti-SREBP-2 or anti-FAK antibody. Then, the cells were further incubated with Alexa 549-conjugated secondary antibody and DAPI to visualize SREBP-2 or FAK and nuclei, respectively. To obtain high resolution images of SREBP-2 and FAK localization, a confocal microscopy (C2+, Nikon, Tokyo, Japan) was used.
Measurements of Cell Viabilities and Intracellular ATP Levels
Cell viabilities were measured using a water-soluble derivative of 3-(4,5-di-methylthiazol-2-yl)-2,5-diphenyltetrazolium bromide (MTT) by Cell Counting Kit-8 (Dojindo, Kumamoto, Japan). In brief, cells grown on 96-well plates were washed with Hanks' balanced salt solution, and 10 μl of Cell Counting Kit-8 solutions were added to each well, and the plates were incubated for 30 min at 37 °C. The absorbance at 450 nm was measured using a microplate reader (Beckman Coulter). Intracellular ATP levels were determined by the luciferase assay using a CellTiter-Glo Luminescent Cell Viability Assay kit (Promega). In brief, cells were grown on 96-well plates, the CellTiter-Glo reagent was added to the cells, and the cells were incubated at room temperature for 10 min. Luminescence was measured using a microplate reader (Beckman Coulter).
Measurement of Cholesterol
The amounts of total cellular and free cholesterol were determined by gas chromatography-mass spectrometry (GC-MS) (45, 46). Cells were collected by centrifugation and the cell pellets were re-suspended in 100 μl of ethanol containing 5α-cholestane as the internal standard. Then, 1 ml of hexane/isopropyl alcohol (3:2, v/v) was added, and the organic phase was dried under nitrogen gas. For the analysis of total cholesterol, the cholesteryl esters were saponified by adding 50 μl of 0.5 m KOH in methanol, and incubated for 1 h at 37 °C. Then 50 μl of 1 m HCl, 150 μl of water, and 500 μl of isopropyl alcohol/hexane/acetic acid (40:10:1, v/v/v) was added, and the free cholesterol was extracted in 500 μl of hexane and dried under nitrogen gas. For trimethylsilyl (TMS) derivatization of cholesterols, 50 μl of SylonTM HTP (Sigma) was added to the dried total and free cholesterol preparations, and the samples were incubated for 20 min at 70 °C. The TMS-derivatized samples were analyzed by 6890/5973 GC-MS (Agilent Technologies). In brief, samples were separated on a DB-5MS column (30 m long, 0.25-mm inner diameter, 0.25-μm film thickness, Agilent J&W, with an inlet temperature of 250 °C). (The initial GC oven temperature was set at 240 °C and increased 20 °C/min to 300 °C. The temperature of the detector was 280 °C.) The effluent was extracted by mass spectrometry at m/z = 329 for cholesterol and m/z = 217 for 5α-cholestane. Extracellular levels of 24(S)-hydroxycholesterol were determined using a 24(S)-hydroxycholesterol ELISA kit (Enzo Life Sciences, Farmingdale, NY).
LDL Uptake and Cellular Distribution of Free Cholesterol
Cellular LDL uptake was observed with a LDL Uptake Cell-based Assay Kit (Cayman Chemical). In brief, cells were incubated with human LDL conjugated to DyLight549 fluorescence dye, and examined under fluorescence microscopy. The cellular distribution of free cholesterol was assessed using the antibiotic filipin, which binds specifically to the unesterified free form of cholesterol (47). In brief, cells treated with 3 mm l-Nor for 16 h were fixed with 4% paraformaldehyde, incubated with 50 μg/ml of filipin for 30 min, and observed under fluorescence microscopy.
RNA Interference
siRNAs were transfected together with a GFP expression vector to discriminate transfection-successful and -unsuccessful cells. After transfection using Lipofectamine2000 (Life Technologies), the cells were treated with 3 mm l-Nor for 48 h, stained with propidium iodide, and observed under fluorescent microscopy. The effect of siRNA on cell death was evaluated by calculating the percentage of propidium iodide-positive (necrotic) cells among the GFP-positive (transfection-successful) cells.
Statistical Analysis
Data are expressed as the mean ± S.D. of at least three independent samples. The data were analyzed by the Tukey-Kramer or Dunnet tests. p values < 0.05 were considered to be statistically significant.
Author Contributions
T. F. and M. T. performed the experiments and analyzed the data. Ka. U. assisted in the interpretation of the data, and Ko. U. supervised the work. T. F., T. A., and Ko. U. designed the experiments, and T. F. and T. A. wrote the paper. All authors reviewed the results and approved the final version of the manuscript.
Acknowledgments
We thank Dr. Esteban C. Dell'Angelica (University of California, Los Angeles), Dr. Shawn M. Ferguson (Yale University), and Dr. Charles Vinson (National Institutes of Health) for providing materials.
This work was supported by Japan Society for the Promotion of Science KAKENHI Grant 25860487 (to T. F.) and MEXT KAKENHI Grant 25460862 (to T. A.). The authors declare no conflicts of interest with the contents of this article.
- Nor
- norephedrine
- SREBP-2
- sterol regulatory element-binding protein-2
- RIP
- receptor interacting protein
- MLKL
- mixed lineage kinase domain-like
- Nec-1s
- necrostatin-1s
- ER
- endoplasmic reticulum
- SCAP
- SREBP-cleavage activating protein
- qPCR
- quantitative PCR
- Z
- benzyloxycarbonyl
- CD
- 2-hydroxypropyl-β-cyclodextrin
- MTT
- 3-(4,5-dimethylthiazol-2-yl)-2,5-diphenyltetrazolium bromide.
References
- 1. Pentel P. (1984) Toxicity of over-the-counter stimulants. JAMA 252, 1898–1903 [PubMed] [Google Scholar]
- 2. Bravo E. L. (1988) Phenylpropanolamine and other over-the-counter vasoactive compounds. Hypertension 11, II7–10 [DOI] [PubMed] [Google Scholar]
- 3. Kernan W. N., Viscoli C. M., Brass L. M., Broderick J. P., Brott T., Feldmann E., Morgenstern L. B., Wilterdink J. L., and Horwitz R. I. (2000) Phenylpropanolamine and the risk of hemorrhagic stroke. N. Engl. J. Med. 343, 1826–1832 [DOI] [PubMed] [Google Scholar]
- 4. Yen M., and Ewald M. B. (2012) Toxicity of weight loss agents. J. Med. Toxicol. 8, 145–152 [DOI] [PMC free article] [PubMed] [Google Scholar]
- 5. Funakoshi T., Aki T., Unuma K., and Uemura K. (2013) Lysosome vacuolation disrupts the completion of autophagy during norephedrine exposure in SH-SY5Y human neuroblastoma cells. Brain Res. 1490, 9–22 [DOI] [PubMed] [Google Scholar]
- 6. Dietschy J. M., Turley S. D., and Spady D. K. (1993) Role of liver in the maintenance of cholesterol and low density lipoprotein homeostasis in different animal species, including humans. J. Lipid Res. 34, 1637–1659 [PubMed] [Google Scholar]
- 7. Chang T. Y., Chang C. C., Ohgami N., and Yamauchi Y. (2006) Cholesterol sensing, trafficking, and esterification. Annu. Rev. Cell Dev. Biol. 22, 129–157 [DOI] [PubMed] [Google Scholar]
- 8. Pfrieger F. W. (2003) Cholesterol homeostasis and function in neurons of the central nervous system. Cell Mol. Life Sci. 60, 1158–1171 [DOI] [PMC free article] [PubMed] [Google Scholar]
- 9. Vance J. E., Hayashi H., and Karten B. (2005) Cholesterol homeostasis in neurons and glial cells. Semin. Cell Dev. Biol. 16, 193–212 [DOI] [PubMed] [Google Scholar]
- 10. Di Paolo G., and Kim T. W. (2011) Linking lipids to Alzheimer's disease: cholesterol and beyond. Nat. Rev. Neurosci. 12, 284–296 [DOI] [PMC free article] [PubMed] [Google Scholar]
- 11. Sturley S. L., Patterson M. C., Balch W., and Liscum L. (2004) The pathophysiology and mechanisms of NP-C disease. Biochim. Biophys. Acta 1685, 83–87 [DOI] [PubMed] [Google Scholar]
- 12. Goldstein J. L., DeBose-Boyd R. A., and Brown M. S. (2006) Protein sensors for membrane sterols. Cell 124, 35–46 [DOI] [PubMed] [Google Scholar]
- 13. Radhakrishnan A., Sun L. P., Kwon H. J., Brown M. S., and Goldstein J. L. (2004) Direct binding of cholesterol to the purified membrane region of SCAP: mechanism for a sterol-sensing domain. Mol. Cell 15, 259–268 [DOI] [PubMed] [Google Scholar]
- 14. Yang T., Espenshade P. J., Wright M. E., Yabe D., Gong Y., Aebersold R., Goldstein J. L., and Brown M. S. (2002) Crucial step in cholesterol homeostasis: sterols promote binding of SCAP to INSIG-1, a membrane protein that facilitates retention of SREBPs in ER. Cell 110, 489–500 [DOI] [PubMed] [Google Scholar]
- 15. Brown M. S., and Goldstein J. L. (1997) The SREBP pathway: regulation of cholesterol metabolism by proteolysis of a membrane-bound transcription factor. Cell 89, 331–340 [DOI] [PubMed] [Google Scholar]
- 16. Vandenabeele P., Galluzzi L., Vanden Berghe T., and Kroemer G. (2010) Molecular mechanisms of necroptosis: an ordered cellular explosion. Nat. Rev. Mol. Cell Biol. 11, 700–714 [DOI] [PubMed] [Google Scholar]
- 17. Vercammen D., Beyaert R., Denecker G., Goossens V., Van Loo G., Declercq W., Grooten J., Fiers W., and Vandenabeele P. (1998) Inhibition of caspases increases the sensitivity of L929 cells to necrosis mediated by tumor necrosis factor. J. Exp. Med. 187, 1477–1485 [DOI] [PMC free article] [PubMed] [Google Scholar]
- 18. Cho Y. S., Challa S., Moquin D., Genga R., Ray T. D., Guildford M., and Chan F. K. (2009) Phosphorylation-driven assembly of the RIP1-RIP3 complex regulates programmed necrosis and virus-induced inflammation. Cell 137, 1112–1123 [DOI] [PMC free article] [PubMed] [Google Scholar]
- 19. Sun L., Wang H., Wang Z., He S., Chen S., Liao D., Wang L., Yan J., Liu W., Lei X., and Wang X. (2012) Mixed lineage kinase domain-like protein mediates necrosis signaling downstream of RIP3 kinase. Cell 148, 213–227 [DOI] [PubMed] [Google Scholar]
- 20. Degterev A., Huang Z., Boyce M., Li Y., Jagtap P., Mizushima N., Cuny G. D., Mitchison T. J., Moskowitz M. A., and Yuan J. (2005) Chemical inhibitor of nonapoptotic cell death with therapeutic potential for ischemic brain injury. Nat. Chem. Biol. 1, 112–119 [DOI] [PubMed] [Google Scholar]
- 21. Takahashi N., Duprez L., Grootjans S., Cauwels A., Nerinckx W., DuHadaway J. B., Goossens V., Roelandt R., Van Hauwermeiren F., Libert C., Declercq W., Callewaert N., Prendergast G. C., Degterev A., Yuan J., and Vandenabeele P. (2012) Necrostatin-1 analogues: critical issues on the specificity, activity and in vivo use in experimental disease models. Cell Death Dis. 3, e437. [DOI] [PMC free article] [PubMed] [Google Scholar]
- 22. Zhou W., and Yuan J. (2014) Necroptosis in health and diseases. Semin. Cell Dev. Biol. 35, 14–23 [DOI] [PubMed] [Google Scholar]
- 23. Dwane S., Durack E., and Kiely P. A. (2013) Optimising parameters for the differentiation of SH-SY5Y cells to study cell adhesion and cell migration. BMC Res. Notes 6, 366. [DOI] [PMC free article] [PubMed] [Google Scholar]
- 24. Norman A. W., Demel R. A., de Kruyff B., and van Deenen L. L. (1972) Studies on the biological properties of polyene antibiotics: evidence for the direct interaction of filipin with cholesterol. J. Biol. Chem. 247, 1918–1929 [PubMed] [Google Scholar]
- 25. Kamisuki S., Mao Q., Abu-Elheiga L., Gu Z., Kugimiya A., Kwon Y., Shinohara T., Kawazoe Y., Sato S., Asakura K., Choo H. Y., Sakai J., Wakil S. J., and Uesugi M. (2009) A small molecule that blocks fat synthesis by inhibiting the activation of SREBP. Chem. Biol. 16, 882–892 [DOI] [PubMed] [Google Scholar]
- 26. Rishi V., Gal J., Krylov D., Fridriksson J., Boysen M. S., Mandrup S., and Vinson C. (2004) SREBP-1 dimerization specificity maps to both the helix-loop-helix and leucine zipper domains: use of a dominant negative. J. Biol. Chem. 279, 11863–11874 [DOI] [PubMed] [Google Scholar]
- 27. Peake K. B., and Vance J. E. (2012) Normalization of cholesterol homeostasis by 2-hydroxypropyl-β-cyclodextrin in neurons and glia from Niemann-Pick C1 (NPC1)-deficient mice. J. Biol. Chem. 287, 9290–9298 [DOI] [PMC free article] [PubMed] [Google Scholar]
- 28. Tortelli B., Fujiwara H., Bagel J. H., Zhang J., Sidhu R., Jiang X., Yanjanin N. M., Shankar R. K., Carillo-Carasco N., Heiss J., Ottinger E., Porter F. D., Schaffer J. E., Vite C. H., and Ory D. S. (2014) Cholesterol homeostatic responses provide biomarkers for monitoring treatment for the neurodegenerative disease Niemann-Pick C1 (NPC1). Hum. Mol. Genet. 23, 6022–6033 [DOI] [PMC free article] [PubMed] [Google Scholar]
- 29. Aqul A., Liu B., Ramirez C. M., Pieper A. A., Estill S. J., Burns D. K., Liu B., Repa J. J., Turley S. D., and Dietschy J. M. (2011) Unesterified cholesterol accumulation in late endosomes/lysosomes causes neurodegeneration and is prevented by driving cholesterol export from this compartment. J. Neurosci. 31, 9404–9413 [DOI] [PMC free article] [PubMed] [Google Scholar]
- 30. Fernø J., Raeder M. B., Vik-Mo A. O., Skrede S., Glambek M., Tronstad K. J., Breilid H., Løvlie R., Berge R. K., Stansberg C., and Steen V. M. (2005) Antipsychotic drugs activate SREBP-regulated expression of lipid biosynthetic genes in cultured human glioma cells: a novel mechanism of action? Pharmacogenomics J. 5, 298–304 [DOI] [PubMed] [Google Scholar]
- 31. Fernø J., Skrede S., Vik-Mo A. O., Håvik B., and Steen V. M. (2006) Drug-induced activation of SREBP-controlled lipogenic gene expression in CNS-related cell lines: marked differences between various antipsychotic drugs. BMC Neurosci. 7, 69. [DOI] [PMC free article] [PubMed] [Google Scholar]
- 32. Canfrán-Duque A., Casado M. E., Pastor O., Sánchez-Wandelmer J., de la Peña G., Lerma M., Mariscal P., Bracher F., Lasunción M. A., and Busto R. (2013) Atypical antipsychotics alter cholesterol and fatty acid metabolism in vitro. J. Lipid Res. 54, 310–324 [DOI] [PMC free article] [PubMed] [Google Scholar]
- 33. Vik-Mo A. O., Fernø J., Skrede S., and Steen V. M. (2009) Psychotropic drugs up-regulate the expression of cholesterol transport proteins including ApoE in cultured human CNS- and liver cells. BMC Pharmacol. 9, 10. [DOI] [PMC free article] [PubMed] [Google Scholar]
- 34. Adams C. M., Goldstein J. L., and Brown M. S. (2003) Cholesterol-induced conformational change in SCAP enhanced by Insig proteins and mimicked by cationic amphiphiles. Proc. Natl. Acad. Sci. U.S.A. 100, 10647–10652 [DOI] [PMC free article] [PubMed] [Google Scholar]
- 35. Ye J., Rawson R. B., Komuro R., Chen X., Davé U. P., Prywes R., Brown M. S., and Goldstein J. L. (2000) ER stress induces cleavage of membrane-bound ATF6 by the same proteases that process SREBPs. Mol. Cell 6, 1355–1364 [DOI] [PubMed] [Google Scholar]
- 36. Lu F., Liang Q., Abi-Mosleh L., Das A., De Brabander J. K., Goldstein J. L., and Brown M. S. (2015) Identification of NPC1 as the target of U18666A, an inhibitor of lysosomal cholesterol export and Ebola infection. Elife 4, e12177. [DOI] [PMC free article] [PubMed] [Google Scholar]
- 37. Ordonez M. P., Roberts E. A., Kidwell C. U., Yuan S. H., Plaisted W. C., and Goldstein L. S. (2012) Disruption and therapeutic rescue of autophagy in a human neuronal model of Niemann Pick type C1. Hum. Mol. Genet. 21, 2651–2662 [DOI] [PMC free article] [PubMed] [Google Scholar]
- 38. Appelqvist H., Nilsson C., Garner B., Brown A. J., Kågedal K., and Ollinger K. (2011) Attenuation of the lysosomal death pathway by lysosomal cholesterol accumulation. Am. J. Pathol. 178, 629–639 [DOI] [PMC free article] [PubMed] [Google Scholar]
- 39. Appelqvist H., Sandin L., Björnström K., Saftig P., Garner B., Ollinger K., and Kågedal K. (2012) Sensitivity to lysosome-dependent cell death is directly regulated by lysosomal cholesterol content. PLoS ONE 7, e50262. [DOI] [PMC free article] [PubMed] [Google Scholar]
- 40. Luu W., Sharpe L. J., Capell-Hattam I., Gelissen I. C., and Brown A. J. (2016) Oxysterols: old tale, new twists. Annu. Rev. Pharmacol. Toxicol. 56, 447–467 [DOI] [PubMed] [Google Scholar]
- 41. Russell D. W., Halford R. W., Ramirez D. M., Shah R., and Kotti T. (2009) Cholesterol 24-hydroxylase: an enzyme of cholesterol turnover in the brain. Annu. Rev. Biochem. 78, 1017–1040 [DOI] [PMC free article] [PubMed] [Google Scholar]
- 42. Yamanaka K., Saito Y., Yamamori T., Urano Y., and Noguchi N. (2011) 24(S)-hydroxycholesterol induces neuronal cell death through necroptosis, a form of programmed necrosis. J. Biol. Chem. 286, 24666–24673 [DOI] [PMC free article] [PubMed] [Google Scholar]
- 43. Yamanaka K., Urano Y., Takabe W., Saito Y., and Noguchi N. (2014) Induction of apoptosis and necroptosis by 24(S)-hydroxycholesterol is dependent on activity of acyl-CoA:cholesterol acyltransferase 1. Cell Death Dis. 5, e990. [DOI] [PMC free article] [PubMed] [Google Scholar]
- 44. Bradford M. M. (1976) A rapid and sensitive method for the quantitation of microgram quantities of protein utilizing the principle of protein-dye binding. Anal. Biochem. 72, 248–254 [DOI] [PubMed] [Google Scholar]
- 45. Robinet P., Wang Z., Hazen S. L., and Smith J. D. (2010) A simple and sensitive enzymatic method for cholesterol quantification in macrophages and foam cells. J. Lipid Res. 51, 3364–3369 [DOI] [PMC free article] [PubMed] [Google Scholar]
- 46. Saraiva D., Semedo R., Castilho Mda C., Silva J. M., and Ramos F. (2011) Selection of the derivatization reagent: the case of human blood cholesterol, its precursors and phytosterols GC-MS analyses. J. Chromatogr. B Analyt. Technol. Biomed. Life Sci. 879, 3806–3811 [DOI] [PubMed] [Google Scholar]
- 47. Kruth H. S., and Fry D. L. (1984) Histochemical detection and differentiation of free and esterified cholesterol in swine atherosclerosis using filipin. Exp. Mol. Pathol. 40, 288–294 [DOI] [PubMed] [Google Scholar]


