ABSTRACT
We previously reported the standard values of the amplitude and latency scores in the RAPDx device for evaluating relative afferent pupillary defect (RAPD). Here, we evaluated RAPD in patients with optic nerve disease by using these standard values. Twenty-eight patients with current or previous optic nerve disease were enrolled in this study. Additionally, the data of 84 healthy subjects from our previous report were used as control data. We measured the amplitude and latency scores using RAPDx. We then compared their mean values and the percentages of individuals with standard values within a certain range between the optic nerve disease group and healthy group. Additionally, we evaluated their correlation with visual acuity and the critical flicker fusion frequency in the optic nerve disease group. Both parameters were significantly higher in the optic nerve disease group than in the control group (p < 0.0001). The detection rate of RAPD when using the standard value of amplitude score was 75%. Additionally, both parameters showed a significant correlation with laterality-based differences in visual acuity and critical flicker fusion frequency values in the optic nerve disease group (r = 0.59–0.75, p < 0.001). The amplitude and latency scores determined using RAPDx are useful in evaluating RAPD, particularly the standard value of the amplitude score.
KEYWORDS: Detection rate, optic nerve disease, relative afferent pupillary defect, standard values
Introduction
Relative afferent pupillary defect (RAPD) is caused by laterality of the visual input.1 It can be detected using the swinging flashlight test by presenting a short light stimulus alternately to the right and left eyes.2 Alternatively, it can be quantified using the neutral-density (ND) filter method.3,4
RAPDx (Konan Medical Inc., Irvine, CA, USA) objectively determines the magnitude of RAPD by presenting light stimuli alternately to pairs of eyes with laterality. The parameters of amplitude score and latency score in RAPDx are used to calculate RAPD using log units; the amplitude score is obtained by determining the percentage of constriction of both eyes, whereas the latency score is obtained by determining the latency of both eyes. Many investigators have used the RAPDx to evaluate glaucoma,5–10 amblyopia,11 and optic nerve disease,12 but standard values for detection of RAPD using this device are still not available.
We previously investigated the reproducibility13 of using RAPDx for RAPD and reported the variability of this method. We reported the following as standard values for detection of RAPD using RAPDx, which could easily be used in clinical settings: RAPD is negative when the absolute values of both the amplitude and latency scores are ≤0.2 log units, and RAPD is positive when the absolute values are ≥0.5 log units.14 However, whether these standard values have practical use remains to be determined.
Therefore, in the present study, we tested the usefulness of these standard values in patients with optic nerve disease. We also investigated the relationship between the amplitude and latency scores and the laterality-based differences in visual acuity (logMAR) and critical flicker fusion frequency (CFF) values using subjective tests.
Materials and Methods
Subjects
Twenty-eight patients with current or previous optic nerve disease (optic nerve disease group) were enrolled in this study. The staging and disease type varied among these patients. Additionally, the data of 84 healthy subjects from our previous report14 were used as control data. The data of the entire study population are shown in Table 1. The study was approved by the Institutional Review Board of Kitasato University (approval number: B15-35) and adhered to the Declaration of Helsinki. Written informed consent was obtained from all subjects after they were explained the purpose, risks, possible consequences, and steps of the study.
Table 1.
The Subject Data of the Study Population
| Characteristic | Optic nerve disease group | Healthy group |
|---|---|---|
| Number | 28 | 84 |
| Age (years) | 55 ± 17 | 32 ± 7 |
| (13–80) | (20–53) | |
| Visual acuity of healthy eye (log MAR) | −0.07 ± 0.03 | — |
| (−0.07–0) | ||
| Visual acuity of disease eye (log MAR) | 0.51 ± 0.03 | — |
| (−0.07–2) | ||
| Critical flicker fusion frequency of healthy eye (Hz) | 36 ± 2 | — |
| (31–40) | ||
| Critical flicker fusion frequency of disease eye (Hz) | 23 ± 11 | — |
| (6–39) | ||
| Diagnosis: n | Idiopathic optic neuritis: 14 | |
| Ischemic optic neuropathy: 6 | ||
| Neuromyelitis optica: 4 | ||
| Compressive optic neuropathy: 3 | ||
| Traumatic optic neuropathy: 1 |
Note. Values are shown as mean ± standard deviation (range).
Methods
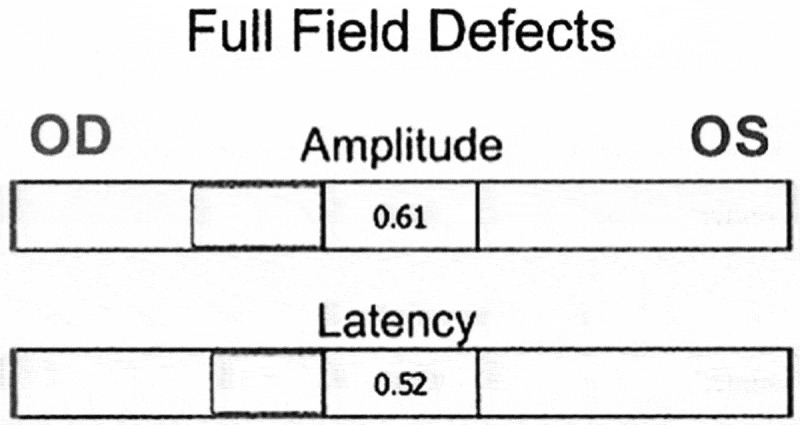
With the RAPDx, the dark-adaptation time, stimulus conditions, and method for calculating the amplitude and latency scores were as reported previously.14 The result of parameters of amplitude score and latency score in RAPDX are shown in Figure 1. To analyse both parameters in the optic nerve disease group, the values were represented as positive for diseased eyes and negative for healthy eyes. In the healthy participants, however, the values were represented as positive for the right eye and negative for the left eye.
Figure 1.

Results of amplitude score and latency score. Amplitude score indicates that there is RAPD of 0.61 log units in the right eye. Latency score indicates that there is RAPD of 0.52 log units in the right eye.
CFF values (red light stimulus) were measured using Handy Flicker (Neitz Instruments Co. Ltd., Tokyo, Japan) as follows: the flickering rate of red light was gradually decreased, and the rate at which the subject considered the light to be flickering rather than continuous was considered the CFF value.
Statistical Analysis
The mean values of the amplitude and latency scores were compared between the optical nerve disease and healthy groups using the Mann-Whitney U test. The percentages of subjects with values ≥ 0.20 (it can be determined that RAPD is not clearly negative) and ≥ 0.50 (it can be determined that RAPD is clearly positive) log units were determined. Moreover, each value of amplitude and latency scores was correlated to the laterality-based differences in visual acuity and CFF values by using Spearman’s rank correlation coefficient in optical nerve disease groups. A value of p < 0.05 was considered statistically significant.
Results
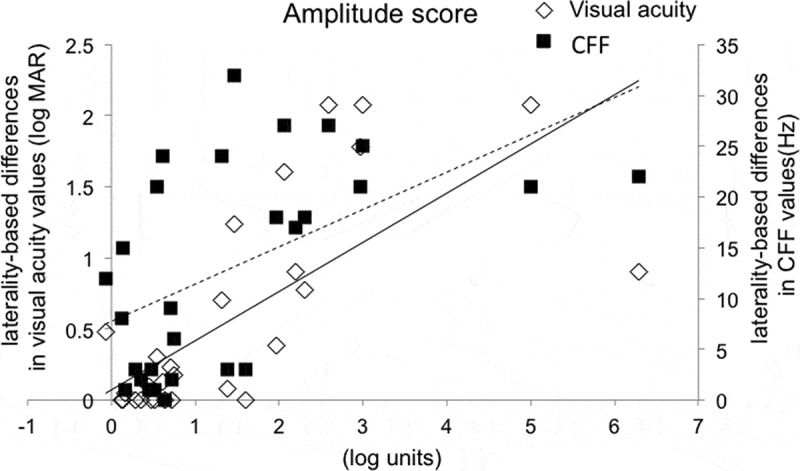
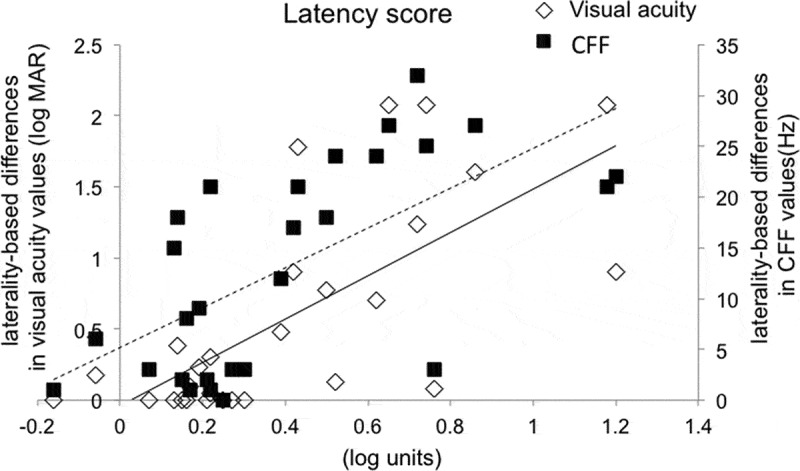
Table 2 shows the mean values of the amplitude and latency scores and the percentages of subjects with values ≥ 0.20 and ≥ 0.50 log units of these scores in the optic nerve disease and healthy groups. The mean values of both parameters were significantly higher in the optic nerve disease group than the control group (p < 0.0001). Additionally, the mean values of the amplitude score were higher than those of the latency score in the optic nerve disease group (p < 0.001). Lastly, Figures 2 and 3 show correlation with age and each parameter (e.g., the laterality-based differences in visual acuity or CFF values, respectively. Both parameters were significantly correlated with the laterality-based differences in visual acuity and CFF values in the optic nerve disease group (r = 0.59–0.75, p < 0.001) (Figures 2 and 3).
Table 2.
Mean Values of Amplitude and Latency Scores and Percentages of Subjects with Values ≥ 0.20 and ≥ 0.50 Log Units in Optic Nerve Disease Group and Healthy Group
| Score/percentage | Optic nerve disease group | Healthy group | p value* |
|---|---|---|---|
| Amplitude score (log units) | 1.45 ± 1.50 | 0.02 ± 0.17 | < 0.0001 |
| (−0.07–6.29) | (−0.07–6.29) | ||
| Percentages of subjects with values ≥0.20 and ≥0.50 log units (%) | 75 and 86 | 2 and 16 | — |
| Latency score (log units) | 0.40 ± 0.34 | −0.02 ± 0.14 | < 0.0001 |
| (−0.16–1.20) | (−0.36–0.52) | ||
| Percentages of subjects with values ≥0.20 and ≥0.50 log units (%) | 36 and 68 | 1 and 12 | — |
| p value** | 0.0009 | 0.06 | — |
Note. Values are shown as mean ± standard deviation (range).
*p value: optic nerve disease group versus healthy group.
**p value: amplitude score versus latency score.
Figure 2.

Correlations of the amplitude score to laterality-based differences in visual acuity and CFF values. p value was < 0.0001 and correlation coefficient was 0.75 with visual acuity. p value was 0.001 and correlation coefficient was 0.59 with CFF. Solid line: visual acuity; Dotted line: CFF. CFF = critical flicker fusion frequency.
Figure 3.

Correlations of the latency score to laterality-based differences in visual acuity and CFF values. p value was <0.0001 and correlation coefficient was 0.70 with visual acuity. p value was <0.0002 and correlation coefficient was 0.65 with CFF. Solid line: visual acuity; Dotted line: CFF. CFF = critical flicker fusion frequency.
Discussion
We previously reported the standard values13 of the amplitude and latency scores, the two parameters used in RAPDx to evaluate RAPD. In the present study, we tested the usefulness of these standard values for patients with optic nerve disease. Among patients with optic nerve disease, the percentages of subjects with amplitude and latency scores ≥ 0.50 log units were 75% and 36%, respectively. In contrast, the percentages of subjects with amplitude and latency scores ≥ 0.20 log units were 86% and 68%, respectively. According to previous reports, RAPD by using ND filter occurs in 90% or more of patients with optic nerve disease,15 although Kawasaki et al. reported that RAPD can also be detected in healthy subjects.4 These findings explain the percentages of subjects in the optic nerve disease group who had ≥ 0.20 and ≥ 0.50 log units of the amplitude score in the present study. The ND filter method and amplitude score of RAPDx are similar in terms of analysing the constriction motion. Therefore, our standard value of the amplitude score enabled detection of RAPD. The latency score, however, had detection sensitivity lower than that of the amplitude score. The value of the latency score was previously found to be the same as that of the amplitude score in healthy subjects,13,14 but in the case of patients with optic nerve disease, the value of latency score was smaller than that of the amplitude score. In other words, in terms of the latency score, some patients with optic nerve disease had RAPD equivalent to that in healthy subjects.
Despite the abovementioned differences, both parameters showed significant correlation with the laterality-based differences in visual acuity and CFF values. According to previous reports, in patients with optic nerve disease, the parameters of RAPD examined using the ND filter method showed a significant correlation with the laterality-based differences in visual acuity and CFF.16–18 Additionally, Takizawa et al.11 reported results similar to ours using RAPDx. Thus, the amplitude and latency scores in RAPDx enable functional evaluation of visual input, and this device is a useful objective tool. Further, our results also corresponded with those obtained using the conventional quantitative ND filter method. Future studies should investigate disease severity, stage, and type with a greater sample size and involve follow-up measurements of the amplitude and latency scores during treatment of patients with optic nerve disease.
Declaration of interest
The authors report no conflicts of interest. The authors alone are responsible for the content and writing of the paper.
References
- [1].Levatin P. Pupillary escape in disease of the retina or optic nerve. Arch Ophthalmol 1959;62:768–779. [DOI] [PubMed] [Google Scholar]
- [2].Thompson HS, Corbett JJ, Cox TA.. How to measure the relative afferent pupillary defect. Surv Ophthalmol 1981;26:39–42. [DOI] [PubMed] [Google Scholar]
- [3].Kawasaki A, Moore P, Kardon RH.. Variability of the relative afferent pupillary defect. Am J Ophthalmol 1995;120:622–633. [DOI] [PubMed] [Google Scholar]
- [4].Kawasaki A, Moore P, Kardon RH.. Long-term fluctuation of relative afferent pupillary defect in subjects with normal visual function. Am J Ophthalmol 1996;122:875–882. [DOI] [PubMed] [Google Scholar]
- [5].Chang DS, Arora KS, Boland MV, Supakontanasan W, Friedman DS.. Development and validation of an associative model for the detection of glaucoma using pupillography. Am J Ophthalmol 2013;156:1285–1296. [DOI] [PMC free article] [PubMed] [Google Scholar]
- [6].Ozeki N, Yuki K, Shiba D, Tsubota K.. Pupillographic evaluation of relative afferent pupillary defect in glaucoma patients. Br J Ophthalmol 2013;97:1583–1542. [DOI] [PubMed] [Google Scholar]
- [7].Chang DS, Boland MV, Arora KS, Supakontanasan W, Chen BB, Friedman DS.. Symmetry of the pupillary light reflex and its relationship to retinal nerve fiber layer thickness and visual field defect. Invest Ophthalmol Vis Sci 2013;54:5596–5601. [DOI] [PMC free article] [PubMed] [Google Scholar]
- [8].Tatham AJ, Meira-Freitas D, Weinreb RN, Marvasti AH, Zangwill LM, Medeiros FA.. Estimation of retinal ganglion cell loss in glaucomatous eyes with a relative afferent pupillary defect. Invest Ophthalmol Vis Sci 2014;55:513–522. [DOI] [PMC free article] [PubMed] [Google Scholar]
- [9].Tatham AJ, Meira-Freitas D, Weinreb RN, Zangwill LM, Medeiros FA.. Detecting glaucoma using automated pupillography. Ophthalmology 2014;121:1185–1193. [DOI] [PMC free article] [PubMed] [Google Scholar]
- [10].Waisbourd M, Lee B, Ali MH, Lu L, Martinez P, Faria B, Williams A, Moster MR, Katz LJ, Spaeth GL.. Detection of asymmetric glaucomatous damage using automated pupillography, the swinging flashlight method and the magnified-assisted swinging flashlight method. Eye (Lond) 2015;29:1321–1328. [DOI] [PMC free article] [PubMed] [Google Scholar]
- [11].Takizawa G, Miki A, Maeda F, Goto K, Araki S, Ieki Y, Kiryu J, Yaoeda K.. Association between a relative afferent pupillary defect using pupillography and inner retinal atrophy in optic nerve disease. Clin Ophthalmol 2015;9:1895–1903. [DOI] [PMC free article] [PubMed] [Google Scholar]
- [12].Law CL, Siu M, Modica P, Backus B.. Stimulus characteristics affect assessment of pupil defects in amblyopia. Optom Vis Sci 2015;92:551–558. [DOI] [PubMed] [Google Scholar]
- [13].Sato T, Goseki T, Asakawa K, Ishikawa H, Shimizu K.. Effects of dark adaptation time on measurement values and its reproducibility using RAPDx® device in Healthy subjects [in Japanese]. Neuro-Ophthalmol Jpn 2015;32:263–268. [Google Scholar]
- [14].Satou T, Goseki T, Asakawa K, Ishikawa H, Shimizu K.. Effects of age and sex on values obtained by RAPDx® pupillometer, and determined the standard values for detecting relative afferent pupillary defect. Transl Vis Sci Technol; In press. [DOI] [PMC free article] [PubMed] [Google Scholar]
- [15].Cox TA, Thompson HS, Corbett JJ.. Relative afferent pupillary defects in optic neuritis. Am J Ophthalmol 1981;92:685–690. [DOI] [PubMed] [Google Scholar]
- [16].Thompson HS, Montague P, Cox TA, Corbett JJ.. The relationship between visual acuity, pupillary defect, and visual field loss. Am J Ophthalmol 1982;93:681–688. [DOI] [PubMed] [Google Scholar]
- [17].Wilhelm H, Meilinger S, Apfelstedt E.. Relation between relative afferent pupillary defect and suprathreshold automated perimetry. Klin Monbl Augenheilkd 1997;210:365–369. [DOI] [PubMed] [Google Scholar]
- [18].Ogasawara K, Takahashi Y, Odashima S.. Re-evaluation of swinging flashlight test in measuring relative afferent pupillary defect [in Japanese]. Jpn J Clin Ophthalmol 1985;39:745–750. [Google Scholar]


