

Abstract
Objective
Gut microbiota may promote positive energy balance; however, germfree mice can be either resistant or susceptible to diet-induced obesity (DIO) depending on the type of dietary intervention. We here sought to identify the dietary constituents that determine the susceptibility to body fat accretion in germfree (GF) mice.
Methods
GF and specific pathogen free (SPF) male C57BL/6N mice were fed high-fat diets either based on lard or palm oil for 4 wks. Mice were metabolically characterized at the end of the feeding trial. FT-ICR-MS and UPLC-TOF-MS were used for cecal as well as hepatic metabolite profiling and cecal bile acids quantification, respectively. Hepatic gene expression was examined by qRT-PCR and cecal gut microbiota of SPF mice was analyzed by high-throughput 16S rRNA gene sequencing.
Results
GF mice, but not SPF mice, were completely DIO resistant when fed a cholesterol-rich lard-based high-fat diet, whereas on a cholesterol-free palm oil-based high-fat diet, DIO was independent of gut microbiota. In GF lard-fed mice, DIO resistance was conveyed by increased energy expenditure, preferential carbohydrate oxidation, and increased fecal fat and energy excretion. Cecal metabolite profiling revealed a shift in bile acid and steroid metabolites in these lean mice, with a significant rise in 17β-estradiol, which is known to stimulate energy expenditure and interfere with bile acid metabolism. Decreased cecal bile acid levels were associated with decreased hepatic expression of genes involved in bile acid synthesis. These metabolic adaptations were largely attenuated in GF mice fed the palm-oil based high-fat diet. We propose that an interaction of gut microbiota and cholesterol metabolism is essential for fat accretion in normal SPF mice fed cholesterol-rich lard as the main dietary fat source. This is supported by a positive correlation between bile acid levels and specific bacteria of the order Clostridiales (phylum Firmicutes) as a characteristic feature of normal SPF mice fed lard.
Conclusions
In conclusion, our study identified dietary cholesterol as a candidate ingredient affecting the crosstalk between gut microbiota and host metabolism.
Keywords: Germfree, Energy balance, Diet-induced obesity resistance, High-fat diet
Abbreviations: Abcg5, ATP-binding cassette sub-family G member 5; Abcg8, ATP-binding cassette sub-family G member 8; Actb, beta actin; Akr1d1, aldo-keto-reductase family member 1; ANOVA, analysis of variance; BMR, basal metabolic rate; CD, control diet; CA, cholic acid; CDCA, chenodeoxycholic acid; CIDEA, cell death inducing DFFA-like effector; COX4, cytochrome c oxidase subunit 4; Cyp7a1, cholesterol 7 alpha-hydroxylase; Cyp27a1, cholesterol 27 alpha-hydroxylase; DCA, deoxycholic acid; Dhcr7, 7-dehydrocholesterol reductase; DIO, diet-induced obesity; DEE, daily energy expenditure; Eef2, eukaryotic elongation factor 2; FT-ICR-MS, Fourier transform-Ion Cyclotron Resonance-Mass Spectrometry; FT-IR, Fourier transform-infrared spectroscopy; GF, germfree; GUSB, beta-glucuronidase; HDCA, hyodeoxycholic acid; Hmgcr, 3-hydroxy-3-methylglutaryl Coenzyme A reductase; Hmgcs, 3-hydroxy-3-methylglutaryl Coenzyme A synthase 1; HP, heat production; Hprt1, hypoxanthine guanine phosphoribosyl transferase; Hsd11b1, hydroxysteroid (11-β) dehydrogenase 1; Hsp90, heat shock protein 90; Ldlr, low density lipoprotein receptor; LHFD, high-fat diet based on lard; MCA, muricholic acid; Nr1h2, nuclear receptor subfamily 1, group H, member 2 (liver X receptor β); Nr1h3, nuclear receptor subfamily 1, group H, member 3 (liver X receptor α); Nr1h4, nuclear receptor subfamily 1, group H, member 4 (farnesoid X receptor α); PHFD, high-fat diet based on palm oil; PRDM16, PR domain containing 16; qPCR, quantitative real-time polymerase chain reaction; SPF, specific pathogen free; Srebf1, sterol regulatory element binding transcription factor 1; TCA, taurocholic acid; Tf2b, transcription factor II B; TMCA, Tauromuricholic acid; UCP1, uncoupling protein 1; UDCA, ursodeoxycholic acid; UPLC-TOF-MS, ultraperformance liquid chromatography-time of flight-mass spectrometry
Highlights
-
•
Cholesterol-based but not plant sterol-based high-fat diet protects germfree (GF) mice from diet-induced obesity (DIO).
-
•
DIO resistant GF mice show preferential carbohydrate oxidation, higher energy expenditure and energy and fat excretion.
-
•
DIO resistance in GF mice is accompanied by increased steroid hormone levels but decreased bile acid levels in the cecum.
-
•
Substrate oxidation and fat excretion in DIO resistant GF mice is linked to decreased hepatic Cyp7a1 and Nr1h4 expression.
1. Introduction
Obesity and associated comorbidities are major health problems in all Westernized societies. Although obesity is the expression of an imbalance between energy intake and energy expenditure, it has been known for decades that the gut microbial ecosystem, positioned at the interface between diet and host energy metabolism, can affect energy balance [1], [2]. Recent studies revealed that changes in gut colonization in response to diet result in altered energy balance and contribute to obesity and metabolic disorders, such as diabetes. The need to better define the molecular mechanisms governed by diet–microbiota–host interactions has been addressed [3], [4], [5], [6], [7], [8], [9], [10], [11], [12], in particular since studies on energy balance in germfree (GF) mice revealed conflicting results [13], [14]. Controversial findings may have their origin in the obesogenic diets used. ‘Western diets’, high-sucrose or high-fat diets, and the respective control diets all vary in caloric density, texture, amount and composition of macronutrients and micronutrients, and, quite frequently, their composition is not sufficiently documented. In fact, the initial description that GF mice are resistant to diet-induced obesity [13] turned out to be strongly dependent on diet composition [14] but the dietary constituents responsible for this differential response have not been identified. Among many other variables diets utilized in these studies differed in fat sources, which affected the responses of host energy balance and microbial composition in conventional mice with a pronounced effect of saturated fat. Compared to olive or safflower oil, palm oil induced body mass gain, lowered microbial diversity, and increased Firmicutes to Bacteroidetes ratio [15]. Additionally, lard rather than fish oil aggravated white adipose tissue inflammation and promoted a higher degree of obesity, which was partly attributed to distinct microbiota composition [16]. In a subsequent study, dietary lipid composition using lard or fish oil also affected gut microbiota-induced regulation of hepatic cholesterol metabolism [17]. These results emphasize the notion that the interaction between gut microbiota and diet composition, and not the gut microbiota per se, merits further investigation to determine the proximate mechanisms affecting host metabolism with respect to obesity development.
Microbial communities are related to changes in gut morphology, physiology, and biochemistry [18]. Microbes ferment polysaccharides and proteins, produce vitamins, and metabolize bile acids, thereby affecting enterohepatic circulation and nutrient absorption [19], [20]. However, the implication of gut microbiota on host energy homeostasis remains elusive [3], [21], partly due to inappropriate analysis of energy expenditure data and spurious data interpretation. In obesity studies, normalization of energy expenditure for variation in body size and composition requires proper statistical methods, since lean mass is metabolically more active than fat mass, and simple body mass-specific ratios do not account for such differences [22], [23], [24]. Hence, the influence of diet and host microbiome on energy balance must be analyzed carefully.
In the present study, we assessed the impact of dietary fat source and the gut microbiota on diet-induced obesity (DIO) by performing comprehensive phenotyping of the host combined with metabolite profiling. This was achieved by feeding GF and specific pathogen free (SPF) male C57BL/6N mice high-fat diets either based on lard (LHFD) or palm oil (PHFD). Analyses included mouse energy expenditure, fecal fat and energy excretion, cecal bacterial diversity and composition, as well as gene expression pathways and metabolite profiling with particular focus on gut and hepatic bile acid and steroid metabolism. Hence, by using state-of-the-art molecular and physiological methods, the present work brings light to an ambiguous array of literature data on the interaction of diet and gut microbiota in mouse models of DIO. Our work assessed host energy balance in response to different dietary fat sources, in combination with metabolite profiling, qPCR, and high-throughput sequencing approaches, providing novel insights into the physiological relevance of gut microbiota and cholesterol-derived metabolites interactions.
2. Materials and methods
2.1. Animals
Studies were performed in SPF and GF male C57BL/6N mice housed at 22 ± 1 °C and 50–60% relative humidity with a 12 h light–dark cycle. Food and water were provided ad-libitum. SPF mice were kept in individually ventilated cages, and GF mice were housed in open cages within flexible film isolators ventilated via HEPA-filtered air. At 8 wks of age, mice were adapted for 4 wks to a purified control diet (CD; 5 wt% soybean oil corresponding to 12 kcal% fat; Ssniff, Soest, Germany). At 12 wks of age, mice were switched from CD to a high-fat diet (48 kcal% fat) based on palm oil (PHFD) or lard (LHFD) or they were maintained on CD for further 4 wks (Ssniff, Soest, Germany) (Table 1, Table S1). The sterol contents of the diets were determined via lipid extraction, saponification, and capillary gas chromatography (Table 2). Body mass was recorded weekly while food intake and feces production of group-housed mice were recorded during the first and the last week of the feeding trial. Body composition was determined at the end of the experiment by quantitative time domain NMR spectroscopy (MiniSpec, Bruker, Billerica, MA, USA). Mice were killed using CO2 in the fed or in the fasted state due to basal metabolic rate recordings. Sterility was confirmed as described in the SI and as shown in Figure S1, respectively. Further details on sampling are explained in SI. Animal experimentation and procedures were approved by the German animal welfare authorities at the district government (approval no. 55.2-1-54-2532-103-2014).
Table 1.
Compositions of the diets used in the present study.
| CD | PHFD | LHFD | |
|---|---|---|---|
| wt% | |||
| Casein | 24.0 | 24.0 | 24.0 |
| Corn starch | 45.9 | 26.7 | 26.7 |
| Sucrose | 5.0 | 5.0 | 5.0 |
| Maltodextrin | 5.6 | 5.6 | 5.6 |
| Soy oil | 5.0 | 5.0 | 5.0 |
| Palm oil | – | 20.0 | – |
| Lard | – | – | 20.0 |
| Cellulose | 5.0 | 5.0 | 5.0 |
| Mineral mixture | 6.0 | 6.0 | 6.0 |
| Vitamin mixture | 1.2 | 1.2 | 1.2 |
| kJ% | |||
| Protein | 23.0 | 18.0 | 18.0 |
| Fat | 12.0 | 48.0 | 48.0 |
| Carbohydrates | 65.0 | 34.0 | 34.0 |
| Energy content [kJ*g−1]a | 15.5 | 22.7 | 22.7 |
Gross calorific value according to bomb calorimetry.
Table 2.
Mean sterol contents of two batchesa of the diets used in the present study.
| CD | PHFD | LHFD | |
|---|---|---|---|
| mg*100g−1 | |||
| Cholesterol | 0.50 ± 0.08 | 0.73 ± 0.22 | 7.07 ± 0.67 |
| Campesterol | 1.02 ± 0.16 | 3.98 ± 0.23 | 1.00 ± 0.12 |
| Stigmasterol | 2.00 ± 0.31 | 3.03 ± 0.21 | 1.22 ± 0.10 |
| Sitosterol | 3.33 ± 0.50 | 11.02 ± 0.58 | 2.95 ± 0.28 |
| Δ5-Avenasterol | 0.19b±0.03 | 0.70 ± 0.05 | 0.30 ± 0.08 |
| Sitostanol | 1.11 ± 0.30 | 0.90 ± 0.12 | 0.69 ± 0.50 |
| 24-Methylene cycloartenol | 0.22 ± 0.02 | 0.30 ± 0.01 | 0.13 ± 0.03 |
| Cycloartenol | n.d.c | 0.61 ± 0.05 | n.d. |
| Campestanol | 0.52 ± 0.10 | 0.22 ± 0.07 | 0.16 ± 0.04 |
| Total sterols | 8.79 ± 0.79 | 21.48 ± 1.05 | 13.53 ± 1.54 |
The batches were analyzed in triplicate.
Δ5-Avenasterol was detectable in only one of the two analyzed batches.
n.d., not detectable.
2.2. Energy expenditure
Indirect calorimetry was based on an open respirometer system (LabMaster System; TSE Systems, Bad Homburg, Germany) and was performed as described previously [25]. In the morning of the third measurement day, basal metabolic rate was determined for 6 h at thermoneutrality (30 ± 0.5 °C). The variation in heat production (HP) (HPadj.,22 °C,ad-lib., HPadj,30 °C,pa) due to individual differences in lean and fat mass was adjusted by ANCOVA. Further details on indirect calorimetry of GF mice and equations used to calculate HP and respiratory exchange ratio (RER) can be found in SI.
2.3. Fecal fat and energy content by Fourier transform-infrared spectroscopy (FT-IR)
Fecal fat and energy content of group-housed mice were determined by diffuse reflexion using a 96-well plate and a Tensor 27 HTS/XT Microplate Reader (Bruker, Billerica, MA, USA). Dry ground fecal samples (10 mg) were measured with a resolution of 4 cm−1 ranging from 600 to 7000 cm−1 within 60 scans. Spectra were analyzed using QuantAnalysis (Bruker, Billerica, MA, USA). Fecal energy and fat content were adjusted according to feces production and energy or fat intake, respectively. Data were represented as cage means.
2.4. Metabolite analysis
2.4.1. Metabolite extraction
Cecal samples were stored on dry ice until extraction. All instruments were flame-scarfed with methanol. Metabolites of cecal contents (10 mg) and liver samples (50 mg) were extracted, and non-targeted metabolomics was performed as described previously [26].
2.4.2. Fourier transform-Ion Cyclotron Resonance-Mass Spectrometry (FT-ICR-MS)
Methanol extracts were analyzed by FT-ICR-MS analysis in the negative ionization mode. Direct infusion was conducted for cecal samples in the manual mode while liver extracts were measured using the Gilson autosampler system with a dilution of 1:5 in methanol (Gilson, Inc., Middleton, WI, USA). Detailed information on instrument parameters is summarized in Table S2.
2.4.3. Ultraperformance liquid chromatography-time of flight-mass spectrometry (UPLC-TOF-MS)
Bile acids in cecal content were quantified in the negative ionization mode using UPLC (Acquity™, Waters, Milford, MA, USA) coupled with TOF-MS (SYNAPT–G1–QTOF-HD mass spectrometer; Waters, Micromass, Manchester, UK). Standard stock solutions of bile acids and three deuterated bile acids were prepared (1 mg*ml−1; 1000 ppm). A mixture of all non-deuterated bile acids each concentrated to 50 ppm was diluted into 4 different concentration ranges to determine a calibration curve (4, 3, 2, 1 and 0.1 ppm; Table S3). Cecal samples were diluted 1:50 with pure methanol to fit all bile acid peak areas inside the established calibration curve. Bile acid solutions and diluted cecal samples were measured in triplicate after being spiked with a deuterated bile acid mixture of d4-deoxycholic acid, d4-cholic acid and d5-taurocholic acid (final concentration of 0.5 ppm; Table S3). Diluted cecal extracts were separated using a reversed-phase column (C8: 1.7 μm, 2.1 × 150 mm, Acquity™ UPLC BEH™, Waters, Milford, MA, USA). Detailed information on instrument parameters can be found in SI.
2.5. Gut microbiota analysis by high-throughput 16S rRNA gene sequencing
Cecal samples were processed and analyzed as described previously [27] and as described in SI.
2.6. RNA isolation and quantitative real-time polymerase chain reaction (qPCR)
Mice were dissected in the fed state. RNA of the lobus sinister lateralis of mouse livers was isolated and qPCR was performed as described previously [25]. Primers (Table S4) were designed with the Primer3 algorithm (SDSC Biology Workbench, San Diego, CA, USA) [28]. Expression levels were normalized to beta-actin (Actb), eukaryotic elongation factor 2 (Eef2), heat shock protein 90 (Hsp90), and hypoxanthine guanine phosphoribosyl transferase (Hprt1).
2.7. Statistical analysis
One-way and two-way analysis of variance (ANOVA) followed by Tukey post-hoc testing were performed to examine statistical significance (p < 0.05). Data for HP as well as fecal energy and fat content were adjusted by ANCOVA using S+ (TIBCO Spotfire, Boston, MA). Box plots indicate the median, the minimum and maximum value. Detailed analysis of metabolite and microbial data are summarized in the SI.
Further information on methods are described in the SI.
3. Results
3.1. Germfree mice fed a lard based high-fat diet are resistant to diet-induced obesity
Germfree (GF) and normal mice from our specific pathogen free (SPF) facility adapted to a defined low fat diet were switched to a lard- or a palm oil-based high-fat diet (Table 1; Table S1). During the first 3 wks of HFD feeding, SPF mice significantly gained body mass, irrespective of the dietary fat source (Figure 1A). In GF mice, however, body mass gain was observed only on a palm oil (PHFD) but not on a lard (LHFD) diet. Hence, LHFD-fed GF mice resembled the lean phenotype of both SPF and GF mice on CD (Figure 1A). This lean phenotype of the LHFD-fed GF mice persisted until the end of the experiment after completion of energy balance measurements in week 4 and could be attributed to a lower fat mass, while lean mass was similar among groups (Figure 1B–D). The reduced fat mass was explained by smaller fat depots (Table S5). Interestingly, GF mice on CD were heavier than SPF mice (Figure 1B), albeit this could not be explained by elevated fat or lean mass (Figure 1C and D) and, therefore, may be due to enlargement of the cecum in GF mice (Table S5).
Figure 1.

Dietary fat from lard precludes the development of diet-induced obesity in GF mice. (A) Body mass gain during the first 3 wks of experimental feeding. **p < 0.01 and ***p < 0.001 for GF LHFD, GF CD, and SPF CD relative to GF PHFD, SPF PHFD, and SPF LHFD. (B) Body mass, (C) fat mass, and (D) lean mass (p = ns) at the end of the feeding trial (4 wks). Different superscript letters indicate significant statistical differences (p < 0.05). SPF CD: n = 10; SPF PHFD: n = 10; SPF LHFD: n = 10; GF CD: n = 8; GF PHFD: n = 11; GF LHFD: n = 11.
3.2. Proximal causes for resistance to diet-induced obesity in germfree mice on lard high-fat diet
In general, food intake, energy intake, and energy assimilation recorded for group-housed mice during the first and the last week of high-fat diet feeding was higher in SPF compared to GF mice (Table S6). Diet-induced obesity in PHFD-fed mice was accompanied by increased energy assimilation in SPF and GF. An even larger increase was observed in SPF mice fed the LHFD. The magnitude of increase, however, may be overestimated due to increased spillage of the LHFD, which could not be completely corrected for by manual collection. Comparing GF mice on LHFD and PHFD diet, both showed increased energy assimilation, but this effect was only statistically significant on PHFD (p < 0.001). In addition to that, the assimilation efficiency was higher due to gut microbiota (p < 0.01) and high-fat diet feeding (p < 0.001). Hence, energy assimilation appears to be one likely mechanism to counteract obesity but does not fully explain the lean phenotype of LHFD-fed GF mice.
Towards the end of the fourth week of HFD feeding, we evaluated daily energy expenditure (DEE), basal metabolic rate (BMR), and metabolic substrate utilization to identify further components of energy balance enabling resistance to diet-induced obesity in LHFD-fed GF mice. GF mice were transferred out of the isolator and single housed in sterile cages used for indirect calorimetry. Daily energy expenditure was affected by microbiota status (p = 0.024) and by diet (p < 0.001). These differences were due to a higher total DEE in PHFD- and LHFD-fed SPF mice compared to GF and increased total DEE in mice on LHFD and PHFD compared to CD (Figure 2A).
Figure 2.

Basal metabolic rate is highest in LHFD-FED GF mice and contributes to increased daily energy expenditure. (A, C) Total and (B, D) predicted heat production of C57BL/6N mice fed ad libitum at ambient temperature (22 °C) (A, B) and fasted at thermoneutrality (30 °C) representing basal metabolism (C, D). Arrows indicate trends in total (A) and predicted (B) daily energy expenditure within dietary groups of GF and SPF mice. Different superscript letters indicate significant statistical differences (p < 0.05). SPF CD: n = 9; SPF PHFD: n = 10; SPF LHFD: n = 10 (A, B)/5 (C, D); GF CD: n = 8; GF PHFD: n = 9; GF LHFD: n = 10 (A, B)/6 (C, D). Data were adjusted according to lean and fat mass over all C57BL/6N mice: HPadj., 22 °C,ad-lib. [mW] = 76.5196 + 7.4048 * fat mass + 24.9719 * lean mass (adjusted r2 = 0.49, p < 0.001). HPadj., 30 °C,pa [mW] = −18.851 + 3.2664 * fat mass + 11.072 * lean mass (adjusted r2 = 0.44, p < 0.001). adj.: adjusted; BMR: basal metabolic rate; DEE: daily energy expenditure; HP: heat production; pa: post-absorptive.
Energy expenditure may simply reflect differences in body mass or body composition caused by the experimental interventions. Therefore, we applied ANCOVA to adjust DEE for variation in lean and fat mass, which provides predicted DEE (Figure 2B, Figure S2). Differences in predicted DEE are independent of alterations in body composition. Only diet significantly affected predicted DEE with higher values in PHFD and LHFD compared to CD (p = 0.0038). Contrasting trends in GF vs. SPF mice towards lower predicted DEE on PHFD (GF: 658 mW vs. SPF: 678 mW) and higher predicted DEE on LHFD (GF: 663 mW vs. SPF: 643 mW) were observed, but the microbiota × diet interaction was not significant (p = 0.1906; Figure 2B). Therefore, we inspected possible differences in energy expenditure by evaluation of BMR as the major component of the daily energy budget, which was measured at rest in the post-absorptive state and thermoneutral ambient temperature.
Regarding BMR, total heat production per mouse was affected by microbiota status (p = 0.0048) and diet (p = 0.0002). Our statistical analysis by two-way ANOVA also revealed a significant microbiota × diet interaction (p = 0.0081). This interaction was due to a higher mean BMR in GF compared to SPF mice on CD and LHFD, but not on PHFD (Figure 2C). Again, ANCOVA was applied to account for different body composition (Figure 2D, Figure S3). On CD and LHFD, predicted BMR was higher in GF compared to SPF mice, whereas the presence or absence of gut microbiota had no effect in mice on PHFD. Most strikingly, predicted BMR was highest in GF mice fed LHFD with a significant increase in comparison to all other groups. Compared to LHFD-fed SPF mice, predicted BMR was 13.1% higher in GF mice on the same diet (SPF: 218 mW vs. GF: 247 mW).
Next, RER was determined to assess whether the GF status and the differential susceptibility to diet-induced obesity were associated with alterations in metabolic substrate utilization. As expected, GF and SPF mice fed CD revealed a distinct day–night rhythm in RER with a rise during the nocturnal activity phase, indicating preferential carbohydrate oxidation, and a decrease during the day towards fat oxidation when mice were mostly at rest (Figure 3A). This distinct diurnal pattern was attenuated in all HFD fed mice, though completely abolished in GF mice fed PHFD. The latter had constantly low RER values, demonstrating their mere preference for fat oxidation throughout the day, whereas GF mice fed LHFD, as well as SPF mice fed LHFD and PHFD still showed a small nocturnal rise in RER (Figure 3A; Figure S4). This was corroborated by BMR measurements where the highest fat oxidation rate was also observed in the GF mice fed PHFD with a mean RER of 0.76 ± 0.02, as compared to 0.81 ± 0.02 on CD (p < 0.001) and 0.80 ± 0.02 on LHFD (p = 0.048). In SPF mice, fat oxidation was highest on LHFD (0.76 ± 0.02) compared to 0.81 ± 0.03 on CD (p = 0.003) and 0.79 ± 0.03 on PHFD (p = ns).
Figure 3.

Lean GF mice are characterized by higher respiratory exchange ratio and energy loss in feces. (A) Respiratory exchange ratio in GF and SPF mice fed CD, PHFD, and LHFD. Left: $ GF PHFD vs. GF LHFD: p < 0.05; right: $ SPF PHFD vs. SPF LHFD: p < 0.05. CD-fed GF mice were different to HFD-fed mice at all time points unless otherwise labeled with ns. Different superscript letters indicate significant statistical differences (p < 0.05). Black bars above the x-axis indicate nocturnal phases. SPF CD: n = 9; SPF PHFD: n = 10; SPF LHFD: n = 10; GF CD: n = 8; GF PHFD: n = 9; GF LHFD: n = 10. Data are shown as means ± sd. (B) Fecal energy and (C) fat excretion in GF and SPF C57BL/6N mice (housed in groups) during the first and the last week of feeding. Data were adjusted for feces production as well as dietary energy or fat intake, respectively. SPF CD: n = 6; SPF PHFD: n = 6; SPF LHFD: n = 6; GF CD: n = 7; GF PHFD: n = 7; GF LHFD: n = 4. Linear regressions used for adjustment including both GF and SPF mice: Fecal energy contentadj. [kJ*g−1] = 13.0443 + 0.0273 * dietary energy intake − 0.8356 * feces production (adjusted r2 = 0.32, p < 0.001). Fecal fat contentadj. [%] = −0.0723 + 0.0261 * dietary fat intake − 0.3704 * feces production (adjusted r2 = 0.52, p < 0.001). ns: not significant.
These findings demonstrate that upon exposure to distinct dietary fat sources, the microbial status determines differential metabolic adaptations. Regarding GF mice fed the two different fat sources, energy metabolism can be discriminated by accelerated BMR (Figure 2D) as well as lower fat oxidation rate in LHFD compared to PHFD (Figure 3A). The latter may be due to impaired dietary fat absorption in the intestine. Although daily fecal energy excretion was similar when regarding the total values (Table S6), we inspected fecal energy and fat content after ANCOVA adjustment for differences in energy intake and feces production (Table S6). We observed a general trend of lower fecal fat content from GF mice (Figure 3C) whereas fecal energy content tended to be higher in GF vs. SPF (Figure 3B). Fecal fat content is given as a percentage of the fecal mass and ranges from 1 to 8% of fecal mass (Figure 3C), thus equivalent to 0.4–3.1 kJ per gram of feces when assuming 39 kJ per gram fat. Fecal energy content ranges from 13 to 16 kJ per gram (Figure 3B). Given these numbers, differences in fecal fat content do not necessarily have to alter fecal energy content if the fecal composition is also largely different. Indeed, the gross fecal composition is largely different between GF and SPF, which has been reported previously [8]. The main difference is obviously contributed by the bacterial mass and mucins to total fecal energy content. We conclude that fatty acids derived from bacterial membranes contribute to the increased fecal fat content in SPF mice and, thus, might be considered a confounding factor in the comparison between SPF and GF mice, whereas other constituents of feces from GF mice most likely compensate for this difference. Therefore, we focused on a direct comparison within GF mice to explain DIO resistance of LHFD- but not PHFD-fed mice. While fecal fat content was similar among SPF groups, fecal fat content of GF mice was decreased in PHFD, which is in accordance with the lower fecal energy content. In LHFD-fed GF mice, fecal fat content was comparable to GF mice fed CD, which was also reflected by fecal energy content. However, comparing GF mice on PHFD and LHFD there was a significant increase in fecal fat content on LHFD (p = 0.05).
Taken together, increased costs for BMR as well as higher energy loss through fecal fat excretion attenuate body fat accumulation in GF mice fed LHFD. In addition, the higher fat excretion demonstrates lower intestinal fat absorption in LHFD, well in line with the observed increase in RER towards decreased fat oxidation in these GF mice.
3.3. Cholesterol-derived metabolites are altered between lean and obese mice
In light of the distinct adaptations in metabolic substrate utilization conveyed by dietary fat source in GF mice, we next examined the cecal metabolome in a non-targeted manner using direct infusion FT-ICR-MS (Table S2). Based on a final dataset containing 2257 annotated mass signals, metabolite profiles differed according to both the microbiota status and the diet, illustrated in PCA score plots (Figure 4A). GF and SPF mice were separated in the first component (t = [1]) and distinct dietary clusters appeared for GF but not SPF mice. PCA scores were similar between lean GF mice on CD and LHFD but were completely different from obese GF mice on PHFD, separating them in the second component (t = [2]). Building a PCA for GF on PHFD and GF on LHFD also showed a clear separation in the first component (t = [1]). By the means of partial least squares discriminant analysis, a model was built between both groups with R2(cum) = 41.9 and Q2(cum) = 0.708, considering Q2(cum) < 0.5. Subsequently, univariate significance was tested for each annotated metabolite. Most metabolites were increased in LHFD- (845 metabolites) compared to PHFD- (380 metabolites) fed GF mice.
Figure 4.

Cholesterol-derived metabolites are altered between lean and obese mice. (A) Metabolite data were visualized by PCA, taking into account annotated mass signals for all SPF and GF mice on CD, LHFD, and PHFD (left) or GF LHFD and PHFD mice alone (right). (B) Output of KEGG metabolic pathway analysis, performed with MetaboAnalyst (top ten) showing the number of metabolites significantly increased in GF mice fed LHFD (red bars) or PHFD (grey bars), but not in SPF counterparts (p < 0.05; Welch's t-test). AA: arachidonic acid; UFA: unsaturated fatty acid. (C) Signal intensity of cecal 17β-estradiol. Different superscript letters indicate significant statistical differences (p < 0.05). (D) Cecal bile acid concentrations in GF and SPF C57BL/6N mice using UPLC-MS. Different superscript letters indicate significant differences within a certain bile acid and among GF or SPF mice, respectively (p < 0.05). # GF vs. SPF: p < 0.05. CA: cholic acid; CDCA: chenodeoxycholic acid; MCA: muricholic acid; DCA: deoxycholic acid; LCA: lithocholic acid; UDCA: ursodeoxycholic acid; HDCA: hyodeoxycholic acid; T: taurine-conjugated species. SPF CD: n = 10; SPF PHFD: n = 10; SPF LHFD: n = 10; GF CD: n = 10; GF PHFD: n = 10; GF LHFD: n = 10.
All annotated metabolites for which signal intensities were significantly altered between GF mice on PHFD and LHFD but not SPF mice were finally mapped into KEGG metabolic pathways using MetaboAnalyst 3.0. Metabolic pathways with the highest assigned number of metabolites (top 10) are illustrated in Figure 4B. Significant differences were found for metabolites involved in the biosynthesis of steroids and steroid hormones, the biosynthesis of primary bile acids, and the metabolism of arachidonic acid and unsaturated fatty acids (Figure 4B). Steroid hormones, steroids, and bile acids originate from cholesterol, the major discriminative constituent of PHFD and LHFD (Table 2). The annotated mass corresponding to 17β-estradiol, a cholesterol derivative reported to be associated with DIO resistance [29], [30], was detected at higher intensities in lean but not in obese GF mice, and no differences were observed in SPF mice (Figure 4C).
Bile acids represent another class of cholesterol-derived metabolites produced by the host. Since increased bile acids levels, as observed here in GF mice fed PHFD (Figure 4B), can convey resistance to diet-induced obesity [31], [32], we performed targeted quantification of bile acids in the cecum to resolve all possible bile acid isomers (Table S3). As expected, SPF mice exhibited complex bile acid profiles when compared with GF mice, including both primary and bacteria-derived secondary bile acids (Figure 4D). Taurocholic acid (TCA) and (α + β) tauromuricholic acid (TMCA), characteristic of GF mice, were detected at higher concentrations in GF mice on PHFD compared to CD and LHFD. The total amount of cecal bile acids was lower in lean than in obese GF and SPF mice, which implies enhanced capacity to absorb fat in DIO mice, corroborated by lower fecal fat excretion (Figure 3B). Moreover, cecal bile acid concentrations nicely correlated with RER levels in GF mice, highlighting altered substrate utilization towards fat oxidation (Figure S5).
3.4. Specific dominant gut bacteria are affected by dietary fat source
The fact that mice fed the LHFD under SPF conditions were obese when compared to GF mice on the same diet implied that bacterial colonization is at least partly responsible for loss of the lean phenotype. This prompted us to investigate whether the presence of specific gut bacteria depended on the type of dietary fat and whether that was associated with the changes observed in bile acids composition. Therefore, we analyzed cecal bacterial communities using high-throughput sequencing of 16S rRNA genes.
Out of 24 cecal samples analyzed, we obtained a total of 857856 quality- and chimera-check sequences (35744 ± 5542 per sample) representing a total of 178 OTUs (153 ± 8 per sample) (Table S7). Alpha-diversity analysis indicated no difference in the richness of molecular species (Figure 5A). However, when considering most dominant species by taking into account evenness via calculation of Shannon effective counts, mice on both HFD were characterized by higher counts of species (Figure 5A). Beta-diversity analysis revealed a significant clustering of samples according to diet; mice fed the two HFDs were most distant from the control group and were also separated from one another (Figure 5B). Both HFD were associated with an increase in the relative sequence abundance of Clostridiales spp. and a decrease in Bacteroidales (Figure 5C).
Figure 5.

Specific dominant gut bacteria are affected by dietary fat source. Metagenomic DNA isolated from fecal samples (n = 24) was used for amplification of the V3/V4 region of 16S rRNA genes and subsequent sequencing using the Illumina technology. Sequences were analyzed using in-house developed pipelines as described in detail in the methods section. (A) Alpha-diversity analysis. (B) Multidimensional scaling showing differences in diversity between samples (beta-diversity) based on general UniFrac distances. (C) Box plots showing relative sequence abundance of taxonomic groups that were significantly different between mice fed the CD or HFD. (D) Phylotype analysis shown as heatmap of OTU abundances which were significantly different between the two HFD. The identity of OTUs was obtained using EzTaxon based on sequences of approximately 380 bp [64]. Best hits are shown with corresponding sequences similarity. (E) Pearson correlation analysis of Acetatifactor sp. against cecal bile acid concentrations.
No significant changes between the two HFDs were observed at any taxonomic levels (phyla to families) (data not shown). Nevertheless, we observed differences in the occurrence of 5 specific molecular species: mice fed the cholesterol-rich LHFD were characterized by the presence of 2 OTUs related to the species Acetatifactor muris as well as one OTU related at the genus level to Eubacterium coprostanoligenes (Figure 5D). Since differences were observed in cecal bile acid concentrations, we looked for associations between the occurrence of OTUs and bile acids (Table S7). Of the 5 OTUs aforementioned that discriminated the two HFDs, OTU-25, which belongs to the genus Acetatifactor, correlated positively with the concentration of both lithocholic acid (LCA) and ursodeoxycholic acid (UDCA) (Figure 5E).
3.5. Altered substrate oxidation and fecal fat excretion in LHFD-fed GF mice is linked to decreased hepatic Cyp7a1 and Nr1h4 expression
Dietary fat source and host phenotype affected cholesterol-derived metabolites indicating changes in cholesterol biosynthesis or its turnover, which was supported by higher cecal cholesterol levels in PHFD-compared to LHFD-fed GF mice (Figure S6). Hence, we analyzed host responses in the liver as the site of cholesterol and bile acid synthesis for changes in gene expression by qPCR (Table S4). Higher expression levels were found for Hmgcs, Hmgcr, Dhcr7, and Ldlr in GF compared to SPF mice, suggesting a reinforced endogenous biosynthesis and sensitivity towards hepatic uptake of cholesterol (Figure 6). We further investigated expression of genes involved in cholesterol metabolism since signal intensity of hepatic cholesterol as well as fasting plasma cholesterol levels were similar among PHFD- and LHFD-fed GF mice (Figure S6, Table S8). Expression of Cyp7a1, a key enzyme for primary bile acid synthesis in the liver, was higher in GF mice fed PHFD than CD or LHFD as well as in SPF counterparts (Figure 6). Interestingly, Nr1h4 expression, which encodes the FXRα protein, was higher in GF mice fed PHFD compared to LHFD. This may indicate a feedback mechanism, as FXRα has been described to repress Cyp7a1 gene expression [33]. Taken together, increased Cyp7a1 and Nr1h4 gene expression levels were detected in PHFD-fed GF mice, which could partly explain higher cecal bile acid concentrations in those mice, suggesting a reinforced intestinal fat uptake leading to obesity while GF mice fed the LHFD are protected.
Figure 6.

Altered substrate oxidation and fecal fat excretion in lean GF mice is linked to decreased CYP7A1 and NR1H4 expression. SPF CD: n = 6; SPF PHFD: n = 5; SPF LHFD: n = 5; GF CD: n = 6; GF PHFD: n = 6; GF LHFD: n = 5. Different superscript letters indicate significant differences between feeding groups of GF mice (p < 0.05). # GF vs. SPF: p < 0.05. Abcg5: ATP-binding cassette sub-family G member 5; Abcg8: ATP-binding cassette sub-family G member 8; Akr1d1: aldo-keto-reductase family member 1; Cyp7a1: cholesterol 7 alpha-hydroxylase; Cyp27a1: cholesterol 27 alpha-hydroxylase; Dhcr7: 7-dehydrocholesterol reductase; Hmgcr: 3-hydroxy-3-methylglutaryl Coenzyme A reductase; Hmgcs: 3-hydroxy-3-methylglutaryl Coenzyme A synthase 1; Hsd11b1: hydroxysteroid (11-β) dehydrogenase 1; Ldlr: low density lipoprotein receptor; Nr1h2: nuclear receptor subfamily 1, group H, member 2 (liver X receptor β); Nr1h3: nuclear receptor subfamily 1, group H, member 3 (liver X receptor α); Nr1h4: nuclear receptor subfamily 1, group H, member 4 (farnesoid X receptor α); Srebf1: sterol regulatory element binding transcription factor 1.
4. Discussion
During the last decade, the impact of gut microbiota on energy metabolism has received considerable attention [20], [34] although inconclusive data on DIO resistance in GF mice have been provided [13], [14]. This may be due to differences in diet compositions and discrete dietary ingredients that could affect microbe–host interactions. We here identified for the first time cholesterol, a regular constituent of animal fats, as a candidate dietary component associated with DIO resistance of GF mice. Moreover, by deep metabolic phenotyping, we deliver novel mechanistic insights into the interplay between the diet and the gut microbiota in energy balance.
DIO resistance of LHFD-fed GF mice is caused by a direct crosstalk between dietary fat-derived ingredients and host metabolism. In SPF mice, gut microbiota alters this crosstalk in a way leading to obesity. Positive energy balance is key to obesity development, but study designs and data analyses published so far fall short in providing energy balance data that convincingly explain DIO resistance or susceptibility in GF mice [3], [21], [35], [36]. Hence, comprehensive metabolic phenotyping as a primary asset of the present study aimed to identify the proximate causes of DIO resistance in LHFD- but not PHFD-fed GF mice. Although LHFD-fed GF mice showed a lower energy intake and energy assimilation than all other HFD-fed groups, differences were just significant compared to SPF counterparts. Thus, lower energy assimilation does not fully explain DIO resistance of LHFD-fed GF mice. Interestingly, assimilation efficiency was increased by gut microbiota and high-fat diet feeding, which is in accordance to previous findings [37], [38].
Accounting for distinct metabolic activities of body fat and fat-free mass, we found that LHFD-fed GF mice dissipated more energy for basal metabolic rate, which is the largest contributor to daily energy expenditure [39], [40]. Increased heat production, however, was not associated with increased bile acid levels. Thermogenic capacity of classical brown adipose tissue, as assessed by UCP1 protein levels, was increased on both high-fat diets in GF and SPF mice, with no significant enhancement in GF mice on LHFD (Figure S7). The browning of inguinal white tissue (Figure S8), as determined by gene expression of brite/beige adipocyte markers, was not altered by microbiota or diet (Figure S8). Notably, CIDEA mRNA levels were significantly downregulated in response to high-fat diet. The lack of effect of microbiota on thermogenic function in brown as well as brite/beige adipocytes is in contrast to recent reports [31], [32]. Thus, we identified elevated heat dissipation as one likely mechanism by which GF mice on LHFD are protected from excess fat accumulation. This mechanism, however, is not related to increased bile acid levels or to brown fat thermogenesis.
As another proximate cause for DIO resistance, we observed impaired intestinal fat absorption in LHFD-fed GF mice as demonstrated by increased fecal fat excretion and a rise in RER towards carbohydrate oxidation at the beginning of the nocturnal phase. We also found a negative correlation between RER and cecal bile acid concentrations, which is in line with other reports [32], [41], [42]. Intestinal fat absorption is facilitated by bile acids [43]. Hence, the lower bile acid levels found in LHFD-compared to PHFD-fed GF mice is one likely cause for reduced intestinal fat absorption. In addition, to incorporate and emulsify the dietary fat into mixed micelles, LHFD-fed animals may have to invest more energy as heat to allow the fat emulsion to be formed which may become rate limiting for fat absorption. The lack of any bacteria might further restrict formation of LHFD-specific metabolites used as energy substrates in the lower small intestine and colon of GF mice.
Taking our analysis one step further, we identified cholesterol as a candidate dietary ingredient in the experimental LHFD that may convey DIO resistance in GF mice. Chemical analysis of the experimental diets revealed a 9-fold higher cholesterol content in LHFD compared to PHFD (Table 2). In other studies observing DIO resistance in GF mice, even greater amounts of dietary cholesterol were provided [8], [13], [14]. Recently, it was reported that GF mice fed high-fat diets based on either lard or fish oil both gained 30% less weight than conventional counterparts [16]. Taking into account that these diets largely differ in fatty acid composition, but both contain cholesterol, is in support of our conclusion that it is the dietary cholesterol protecting GF mice from DIO. Apart from that, we could show that DIO resistance does not occur in the presence of a cholesterol-free high-fat diet and even led to a positive energy balance. Moreover, there is increasing evidence about an interaction of dietary lipids and gut microbiota on endogenous cholesterol metabolism [8], [17], [44]. Guided by these results, we searched for specific differences in cholesterol metabolism in our mouse models. Cecal metabolite profiling based on a non-targeted approach detected differences in steroid and bile acid profiles when PHFD- and LHFD-fed GF mice were compared. Cholesterol is the precursor for the synthesis of bile acids, steroid hormones, and vitamin D [45], [46]. Clearly, the metabolic fate of dietary cholesterol in the gut is largely different in GF compared to SPF mice. The observed increase in cecal steroids in GF mice on LHFD contrasts with higher cecal bile acid concentrations on PHFD. Despite a low dietary cholesterol content of PHFD, cecal cholesterol was increased by PHFD feeding, and that could not be explained by increased hepatic gene expression changes for an increased de novo biosynthesis of cholesterol. Since our plant based PHFD contained large quantities of sterols that compete with the cholesterol handling in the intestine and enterohepatic system [47], their effect on endogenous cholesterol may explain these diet effects.
Concomitant to the elevated cecal bile acid and cholesterol levels, we observed an increased number of cecal unsaturated fatty acids (UFA), respectively docosahexaenoic acid (n-3) and arachidonic acid (n-6), in PHFD-fed GF mice, although their food intake was not increased. In a series of studies, the influence of dietary fatty acid composition on synthesis and excretion of bile acids and cholesterol has been reported [48], [49]. The cecal UFA in our study could not be attributed directly to dietary fatty acid composition (Table S1). It is thus likely that increased levels of UFA derived from hydrolysis of triacylglycerides, phospholipids, and cholesteryl esters contributed to elevated cecal bile acid and cholesterol contents in PHFD-fed GF mice to form mixed micelles, thus facilitating fat uptake and obesity development.
Among the elevated cecal steroids, the increased levels of 17β-estradiol in lean GF mice fed CD or LHFD are of particular interest. Several studies provide evidence for a role of 17β-estradiol in energy balance regulation by reducing body weight, and increasing insulin sensitivity and glucose tolerance [50], [51], [52]. In addition, estrogens stimulate energy expenditure [51], [53], [54], which is in line with the increased basal metabolic rate and 17β-estradiol levels that we observed in lean LHFD-fed GF mice. Interestingly, FXRα has been reported to link bile acid and steroid metabolism [55]. In that matter, several findings suggest a negative correlation between bile acids and sex hormone synthesis (testosterone and estrogen) via FXR α signaling [55]. Thus, concurrent lower cecal bile acid and higher steroid hormone levels in LHFD-fed GF mice may be due to reduced hepatic Nr1h4 gene expression. Overall, we propose that increased levels of 17β-estradiol as a cholesterol derivative can interfere with bile acid metabolism to decrease fat absorption and promote DIO resistance via enhanced energy expenditure in LHFD-fed GF mice.
Low-grade inflammation has frequently been discussed in obesity [56], [57], [58]. This observation together with the increased metabolites related to the arachidonic acid pathway in LHFD-fed GF mice led us to investigate plasma S-amyloid A levels. However, there were no signs of acute inflammation (Figure S9). The increased arachidonic acid levels might represent an alternative route to counteract bile acid accumulation in LHFD-fed GF mice since prostaglandins evolving from arachidonic acid are known to be associated with decreased bile flow and bile acid secretion in perfused rat liver [59].
Obesity development in PHFD-fed GF mice was facilitated by a more efficient fat absorption, as judged from low fecal fat excretion and increased fat oxidation rate. Fat absorption was associated with an elevation of the primary bile acids TCA and TMCA in the gut of these mice. This increase was accompanied with higher expression of the Cyp7a1 gene encoding for the key enzyme in primary bile acid synthesis. However, this observation is unexpected. Elevated bile acids in the gut are known to repress expression of Cyp7a1 in the liver by a FXRα/FGF15/19 mediated mechanism [33], and bile acid dependent activation of FXRα in hepatocytes represses Cyp7a1 gene transcription [60], [61]. Thus, in the GF state other factors modulate the feedback control of Cyp7a1 by FXRα. Moreover, expression of Nr1h4, which encodes FXRα, was increased in liver of PHFD-fed GF mice. This is interesting, since intact FXR signaling in obesity development recently has been described to be dependent on the presence of gut microbiota [10]. In the latter study, mice were challenged with a high-fat diet based on beef tallow containing cholesterol. Our observation of increased hepatic Nr1h4 expression in obese PHFD- but not in lean LHFD-fed GF mice, hints towards another likely crosstalk between dietary ingredients and host metabolism in obesity development.
The striking difference in energy balance found between lean and obese GF mice on either HFD dissolved in the presence of gut microbiota, confirming previous findings demonstrating an altered diet-host crosstalk induced by gut microbiota [20]. A few LHFD-specific bacteria were identified by high-throughput sequencing, which may have contributed to the obese phenotype in LHFD-fed SPF mice. These bacteria included two species without a representative strain in culture but related to the species A. muris, a bacterium originally isolated from the cecum of an obese mouse [62], as well as one OTU related at the genus level to E. coprostanoligenes, a species shown to be able to produce coprostanol from cholesterol [63]. In addition, OTU-25, which belongs to the genus Acetatifactor, positively correlated with the concentration of both lithocholic acid (LCA) and ursodeoxycholic acid (UDCA) pointing at the possible role of bile acid conversion by bacteria in regulating obesity development.
In conclusion, the novel data provided in our present study indicate dietary cholesterol as a candidate dietary ingredient associated with changes of cholesterol-derived metabolite levels, which may alter DIO development in a causative manner. The presence of intestinal microorganisms is essential in regulating these diet-host interactions, and a few specific taxa are of particular interest here. Further mechanistic studies are required to define the role of these and closely related bacteria in DIO development and to assess the functional role of metabolites such as 17β-estradiol in overall energy homeostasis.
Author contributions
R.K., C.H., T.C., and M.K. elaborated the concept of the study; R.K., C.B.-R., C.H., A.W., V.M.M., V.L.S., and B.S. performed the principal investigation; R.K., A.W., I.L., T.C., and M.K. performed formal analyses; K.-H.E, H.D., P.S.-K., D.H., and M.K. provided the laboratory resources; R.K., T.C., and M.K. wrote the original draft of the manuscript; R.K., A.W., V.M.M., B.S., K.-H.E., H.D., P.S.-K., D.H., T.C., and M.K. reviewed and edited the manuscript; R.K., B.S., A.W., and T.C. prepared the figures and tables; T.C. and M.K. directed and supervised the project; Funding was acquired by P.S.-K., D.H., and M.K.
Acknowledgements
We thank Anika Zimmermann (TUM, Germany), Sabine Mocek (TUM, Germany), Philipp Strahsen (TUM, Germany) and Melanie Klein (TUM, Germany) for their excellent technical support.
The study was funded by the Research Graduate Program “Microbes-Host-Interaction” of the ZIEL – Institute for Food and Health, and by the Else-Kröner-Fresenius-Stiftung (EKFS). Raphaela Kübeck, Catalina Bonet-Ripoll, and Valentina Schüppel were fellows of the Research Training Group GRK 1482 funded by the German Research Foundation (DFG, Deutsche Forschungsgemeinschaft). The funders had no role in study design, data collection and analysis, decision to publish, or preparation of the manuscript.
Footnotes
Supplementary data related to this article can be found at http://dx.doi.org/10.1016/j.molmet.2016.10.001.
Conflict of interest
The authors declare no conflict of interest.
Appendix A. Supplementary data
The following are the supplementary data related to this article:
Sterility of germfree mice approved by 16S RDNA PCR. Random cecal samples were analyzed by 16S rDNA PCR to account for sterility of GF mice. Cecal samples of SPF mice were used as positive controls. n = 3 per group and diet. No bands appeared for the GF samples confirming sterility. Bands at 1.5 kb in SPF samples indicate the presence of bacteria.
Figure S2.

Dependency of daily energy expenditure on body composition. Correlation between daily energy expenditure (HP22 °C, ad-lib.) and lean mass (A) or fat mass (B) following 4 wks of feeding CD, PHFD, or LHFD. SPF CD: n = 9; SPF PHFD: n = 10; SPF LHFD: n = 10; GF CD: n = 8; GF PHFD: n = 9; GF LHFD: n = 10. Linear regression of GF or SPF C57BL/6N mice was calculated irrespective of diet and microbiota status due to small sample size. (A) r2 = 0.26, p < 0.001; (B) r2 = 0.14, p < 0.01. There was no further dependency between daily energy expenditure and lean mass (C) or fat mass (D) after adjusting daily energy expenditure for body composition (HPadj.,22 °C, ad-lib.) by ANCOVA. (C) r2 < 0.001, p = ns; (D) r2 < 0.001, p = ns. adj.: adjusted; ad-lib.: ad-libitum; HP: heat production.
Figure S3.

Dependency of basal metabolic rate on body composition. Correlation between basal metabolic rate (HP30 °C, pa) and lean mass (A) or fat mass (B) following 4 wks of feeding CD, PHFD or LHFD. SPF CD: n = 9; SPF PHFD: n = 10; SPF LHFD: n = 5; GF CD: n = 8; GF PHFD: n = 9; GF LHFD: n = 6. Linear regression of GF or SPF C57BL/6N mice was calculated irrespective of diet and microbiota status due to small sample size. (A) r2 = 0.19, p < 0.01; (B) r2 = 0.14, p < 0.01. There was no further dependency between basal metabolic rate and lean mass (C) or fat mass (D) after adjusting basal metabolic rate for body composition (HPadj.,30 °C, pa) by ANCOVA. (C) r2 < 0.001, p = ns; (D) r2 < 0.001, p = ns. adj.: adjusted; HP: heat production; pa: post-absorptive.
Figure S4.

Respiratory exchange ratio of GF mice exposed to PHFD is below that of SPF counterparts and LHFD-FED mice. Comparison of respiratory exchange ratio between GF and SPF mice fed LHFD (p = ns) or PHFD, respectively. $ GF PHFD vs. SPF PHFD: p < 0.05. Black bars above the x-axis indicate nocturnal phases. SPF CD: n = 9; SPF PHFD: n = 10; SPF LHFD: n = 10; GF CD: n = 8; GF PHFD: n = 9; GF LHFD: n = 10. Data are shown as means ± sd.
Figure S5.

Increased cecal bile acid concentration points to an increased fat oxidation in GF mice. Correlation between cecal bile acid concentration and respiratory exchange ratio measured during basal metabolic rate recordings and represented as the mean of fasted animals following 4 wks of feeding CD, PHFD or LHFD. SPF CD: n = 5; SPF PHFD: n = 5; SPF LHFD: n = 5; GF CD: n = 5; GF PHFD: n = 4; GF LHFD: n = 5. Linear regression of GF or SPF C57BL/6N mice was calculated irrespective of the diet. GF: r2 = 0.26, p < 0.05; SPF: r2 = 0.22, p = ns.
Figure S6.

Cecal but not hepatic cholesterol levels are increased in GF mice due to PHFD feeding. (A) Signal intensities of cecal cholesterol measured by ESI-FT-ICR/MS. (B) Signal intensities of hepatic cholesterol measured by ESI-FT-ICR/MS. SPF CD: n = 10 (A)/11 (B); SPF PHFD: n = 10; SPF LHFD: n = 10; GF CD: n = 10; GF PHFD: n = 10; GF LHFD: n = 10. Different superscript letters indicate significant differences (p < 0.05).
Figure S7.
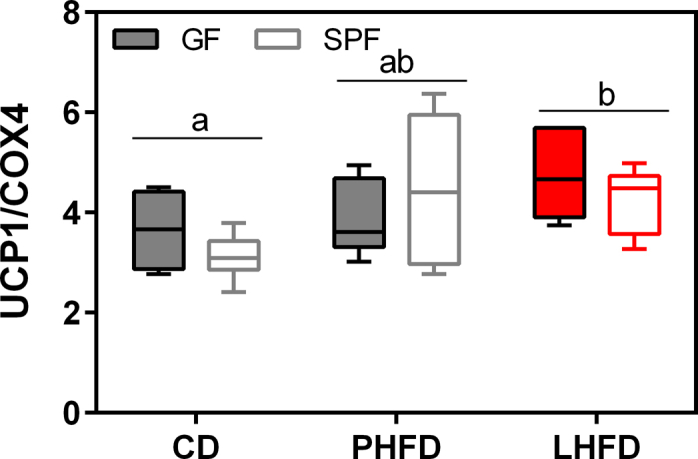
UCP1 protein levels in interscapular brown adipose tissue are altered by diet but not by gut microbiota. SPF CD: n = 7; SPF PHFD: n = 6; SPF LHFD: n = 5; GF CD: n = 6; GF PHFD: n = 6; GF LHFD: n = 6. Heat dissipation of interscapular brown adipose tissue is reflected by uncoupling protein 1 (UCP1) protein levels analyzed in the fasted state of mice. Different superscript letters indicate significant diet effects (p < 0.05).
Figure S8.

Browning of inguinal white adipose tissue does not explain the lean phenotype of LHFD-FED GF mice. (A) Relative gene expression levels of uncoupling protein 1 (Ucp1), (B) cell death inducing DFFA-like effector (Cidea), and (C) PR domain containing 16 (Prdm16). Data were normalized to the mean mRNA concentration of the three reference genes: transcription factor II B (Tf2b), beta-glucuronidase (Gusb), and beta-actin (Actb). SPF CD: n = 6; SPF PHFD: n = 6; SPF LHFD: n = 5; GF CD: n = 6; GF PHFD: n = 6; GF LHFD: n = 6. Gene expression was analyzed in the fasted state of mice. Different superscript letters indicate significant diet effects (p < 0.05).
Figure S9.
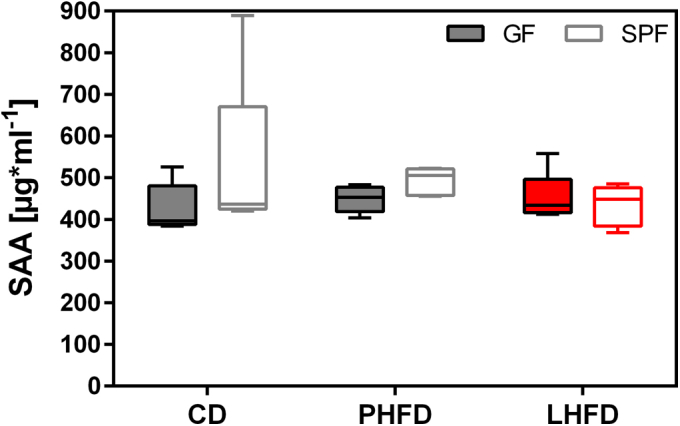
HFD-feeding is not accompanied with acute inflammation. Plasma S-amyloid A levels were measured in the fed state of mice following dissection. SPF CD: n = 5; SPF PHFD: n = 5; SPF LHFD: n = 5; GF CD: n = 5; GF PHFD: n = 5; GF LHFD: n = 7. p = ns.
References
- 1.Wostmann B.S. The germfree animal in nutritional studies. Annual Review of Nutrition. 1981;1:257–279. doi: 10.1146/annurev.nu.01.070181.001353. PubMed PMID: 6764717. [DOI] [PubMed] [Google Scholar]
- 2.Wostmann B.S., Larkin C., Moriarty A., Bruckner-Kardoss E. Dietary intake, energy metabolism, and excretory losses of adult male germfree Wistar rats. Laboratory Animal Science. 1983;33(1):46–50. PubMed PMID: 6834773. [PubMed] [Google Scholar]
- 3.Backhed F., Ding H., Wang T., Hooper L.V., Koh G.Y., Nagy A. The gut microbiota as an environmental factor that regulates fat storage. Proceedings of the National Academy of Sciences of the United States of America. 2004;101(44):15718–15723. doi: 10.1073/pnas.0407076101. PubMed PMID: 15505215; PubMed Central PMCID: PMC524219. [DOI] [PMC free article] [PubMed] [Google Scholar]
- 4.Backhed F., Ley R.E., Sonnenburg J.L., Peterson D.A., Gordon J.I. Host-bacterial mutualism in the human intestine. Science. 2005;307(5717):1915–1920. doi: 10.1126/science.1104816. PubMed PMID: 15790844. [DOI] [PubMed] [Google Scholar]
- 5.Le Roy T., Llopis M., Lepage P., Bruneau A., Rabot S., Bevilacqua C. Intestinal microbiota determines development of non-alcoholic fatty liver disease in mice. Gut. 2013;62(12):1787–1794. doi: 10.1136/gutjnl-2012-303816. PubMed PMID: 23197411. [DOI] [PubMed] [Google Scholar]
- 6.Nieuwdorp M., Gilijamse P.W., Pai N., Kaplan L.M. Role of the microbiome in energy regulation and metabolism. Gastroenterology. 2014;146(6):1525–1533. doi: 10.1053/j.gastro.2014.02.008. PubMed PMID: 24560870. [DOI] [PubMed] [Google Scholar]
- 7.Parks B.W., Nam E., Org E., Kostem E., Norheim F., Hui S.T. Genetic control of obesity and gut microbiota composition in response to high-fat, high-sucrose diet in mice. Cell Metabolism. 2013;17(1):141–152. doi: 10.1016/j.cmet.2012.12.007. PubMed PMID: 23312289; PubMed Central PMCID: PMC3545283. [DOI] [PMC free article] [PubMed] [Google Scholar]
- 8.Rabot S., Membrez M., Bruneau A., Gerard P., Harach T., Moser M. Germ-free C57BL/6J mice are resistant to high-fat-diet-induced insulin resistance and have altered cholesterol metabolism. FASEB Journal: Official Publication of the Federation of American Societies for Experimental Biology. 2010;24(12):4948–4959. doi: 10.1096/fj.10-164921. PubMed PMID: 20724524. [DOI] [PubMed] [Google Scholar]
- 9.Zhang C., Zhang M., Pang X., Zhao Y., Wang L., Zhao L. Structural resilience of the gut microbiota in adult mice under high-fat dietary perturbations. The ISME Journal. 2012;6(10):1848–1857. doi: 10.1038/ismej.2012.27. PubMed PMID: 22495068; PubMed Central PMCID: PMC3446802. [DOI] [PMC free article] [PubMed] [Google Scholar]
- 10.Parseus A., Sommer N., Sommer F., Caesar R., Molinaro A., Stahlman M. Microbiota-induced obesity requires farnesoid X receptor. Gut. 2016 doi: 10.1136/gutjnl-2015-310283. PubMed PMID: 26740296. [DOI] [PMC free article] [PubMed] [Google Scholar]
- 11.Duparc T., Plovier H., Marrachelli V.G., Van Hul M., Essaghir A., Stahlman M. Hepatocyte MyD88 affects bile acids, gut microbiota and metabolome contributing to regulate glucose and lipid metabolism. Gut. 2016 doi: 10.1136/gutjnl-2015-310904. PubMed PMID: 27196572. [DOI] [PMC free article] [PubMed] [Google Scholar]
- 12.Guillemot-Legris O., Mutemberezi V., Cani P.D., Muccioli G.G. Obesity is associated with changes in oxysterol metabolism and levels in mice liver, hypothalamus, adipose tissue and plasma. Scientific Reports. 2016;6:19694. doi: 10.1038/srep19694. PubMed PMID: 26795945; PubMed Central PMCID: PMC4726335. [DOI] [PMC free article] [PubMed] [Google Scholar]
- 13.Backhed F., Manchester J.K., Semenkovich C.F., Gordon J.I. Mechanisms underlying the resistance to diet-induced obesity in germ-free mice. Proceedings of the National Academy of Sciences of the United States of America. 2007;104(3):979–984. doi: 10.1073/pnas.0605374104. PubMed PMID: 17210919; PubMed Central PMCID: PMC1764762. [DOI] [PMC free article] [PubMed] [Google Scholar]
- 14.Fleissner C.K., Huebel N., Abd El-Bary M.M., Loh G., Klaus S., Blaut M. Absence of intestinal microbiota does not protect mice from diet-induced obesity. The British Journal of Nutrition. 2010;104(6):919–929. doi: 10.1017/S0007114510001303. PubMed PMID: 20441670. [DOI] [PubMed] [Google Scholar]
- 15.de Wit N., Derrien M., Bosch-Vermeulen H., Oosterink E., Keshtkar S., Duval C. Saturated fat stimulates obesity and hepatic steatosis and affects gut microbiota composition by an enhanced overflow of dietary fat to the distal intestine. American Journal of Physiology Gastrointestinal Liver Physiology. 2012;303(5):G589–G599. doi: 10.1152/ajpgi.00488.2011. PubMed PMID: 22700822. [DOI] [PubMed] [Google Scholar]
- 16.Caesar R., Tremaroli V., Kovatcheva-Datchary P., Cani P.D., Backhed F. Crosstalk between gut microbiota and dietary lipids aggravates WAT inflammation through TLR signaling. Cell Metabolism. 2015 doi: 10.1016/j.cmet.2015.07.026. PubMed PMID: 26321659. [DOI] [PMC free article] [PubMed] [Google Scholar]
- 17.Caesar R., Nygren H., Oresic M., Backhed F. Interaction between dietary lipids and gut microbiota regulates hepatic cholesterol metabolism. Journal of Lipid Research. 2016;57(3):474–481. doi: 10.1194/jlr.M065847. PubMed PMID: 26783361; PubMed Central PMCID: PMC4766996. [DOI] [PMC free article] [PubMed] [Google Scholar]
- 18.Backhed F. Programming of host metabolism by the gut microbiota. Annals of Nutrition & Metabolism. 2011;58(Suppl. 2):44–52. doi: 10.1159/000328042. PubMed PMID: 21846980. [DOI] [PubMed] [Google Scholar]
- 19.Fukuda S., Ohno H. Gut microbiome and metabolic diseases. Seminars in immunopathology. 2014;36(1):103–114. doi: 10.1007/s00281-013-0399-z. PubMed PMID: 24196453. [DOI] [PubMed] [Google Scholar]
- 20.Tremaroli V., Backhed F. Functional interactions between the gut microbiota and host metabolism. Nature. 2012;489(7415):242–249. doi: 10.1038/nature11552. PubMed PMID: 22972297. [DOI] [PubMed] [Google Scholar]
- 21.Wostmann B.S., Bruckner-Kardoss E., Pleasants J.R. Oxygen consumption and thyroid hormones in germfree mice fed glucose-amino acid liquid diet. The Journal of nutrition. 1982;112(3):552–559. doi: 10.1093/jn/112.3.552. PubMed PMID: 7062149. [DOI] [PubMed] [Google Scholar]
- 22.Packard G.C., Boardman T.J. The use of percentages and size-specific indices to normalize physiological data for variation in body size: wasted time, wasted effort? Comparative Biochemistry and Physiology Part A. 1999;122:37–44. [Google Scholar]
- 23.Tschöp M.H., Speakman J.R., Arch J.R.S., Auwerx J., Brüning J.C., Chan L. A guide to analysis of mouse metabolism. Nature Methods. 2012;9(1):57–63. doi: 10.1038/nmeth.1806. [DOI] [PMC free article] [PubMed] [Google Scholar]
- 24.Even P.C., Nadkarni N.A. Indirect calorimetry in laboratory mice and rats: principles, practical considerations, interpretation and perspectives. American Journal of Physiology Regulatory, Integrative and Comparative Physiology. 2012;303(5):R459–R476. doi: 10.1152/ajpregu.00137.2012. PubMed PMID: 22718809. [DOI] [PubMed] [Google Scholar]
- 25.Seyfarth K., Poschmann G., Rozman J., Fromme T., Rink N., Hofmann A. The development of diet-induced obesity and associated metabolic impairments in Dj-1 deficient mice. The Journal of Nutritional Biochemistry. 2015;26(1):75–81. doi: 10.1016/j.jnutbio.2014.09.002. PubMed PMID: 25448609. [DOI] [PubMed] [Google Scholar]
- 26.Walker A., Pfitzner B., Neschen S., Kahle M., Harir M., Lucio M. Distinct signatures of host-microbial meta-metabolome and gut microbiome in two C57BL/6 strains under high-fat diet. The ISME Journal. 2014;8(12):2380–2396. doi: 10.1038/ismej.2014.79. PubMed PMID: 24906017; PubMed Central PMCID: PMCPMC4260703. [DOI] [PMC free article] [PubMed] [Google Scholar]
- 27.Lagkouvardos I., Klaring K., Heinzmann S.S., Platz S., Scholz B., Engel K.H. Gut metabolites and bacterial community networks during a pilot intervention study with flaxseeds in healthy adult men. Molecular Nutrition & Food Research. 2015 doi: 10.1002/mnfr.201500125. PubMed PMID: 25988339. [DOI] [PubMed] [Google Scholar]
- 28.Untergasser A., Cutcutache I., Koressaar T., Ye J., Faircloth B.C., Remm M. Primer3–new capabilities and interfaces. Nucleic Acids Research. 2012;40(15):e115. doi: 10.1093/nar/gks596. PubMed PMID: 22730293; PubMed Central PMCID: PMC3424584. [DOI] [PMC free article] [PubMed] [Google Scholar]
- 29.Weigt C., Hertrampf T., Flenker U., Hulsemann F., Kurnaz P., Fritzemeier K.H. Effects of estradiol, estrogen receptor subtype-selective agonists and genistein on glucose metabolism in leptin resistant female Zucker diabetic fatty (ZDF) rats. The Journal of Steroid Biochemistry and Molecular Biology. 2015 doi: 10.1016/j.jsbmb.2015.06.002. PubMed PMID: 26134426. [DOI] [PubMed] [Google Scholar]
- 30.Dakin R.S., Walker B.R., Seckl J.R., Hadoke P.W., Drake A.J. Estrogens protect male mice from obesity complications and influence glucocorticoid metabolism. International Journal of Obesity. 2015 doi: 10.1038/ijo.2015.102. PubMed PMID: 26032810. [DOI] [PMC free article] [PubMed] [Google Scholar]
- 31.Watanabe M., Horai Y., Houten S.M., Morimoto K., Sugizaki T., Arita E. Lowering bile acid pool size with a synthetic farnesoid X receptor (FXR) agonist induces obesity and diabetes through reduced energy expenditure. The Journal of Biological Chemistry. 2011;286(30):26913–26920. doi: 10.1074/jbc.M111.248203. PubMed PMID: 21632533; PubMed Central PMCID: PMC3143650. [DOI] [PMC free article] [PubMed] [Google Scholar]
- 32.Watanabe M., Houten S.M., Mataki C., Christoffolete M.A., Kim B.W., Sato H. Bile acids induce energy expenditure by promoting intracellular thyroid hormone activation. Nature. 2006;439(7075):484–489. doi: 10.1038/nature04330. PubMed PMID: 16400329. [DOI] [PubMed] [Google Scholar]
- 33.Sayin S.I., Wahlstrom A., Felin J., Jantti S., Marschall H.U., Bamberg K. Gut microbiota regulates bile acid metabolism by reducing the levels of tauro-beta-muricholic acid, a naturally occurring FXR antagonist. Cell Metabolism. 2013;17(2):225–235. doi: 10.1016/j.cmet.2013.01.003. PubMed PMID: 23395169. [DOI] [PubMed] [Google Scholar]
- 34.Karlsson F., Tremaroli V., Nielsen J., Backhed F. Assessing the human gut microbiota in metabolic diseases. Diabetes. 2013;62(10):3341–3349. doi: 10.2337/db13-0844. PubMed PMID: 24065795; PubMed Central PMCID: PMC3781439. [DOI] [PMC free article] [PubMed] [Google Scholar]
- 35.Levenson S.M., Doft F., Lev M., Kan D. Influence of microorganisms on oxygen consumption, carbon dioxide production and colonic temperature of rats. The Journal of Nutrition. 1969;97(4):542–552. doi: 10.1093/jn/97.4.542. PubMed PMID: 4305338. [DOI] [PubMed] [Google Scholar]
- 36.Bruckner-Kardoss E., Wostmann B.S. Oxygen consumption of germfree and conventional mice. Laboratory Animal Science. 1978;28(3):282–286. PubMed PMID: 682576. [PubMed] [Google Scholar]
- 37.Turnbaugh P.J., Ley R.E., Mahowald M.A., Magrini V., Mardis E.R., Gordon J.I. An obesity-associated gut microbiome with increased capacity for energy harvest. Nature. 2006;444(7122):1027–1031. doi: 10.1038/nature05414. PubMed PMID: 17183312. [DOI] [PubMed] [Google Scholar]
- 38.Hesse D., Dunn M., Heldmaier G., Klingenspor M., Rozman J. Behavioural mechanisms affecting energy regulation in mice prone or resistant to diet- induced obesity. Physiology & Behavior. 2010;99(3):370–380. doi: 10.1016/j.physbeh.2009.12.001. PubMed PMID: 20018202. [DOI] [PubMed] [Google Scholar]
- 39.Ravussin E., Bogardus C. Relationship of genetics, age, and physical fitness to daily energy expenditure and fuel utilization. The American Journal of Clinical Nutrition. 1989;49(5 Suppl):968–975. doi: 10.1093/ajcn/49.5.968. PubMed PMID: 2655422. [DOI] [PubMed] [Google Scholar]
- 40.Leibel R.L., Rosenbaum M., Hirsch J. Changes in energy expenditure resulting from altered body weight. The New England Journal of Medicine. 1995;332(10):621–628. doi: 10.1056/NEJM199503093321001. PubMed PMID: 7632212. [DOI] [PubMed] [Google Scholar]
- 41.da-Silva W.S., Ribich S., Arrojo e Drigo R., Castillo M., Patti M.E., Bianco A.C. The chemical chaperones tauroursodeoxycholic and 4-phenylbutyric acid accelerate thyroid hormone activation and energy expenditure. FEBS Letters. 2011;585(3):539–544. doi: 10.1016/j.febslet.2010.12.044. PubMed PMID: 21237159; PubMed Central PMCID: PMC3133948. [DOI] [PMC free article] [PubMed] [Google Scholar]
- 42.Ockenga J., Valentini L., Schuetz T., Wohlgemuth F., Glaeser S., Omar A. Plasma bile acids are associated with energy expenditure and thyroid function in humans. The Journal of Clinical Endocrinology and Metabolism. 2012;97(2):535–542. doi: 10.1210/jc.2011-2329. PubMed PMID: 22162464. [DOI] [PubMed] [Google Scholar]
- 43.Evans J.M., Morris L.S., Marchesi J.R. The gut microbiome: the role of a virtual organ in the endocrinology of the host. The Journal of Endocrinology. 2013;218(3):R37–R47. doi: 10.1530/JOE-13-0131. PubMed PMID: 23833275. [DOI] [PubMed] [Google Scholar]
- 44.Daniel H., Moghaddas Gholami A., Berry D., Desmarchelier C., Hahne H., Loh G. High-fat diet alters gut microbiota physiology in mice. The ISME Journal. 2014;8(2):295–308. doi: 10.1038/ismej.2013.155. PubMed PMID: 24030595; PubMed Central PMCID: PMC3906816. [DOI] [PMC free article] [PubMed] [Google Scholar]
- 45.Luu W., Sharpe L.J., Gelissen I.C., Brown A.J. The role of signalling in cellular cholesterol homeostasis. IUBMB Life. 2013;65(8):675–684. doi: 10.1002/iub.1182. PubMed PMID: 23847008. [DOI] [PubMed] [Google Scholar]
- 46.Deluca H.F. History of the discovery of vitamin D and its active metabolites. BoneKEy Reports. 2014;3:479. doi: 10.1038/bonekey.2013.213. PubMed PMID: 24466410; PubMed Central PMCID: PMC3899558. [DOI] [PMC free article] [PubMed] [Google Scholar]
- 47.Patel S.B. Plant sterols and stanols: their role in health and disease. Journal of Clinical Lipidology. 2008;2(2):S11–S19. doi: 10.1016/j.jacl.2008.01.007. PubMed PMID: 19343077; PubMed Central PMCID: PMC2390824. [DOI] [PMC free article] [PubMed] [Google Scholar]
- 48.Ramesha C.S., Paul R., Ganguly J. Effect of dietary unsaturated oils on the biosynthesis of cholesterol, and on biliary and fecal excretion of cholesterol and bile acids in rats. The Journal of Nutrition. 1980;110(11):2149–2158. doi: 10.1093/jn/110.11.2149. PubMed PMID: 7431117. [DOI] [PubMed] [Google Scholar]
- 49.Berr F., Goetz A., Schreiber E., Paumgartner G. Effect of dietary n-3 versus n-6 polyunsaturated fatty acids on hepatic excretion of cholesterol in the hamster. Journal of Lipid Research. 1993;34(8):1275–1284. PubMed PMID: 8409762. [PubMed] [Google Scholar]
- 50.Chen J.Q., Brown T.R., Russo J. Regulation of energy metabolism pathways by estrogens and estrogenic chemicals and potential implications in obesity associated with increased exposure to endocrine disruptors. Biochimica et Biophysica Acta. 2009;1793(7):1128–1143. doi: 10.1016/j.bbamcr.2009.03.009. PubMed PMID: 19348861; PubMed Central PMCID: PMC2747085. [DOI] [PMC free article] [PubMed] [Google Scholar]
- 51.Heine P.A., Taylor J.A., Iwamoto G.A., Lubahn D.B., Cooke P.S. Increased adipose tissue in male and female estrogen receptor-alpha knockout mice. Proceedings of the National Academy of Sciences of the United States of America. 2000;97(23):12729–12734. doi: 10.1073/pnas.97.23.12729. PubMed PMID: 11070086; PubMed Central PMCID: PMC18832. [DOI] [PMC free article] [PubMed] [Google Scholar]
- 52.Cooke P.S., Heine P.A., Taylor J.A., Lubahn D.B. The role of estrogen and estrogen receptor-alpha in male adipose tissue. Molecular and Cellular Endocrinology. 2001;178(1–2):147–154. doi: 10.1016/s0303-7207(01)00414-2. PubMed PMID: 11403904. [DOI] [PubMed] [Google Scholar]
- 53.Gao Q., Mezei G., Nie Y., Rao Y., Choi C.S., Bechmann I. Anorectic estrogen mimics leptin's effect on the rewiring of melanocortin cells and Stat3 signaling in obese animals. Nature Medicine. 2007;13(1):89–94. doi: 10.1038/nm1525. PubMed PMID: 17195839. [DOI] [PubMed] [Google Scholar]
- 54.Xu Y., Nedungadi T.P., Zhu L., Sobhani N., Irani B.G., Davis K.E. Distinct hypothalamic neurons mediate estrogenic effects on energy homeostasis and reproduction. Cell Metabolism. 2011;14(4):453–465. doi: 10.1016/j.cmet.2011.08.009. PubMed PMID: 21982706; PubMed Central PMCID: PMC3235745. [DOI] [PMC free article] [PubMed] [Google Scholar]
- 55.Baptissart M., Vega A., Martinot E., Baron S., Lobaccaro J.M., Volle D.H. Farnesoid X receptor alpha: a molecular link between bile acids and steroid signaling? Cellular and Molecular Life Sciences: CMLS. 2013;70(23):4511–4526. doi: 10.1007/s00018-013-1387-0. PubMed PMID: 23784309. [DOI] [PMC free article] [PubMed] [Google Scholar]
- 56.Kless C., Muller V.M., Schuppel V.L., Lichtenegger M., Rychlik M., Daniel H. Diet-induced obesity causes metabolic impairment independent of alterations in gut barrier integrity. Molecular Nutrition & Food Research. 2015;59(5):968–978. doi: 10.1002/mnfr.201400840. PubMed PMID: 25676872. [DOI] [PubMed] [Google Scholar]
- 57.Cani P.D., Bibiloni R., Knauf C., Waget A., Neyrinck A.M., Delzenne N.M. Changes in gut microbiota control metabolic endotoxemia-induced inflammation in high-fat diet-induced obesity and diabetes in mice. Diabetes. 2008;57(6):1470–1481. doi: 10.2337/db07-1403. PubMed PMID: 18305141. [DOI] [PubMed] [Google Scholar]
- 58.Kim K.A., Gu W., Lee I.A., Joh E.H., Kim D.H. High fat diet-induced gut microbiota exacerbates inflammation and obesity in mice via the TLR4 signaling pathway. PLoS One. 2012;7(10):e47713. doi: 10.1371/journal.pone.0047713. PubMed PMID: 23091640; PubMed Central PMCID: PMC3473013. [DOI] [PMC free article] [PubMed] [Google Scholar]
- 59.Beckh K., Kneip S., Arnold R. Direct regulation of bile secretion by prostaglandins in perfused rat liver. Hepatology. 1994;19(5):1208–1213. PubMed PMID: 8175143. [PubMed] [Google Scholar]
- 60.Kir S., Zhang Y., Gerard R.D., Kliewer S.A., Mangelsdorf D.J. Nuclear receptors HNF4alpha and LRH-1 cooperate in regulating Cyp7a1 in vivo. The Journal of Biological Chemistry. 2012;287(49):41334–41341. doi: 10.1074/jbc.M112.421834. PubMed PMID: 23038264; PubMed Central PMCID: PMC3510831. [DOI] [PMC free article] [PubMed] [Google Scholar]
- 61.Martinez-Augustin O., Sanchez de Medina F. Intestinal bile acid physiology and pathophysiology. World Journal of Gastroenterology: WJG. 2008;14(37):5630–5640. doi: 10.3748/wjg.14.5630. PubMed PMID: 18837078; PubMed Central PMCID: PMC2748196. [DOI] [PMC free article] [PubMed] [Google Scholar]
- 62.Pfeiffer N., Desmarchelier C., Blaut M., Daniel H., Haller D., Clavel T. Acetatifactor muris gen. nov., sp. nov., a novel bacterium isolated from the intestine of an obese mouse. Archives of Microbiology. 2012;194(11):901–907. doi: 10.1007/s00203-012-0822-1. PubMed PMID: 22659832. [DOI] [PubMed] [Google Scholar]
- 63.Freier T.A., Beitz D.C., Li L., Hartman P.A. Characterization of Eubacterium coprostanoligenes sp. nov., a cholesterol-reducing anaerobe. International Journal of Systematic Bacteriology. 1994;44(1):137–142. doi: 10.1099/00207713-44-1-137. PubMed PMID: 8123557. [DOI] [PubMed] [Google Scholar]
- 64.Chun J., Lee J.H., Jung Y., Kim M., Kim S., Kim B.K. EzTaxon: a web-based tool for the identification of prokaryotes based on 16S ribosomal RNA gene sequences. International Journal of Systematic and Evolutionary Microbiology. 2007;57(Pt 10):2259–2261. doi: 10.1099/ijs.0.64915-0. PubMed PMID: 17911292. [DOI] [PubMed] [Google Scholar]
Associated Data
This section collects any data citations, data availability statements, or supplementary materials included in this article.
Supplementary Materials
Sterility of germfree mice approved by 16S RDNA PCR. Random cecal samples were analyzed by 16S rDNA PCR to account for sterility of GF mice. Cecal samples of SPF mice were used as positive controls. n = 3 per group and diet. No bands appeared for the GF samples confirming sterility. Bands at 1.5 kb in SPF samples indicate the presence of bacteria.