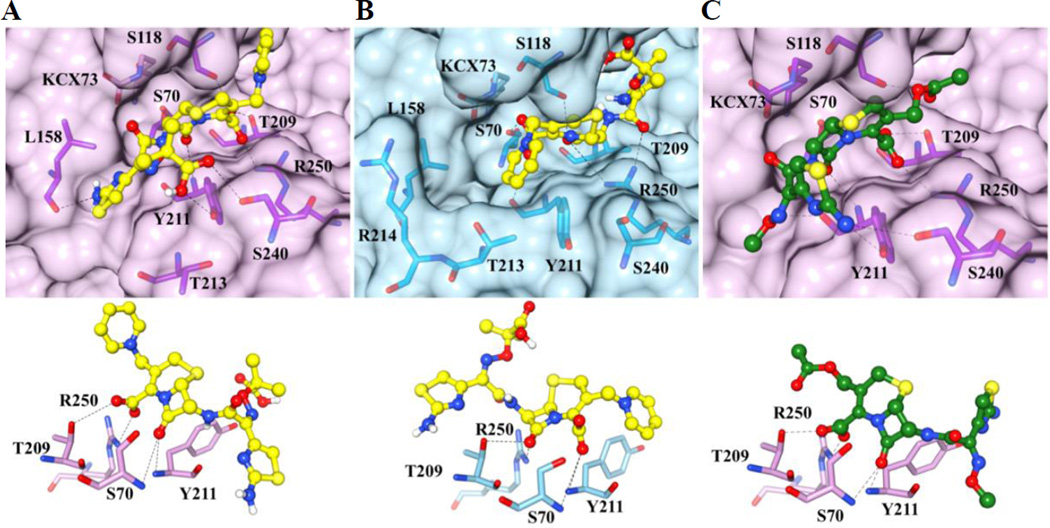
Figure 4. Docking results of ceftazidime with OXA-163 (lavender) and OXA-48 (light blue) and cefotaxime with OXA-163.
The protein structures are in surface representation and the residues that interact with ceftazidime or cefotaxime are shown in yellow and green stick representation, respectively. The carboxylated Lys73, which is not within interaction distance with the substrate, is also shown and is labeled KCX73. Black dashed lines represent hydrogen bonds. Panel A top: The conformation with the lowest binding energy of ceftazidime for OXA-163 is shown. Panel B top: The conformation of ceftazidime with the lowest binding energy for OXA-48 is shown. In OXA-48, the ceftazidime molecule is flipped compared to the conformation in OXA-163. The docked conformation of ceftazidime in the active site of OXA-48 is not consistent with catalysis. Panel C top: The conformation with the lowest binding energy for OXA-163 with cefotaxime is shown. The bottom panels show the oxyanion hole formed by Ser70 and Tyr211 and the interaction between the carboxylate group of ceftazidime or ceftotaxime with Thr209 and Arg250. These interactions are altered in the docked conformation of ceftazidime in OXA-48 (panel B bottom) such that the β-lactam carbonyl interacts with Thr209 and Arg250 while Ser70 and Tyr211 interact with the carboxylate moiety.

