

Summary
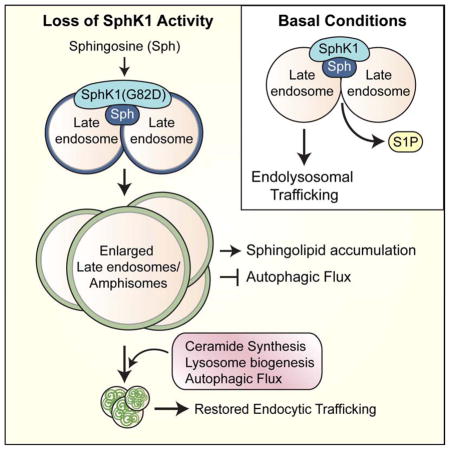
SphK1 associates with early endocytic membranes during endocytosis; however, the role of sphingosine or sphingosine-1-phosphate as the critical metabolite in endocytic trafficking has not been established. Here, we demonstrate that the recruitment of SphK1 to sphingosine-enriched endocytic vesicles and the generation of sphingosine-1-phosphate facilitate membrane trafficking along the endosomal pathway. Exogenous sphingosine and sphingosine-based SphK1 inhibitors induce the SphK1-dependent fusion of endosomal membranes to accumulate enlarged late endosomes and amphisomes enriched in sphingolipids. Interestingly, SphK1 also appears to facilitate endosomal fusion independent of its catalytic activity, as catalytically inactive SphK1G82D is recruited to endocytic membranes by sphingosine or sphingosine-based SphK1 inhibitor and promotes membrane fusion. Furthermore, we reveal that the clearance of enlarged endosomes is dependent on the activity of ceramide synthase, lysosomal biogenesis and the restoration of autophagic flux. Collectively, these studies uncover intersecting roles for SphK1, sphingosine and autophagic machinery in endocytic membrane trafficking.
Keywords: Sphingosine kinase 1, sphingosine, sphingosine-1-phosphate, endocytic trafficking, late endosome, autophagy
eTOC Blurb
Young et al. show that SphK1 facilitates endocytic trafficking. Inhibition of SphK1 with a lipid-based inhibitor or in the presence of sphingosine accumulates enlarged, dysfunctional late endosomes that impair autophagy. The autophagic machinery coordinates with lysosomal biogenesis to restore endocytic trafficking, thus highlighting crosstalk between autophagy, sphingolipids and endocytosis.
Introduction
Sphingolipids are a class of inter-convertible, bioactive lipids that have dynamic functions in cellular signaling and membrane composition. Sphingosine kinase (SphK) catalyzes the conversion of pro-apoptotic sphingosine (Sph) to pro-survival sphingosine-1-phosphate (S1P) (Hannun and Obeid, 2008). In addition to cellular signaling, SphK modulates membrane dynamics by converting the largely membrane-restricted substrate Sph to soluble S1P (Goñi et al., 2014). Sphingoid base metabolism also has a conserved role in endocytosis, as it is required for yeast endocytosis (Hannich et al., 2011), synaptic vesicle recycling in D. melanogaster (Rohrbough et al., 2004) and C. elegans (Chan and Sieburth, 2012; Chan et al., 2012), and endolysosomal trafficking in D. melanogaster photoreceptors (Acharya et al., 2003, 2004; Yonamine et al., 2011).
The regulation of membrane fusion events by Sph and S1P was initially characterized in neurons during synaptic vesicle exocytosis. The sole C. elegans isoform, sphk-1, localizes to presynaptic terminals for the generation of S1P and recruitment of the soluble N-ethylmaleimide-sensitive factor activating protein receptor (SNARE) Munc13 for synaptic vesicle release (Chan and Sieburth, 2012; Chan et al., 2012). Moreover, Sph alters the local membrane environment to activate synaptobrevin for SNARE complex assembly and membrane fusion (Darios et al., 2009). Local accumulation of Sph also induces a conformational change in the SNARE Syntaxin1 to enhance its interaction with the docking molecule Munc18 and sequester synaptic vesicles away from the active zone (Camoletto et al., 2009). As neuronal and endocytic SNARE proteins are highly conserved in structure and function (Antonin, 2000), we hypothesize that sphingoid base metabolism regulates membrane fusion events in the endocytic pathway. Indeed, knockdown of both mammalian SphK isoforms impairs transferrin uptake and recycling to suggest a conserved function in endocytosis (Shen et al., 2014). While SphK1 recruitment to early endocytic intermediates has recently been reported, the identification of Sph or S1P as the important metabolite in this process has not been firmly established.
The endocytic pathway converges with the highly conserved cellular recycling pathway of autophagy. During autophagy, damaged proteins and/or organelles are engulfed within double-membrane vesicles known as autophagosomes and delivered to late endosomes and/or lysosomes for degradation (Amaya et al., 2015). Autophagy is regulated by over 30 identified autophagy-related (Atg) genes (Feng et al., 2014). Autophagic degradation requires functional late endosomes and lysosomes, and thus it is not surprising that several components of the autophagic machinery positively regulate the endocytic pathway (Lamb et al., 2013), including Beclin1 (Liang et al., 2008; Ruck et al., 2011), Atg14L (Kim et al., 2012), Atg5 (Peng et al., 2014) and Atg3 (Murrow et al., 2015). Bidirectional crosstalk also occurs between autophagy and sphingolipids, as sphingolipids positively and negatively regulate autophagy (Young et al., 2013) and accumulate in autophagy-deficient cells (Alexaki et al., 2014).
Here, we utilized exogenous Sph, SphK1-selective inhibitors, and genetic approaches to demonstrate a role for Sph and SphK1 in endocytic membrane trafficking. Moreover, as the autophagic machinery restores endocytic function in response to disruption by a SphK1-selective inhibitor, our studies validate the importance of autophagy-related proteins in the maintenance of endocytic trafficking.
Results
The SphK1-selective inhibitor and Sph-mimetic, SK1-I, impairs endocytic membrane trafficking
Tools that allow for the study of dynamic changes in endogenous sphingolipids within localized cellular membranes during endocytosis remain to be established. Thus to investigate the role of SphK1 activity in endocytic trafficking, we utilized several pharmacological inhibitors. Unexpectedly, Sph-based SphK inhibitors SK1-I, N,N-dimethyl-sphingosine (DMS) or FTY720 induce the rapid appearance of dilated cytosolic structures that we will call “vacuoles” (Figure 1A). Vacuolization is dose- and time-dependent and occurs in transformed mouse embryonic fibroblasts (MEFs) as well as multiple cancer cell lines, including HeLa cells (Figures 1A, and S1A–S1C). In contrast to macropinocytosis, the large vacuoles (>5 μm in diameter) arise from the progressive fusion of small perinuclear vacuoles (Movies S1 and S2). Interestingly, the Sph-based inhibitors also generate small vacuoles in SphK1-deficient MEFs; however, these structures do not fuse upon prolonged monitoring to suggest that vacuole enlargement is SphK1-dependent (Figures 1A, S1B, S1D, and S1E; Movies S3 and S4).
Figure 1. The SphK1-selective inhibitor and Sph-mimetic, SK1-I, impairs endocytic membrane trafficking.

(A) Representative phase contrast images of wild-type (WT) and SphK1−/− MEFs treated with DMSO, 10 μM SK1-I, DMS or FTY720, or 1 μM PF-543 for 6 h.
(B) Live cell fluorescence imaging of WT and SphK1−/− MEFs stably expressing Lamp1-RFP (L1-RFP) co-treated with 100 μg/mL AlexaFluor488-dextran (AF488) and DMSO or 7.5 μM SK1-I for 2 h.
(C–D), Live cell fluorescence images of SphK1−/− MEFs stably expressing Lamp1-RFP (L1-RFP) transiently transfected with EGFP, EGFP-SphK1a (WT) or EGFP-SphK1aG82D (G82D) and treated with (C) DMSO or (D) 7.5 μM SK1-I for 4 h. DIC, differential interference contrast.
(E), Vacuole size of D is presented as the mean ± SEM from 3 independent experiments. n >400 vacuoles per treatment. ANOVA, ****, p <0.0001. AU, arbitrary units.
Scale bars represent: 20 μm in (A); 10 μm in (B–D); 5 μm in enlarged panels of (D). See also Figure S1.
Strikingly, vacuoles are not observed under basal conditions in SphK1−/− MEFs or upon SphK1 inhibition by the potent, small molecule inhibitor PF-543 (Figure 1A). We hypothesize that treatment with the Sph mimetics SK1-I, DMS, and FTY720 overloads endocytic membranes with Sph-like lipids to promote SphK1-dependent membrane fusion and vacuole formation. Consistently, phosphorylated FTY720 fails to induce vacuole formation, thus highlighting the importance of the Sph-like structure (Figure S1F). Moreover, vacuolization occurs independent of S1P receptor (S1PR) signaling as pre-treatment with the S1PR agonist FTY720-phosphate fails to alter vacuole formation by FTY720 or SK1-I (Figure S1G).
As SK1-I is a SphK1-selective inhibitor (Paugh et al., 2008), and SphK1 is implicated in endocytosis (Shen et al., 2014), we chose the isozyme selective inhibitor for further study. Consistent with a role in endocytic trafficking, the limiting membranes of SK1-I-induced vacuoles contain the late endosome and lysosome (LE/Lys) marker Lamp1-RFP (Figure 1B). In contrast, mitochondrial and endoplasmic reticulum structures remain relatively intact (Figures S2A and S2B). To visualize fluid-phase endocytosis, cells were co-treated with 10 kDa AlexaFluor488-dextran. Interestingly, basal fluid-phase endocytosis is not altered by the loss of SphK1, as the internalization and delivery of fluorescent dextran to Lamp1-positive puncta is comparable in wild-type (WT) and SphK1−/− cells (Figure 1B). In contrast, inhibition of SphK1 by SK1-I accumulates large Lamp1-positive vacuoles containing fluorescent dextran while treatment of SphK1−/− cells moderately accumulates fluorescent dextran puncta that are significantly smaller than the vacuoles of WT cells (Figure 1B).
To confirm that the enlargement of SK1-I-induced vacuoles is SphK1-dependent, SphK1 expression was rescued in SphK1-deficient MEFs (Figures 1C and 1D). Indeed, transient expression of EGFP-tagged murine SphK1a significantly enlarges SK1-I-induced Lamp1-positive vacuoles compared to EGFP control (Figures 1D and 1E). Unexpectedly, EGFP-tagged catalytically inactive SphK1aG82D significantly enlarges SK1-I-induced vacuoles (Figures 1D and 1E). EGFP-SphK1a and EGFP-SphK1aG82D are both recruited to vacuole membranes during SK1-I treatment and are present during vacuole fusion (Figure 1D and Movie S5), leading us to hypothesize that SphK1 can promote membrane fusion independent of its catalytic activity. Collectively, these studies reveal that inhibition of SphK1 by SK1-I promotes LE/Lys fusion in a SphK1-dependent manner.
SphK1 activity promotes endocytic membrane trafficking
Next, we attempted to mimic the effect of SK1-I by overloading the endocytic pathway with a non-toxic dose of exogenous D-erythro-sphingosine (Sph) in the presence of PF-543. Exogenous Sph induces the dose-dependent formation of vacuoles in both WT and SphK1-deficient MEFs (Figures 2A and S2C). However, in contrast to non-metabolizable SK1-I, Sph-induced vacuoles rapidly disappear by 4 h in WT cells (Figure 2B). Interestingly, loss of SphK1 or inhibition of SphK1 by PF-543 significantly prolongs Sph-induced vacuoles to suggest a critical role for SphK1 activity in restoring membrane trafficking in response to exogenous Sph (Figures 2B, S2D and S2E). Similar to SK1-I, Sph-induced vacuoles are positive for Lamp1-RFP to indicate that an overload of Sph blocks endocytic trafficking at LE/Lys (Figure 2C).
Figure 2. SphK1-dependent phosphorylation of sphingosine promotes endocytic membrane trafficking.

(A) Phase contrast images of WT or SphK1−/− MEFs treated with DMSO or 10 μM D-erythro-sphingosine (Sph) for 1 h.
(B) WT or SphK1−/− MEFs pre-treated with DMSO or 2.5 μM PF-543 for 30 min followed by DMSO or 10 μM Sph for an additional 4 h.
(C) SphK1−/− MEFs stably expressing Lamp1-RFP (L1-RFP) transiently transfected with EGFP, EGFP-SphK1G82D (G82D), or EGFP-SphK1 (WT) plasmids and treated with 7.5 μM Sph for 4 h.
(D) Vacuole size of C is presented as the mean ± SEM from 2 independent experiments. n >800 vacuoles per treatment. ANOVA, ****, p <0.0001. AU, arbitrary units.
Scale bars represent: 20 μm in (A–B); 10 μm in (C) & enlarged panels of (B); 5 μm in enlarged panels of (C). See also Figure S2.
To confirm the result using a genetic approach, EGFP-SphK1a or EGFP-SphK1aG82D were transiently expressed in SphK1-deficient MEFs (Figures 1C and 2C). Indeed, EGFP or EGFP-SphK1aG82D expressing cells sustain Sph-induced vacuoles compared to rescue cells expressing EGFP-SphK1a (Figures 2C). Interestingly, the size of Sph-induced vacuoles is significantly increased by EGFP-SphK1aG82D compared EGFP control to once again suggest that recruitment of SphK1 can promote the fusion of Sph-containing endocytic membranes independent of its catalytic activity (Figures 2C and 2D). Taken together, these results suggest a role for Sph and SphK1 protein in endosomal maturation.
Inhibition of SphK1 by SK1-I accumulates enlarged late endosomes and amphisomes enriched in sphingolipids
As exogenous Sph is a substrate of several sphingolipid-metabolizing enzymes, we chose to utilize non-metabolizable SK1-I to further characterize the endocytic defect. As the disruption of lipid rafts at the plasma membrane recruits SphK1 to early endocytic intermediates (Shen et al., 2014), cells were briefly treated with the cholesterol-depleting agent hydroxypropyl-β-cyclodextrin (HPβCD) prior to SK1-I. Interestingly, cellular vacuolization and uptake of SK1-I were impaired by HPβCD to suggest that the lipid-based inhibitor enters the cell by cholesterol-dependent endocytosis (Figures S3A and S3B). Consistently, inhibition of endocytosis by pre-treatment with vacuolar ATPase inhibitor, Bafilomycin A1 (BafA1) also impairs SK1-I-induced vacuole formation (Figure S3A).
Consistent with a defect in endosomal trafficking, EEA1-positive early endosomes are slightly enlarged by SK1-I (Figure 3A). While the large vacuoles contain the LE/Lys marker Lamp1-RFP, the vacuoles are devoid of cathepsin B activity and fail to accumulate the acidic probe LysoSensor to suggest impaired function (Figures 3B and 3C). Moreover, the enlarged vacuoles contain endogenous Lamp1 that colocalizes with LE marker Rab7 and autophagy marker GFP-LC3 (Figure 3D). Transmission electron microscopy (TEM) of SK1-I treated cells reveals the accumulation of massive endosomes containing intraluminal vesicles (ILVs) that are indicative of LEs (Figure 3E, i–ii). Consistent with an accumulation of GFP-LC3, SK1-I treated cells accumulate large amphisome-like structures containing ILVs in the presence of undigested cytoplasmic material to suggest impaired autophagy (Figure 3E, iii–iv).
Figure 3. Inhibition of SphK1 by SK1-I accumulates stalled late endosomes and amphisomes.

(A) Fluorescence images of WT MEFs stably expressing Lamp1-RFP treated with 10 μM SK1-I for 6 h and immunostained with anti-EEA1.
(B) Live cell fluorescence images of WT MEFs co-treated with 100 μg/mL AlexaFluor488-Dextran (AF488-Dex) and 7.5 μM SK1-I for 4 h followed by MagicRed Cathepsin B substrate (MR-CathB).
(C) Live cell fluorescence images of WT MEFs treated with 7.5 μM SK1-I for 4 h followed by labeling with LysoSensor DND-189.
(D) Confocal images of WT MEFs stably expressing GFP-LC3 treated with 7.5 μM SK1-I for 6 h and immunostained using anti-Lamp1 (red) and anti-Rab7 (cyan).
(E) TEM images of WT MEFs treated with 10 μM SK1-I for 6 h. LE, late endosome; A, amphisome; dotted outline, cytoplasmic material; arrowheads, intraluminal vesicles.
Scale bars represent: 10 μm in (A–C); 15 μm in (D); 5 μm (E, i); 1 μm in (E, ii–iv); 7.5 μm in enlarged panels of (D); 0.5 μm in enlarged panels of (E, iii–iv). See also Figure S3.
We next sought to investigate the sphingolipid profile of the vacuoles. Consistent with previous reports (Kapitonov et al., 2009; Paugh et al., 2008), SK1-I alters global sphingolipid metabolism by decreasing cellular S1P and increasing sphingosine, ceramide, monohexosylceramide and sphingomyelin (Figure S4). However, localized changes of sphingolipids can dynamically alter the biophysical properties of membranes (e.g. membrane curvature, lipid raft assembly, and bilayer fusion) that are implicated in membrane trafficking (van Blitterswijk et al., 2003). To examine sphingolipid changes within endocytic organelles, cell lysates were loaded onto a continuous OptiPrep gradient and fractionated by high-speed centrifugation prior to immunoblotting and LC-MS/MS quantitative analysis of sphingolipids (Figure 4).
Figure 4. SK1-I accumulates sphingolipids in enlarged late endosomes.

WT (A–D) or SphK1−/− (E–H) MEFs were treated with DMSO or 10 μM SK1-I for 4 h followed by subcellular fractionation. Protein expression was quantified by immunoblot and presented as percent enrichment in each fraction. Sphingolipids were quantified by LC-MS/MS and presented as pmol lipid per fraction. (A and E), Lamp1. (B and F), Ceramide. (C and G), Sphingomyelin. (D and H), Monohexosylceramide. See also Figure S5.
Consistent with the enlargement of LEs relatively devoid of contents (Figure 3E), Lamp1 and Rab7 are accumulated in lower density Fractions 3–4 upon SK1-I treatment compared to control (Figures 4A, S5A, and S5B). Moreover, a modest shift in Rab5 to lower density Fractions 7–8 by SK1-I is consistent with the slight enlargement of EEs (Figures S5C and 3A). In contrast, the subcellular distribution of mitochondrial marker Hsp60 is not altered by SK1-I (Figure S5D). Interestingly, the enlarged LE fraction accumulates ceramide, monohexosylceramide, and sphingomyelin (Fractions 3–4; Figures 4B–4D). Moreover, ceramide and sphingomyelin are slightly increased in the dilated EE fraction of SK1-I treated cells (Fractions 7–8; Figures 4B and 4C). Surprisingly, sphingosine does not accumulate in the enlarged LE fraction of SK1-I treated cells but rather displays a sharp enrichment in Fraction 9, which overlaps with endosomal and plasma membrane markers and is consistent with stalled endocytic trafficking (Figures S5E and S5F).
Despite comparable uptake of the inhibitor (Figure S5G), SphK1-deficient MEFs do not exhibit a significant shift in LE markers to lower density fractions nor accumulate sphingolipids after treatment with SK1-I (Figures 4E–4H, and S5H–J). Interestingly, the distribution of Lamp1 is slightly shifted toward lower density fractions in vehicle-treated SphK1−/− cells compared to WT (compare black lines in Figures 4A and 4E). Moreover, SphK1-deficient cells appear to mildly accumulate sphingolipids under basal conditions (compare black lines in Figures 4B–4D versus 4F–4H). It is tempting to speculate that the loss of SphK1 alters the lipid profile of LE/Lys. However, as SphK1−/− MEFs appear to maintain fluid phase endocytosis (Figure 1B) and Sphk1-null mice are viable with no apparent abnormalities (Allende et al., 2004), the effect of SphK1 deficiency on basal endosomal function requires further study. Collectively, these results demonstrate that SK1-I decreases S1P, accumulates sphingosine and induces the SphK1-dependent accumulation of sphingosine metabolites in enlarged LEs.
SK1-I induces autophagy and blocks autophagic flux
The endocytic pathway is critical for the maintenance of autophagic flux (Razi et al., 2009). Although the accumulation of dysfunctional LEs and amphisomes suggests impaired autophagic flux, autophagic activity was assessed by immunoblot for LC3-II, a widely used marker of autophagosomes, and the autophagic substrate p62/SQSTM1 (Klionsky et al., 2012). Autophagy induction is observed as the increase in LC3-II in the presence of lysosome inhibitors compared to lysosome inhibitors alone. Indeed, SK1-I significantly increases LC3-II in the presence of the lysosomal protease inhibitors E64d, pepstatin A and leupeptin (E/P/L) compared to E/P/L alone to indicate induced autophagosome formation (Figures 5A and 5B). Autophagic flux is indicated by an increase in LC3-II in the presence versus absence of lysosome inhibitors. Indeed, LC3-II is further accumulated by the presence of lysosome inhibitors in SK1-I treated cells at 6 h and 24 h to indicate induced autophagic flux (Figures 5A and 5C). In contrast, autophagic flux is impaired at 12 h of SK1-I treatment (Figures 5A and 5C). The accumulation of p62 and a high molecular weight p62 oligomer (approx. 250 kDa) at 6 h and 12 h of SK1-I that is unaffected by E/P/L is consistent with impaired autophagic flux (Figure 5D). In contrast, the restoration of p62 to basal levels at 24 h of SK1-I with accumulation by E/P/L indicates restored autophagic flux (Figure 5D). The discrepancy in autophagic flux at 6 h as determined by LC3-II and p62 may be due to autophagic flux in the absence of p62-associated cargo, autophagy-independent regulation of p62 or altered LC3-II delipidation.
Figure 5. SK1-I induces autophagy and blocks autophagic flux.

(A–D) Atg5+/+ MEFs were treated with DMSO or 10 μM SK1-I for the indicated durations. E64d (10 μM), pepstatin A (10 μgml−1), and leupeptin (1 μgml−1) (E/P/L) were added during the final 6 h of treatment. Lysates were analyzed by immunoblot for LC3, p62, and β-actin. (B) SK1-I-induced autophagy C) SK1-I-induced autophagic fluxand ( were calculated as described in the Experimental Procedures. (D) Quantification of p62 levels normalized to β-actin.
(E–F) Confocal images of MEFs stably expressing RFP-GFP-LC3 treated with DMSO or 7.5 μM SK1-I for (C) 6 h or (D) 16 h. E/P/L was added during the final 6 h of treatment. Data is presented as the mean ± SD from 3 independent experiments. ANOVA. *, p<0.05; **, p<0.01; ***, p<0.001; ****, p<0.0001. Scale bars represent 15 μm. See also Figure S6.
Tandem-fluorescent LC3 (tf-LC3; RFP-EGFP-LC3) was used as an additional approach to monitor autophagic flux. Autophagosomes (RFP+EGFP+ or “yellow” puncta) and degradative amphisomes/autolysosomes (RFP+EGFP− or “red” puncta) can be distinguished by the pH-sensitive quenching of EGFP. Consistent with immunoblotting, 6 h treatment with SK1-I induces autophagosome formation as RFP+EGFP+ LC3 puncta are accumulated by SK1-I in the presence of E/P/L compared to E/P/L alone (Figure 5E). As the phenotype is similar in cells treated with SK1-I in the presence or absence of E/P/L, autophagic flux appears to be minimal at 6 h (Figure 5E). The accumulation of large RFP+EGFP−LC3 structures by SK1-I is likely a result of the fusion of previously functional LE and amphisomes (Figure 5E). Consistently, prolonged treatment with SK1-I restores autophagic flux, as SK1-I-treated cells display an increase in RFP+EGFP−LC3 puncta indicative of degradative amphisomes/autolysosomes that is impaired by lysosomal inhibition (Figure 5F). Collectively, these results indicate that SK1-I induces autophagosome biogenesis and dynamically regulates autophagic flux to impair and restore degradation.
Autophagy machinery coordinates with lysosome biogenesis to clear enlarged LEs in response to SphK1 inhibition
To determine the role of autophagy during SphK1 inhibition, WT and autophagy-deficient Atg5−/− or Atg3−/− MEFs were treated with SK1-I. Atg5 and Atg3 are required for the lipidation of LC3-I to LC3-II during autophagosome biogenesis. Loss of autophagy does not alter vacuole formation by SK1-I. However, while WT cells clear SK1-I-induced vacuoles by 24 h, vacuoles are significantly sustained in Atg5- or Atg3-deficient MEFs (Figure 6A). To verify this result, GFP-Atg5 or mutant Atg5K130R, which is unable to rescue LC3 lipidation, was stably expressed in Atg5−/− MEFs. While GFP-Atg5 rescues vacuole clearance, Atg5K130R fails to do so to indicate that LC3 lipidation is required for clearance (Figure 6B). To assess the role of autophagic flux in vacuole clearance, cells were treated with SK1-I for 6 h followed by the addition of lysosomal protease inhibitors. Similar to the loss of Atg5 or -3, lysosome inhibition prolongs vacuoles in WT cells to suggest that autophagic flux is required for clearance (Figure 6B).
Figure 6. The LC3 conjugation machinery, lysosomal proteases, and ceramide synthase are required for the clearance of enlarged LEs induced by SK1-I.

(A) Phase contrast images of WT, Atg5−/− and Atg3−/− MEFs treated with 10 μM SK1-I for the indicated time course.
(B) Phase contrast images of WT, Atg5−/−, Atg5−/− GFP-Atg5, or Atg5−/− Atg5K130R-HA MEFs treated with 10 μM SK1-I for 6 h followed by the addition of E64d, pepstatin A and leupeptin (E/P/L) for an additional 18 h.
(C) TEM images of WT MEFs treated with 10 μM SK1-I for 16 h.
(D) Phase contrast images of SphK1+/+ MEFs pre-treated with 50 μM fumonisin B1 (FB1) for 30 min prior to the addition of 10 μM SK1-I for 4 h or 12 h.
(E) Immunoblot of SphK1+/+ MEFs pre-treated with 50 μM fumonisin B1 (FB1) for 30 min prior to the addition of 10 μM SK1-I for 12 h. Where indicated, E/P/L was added during the last 6 h of treatment.
(F) Phase contrast images of SphK1−/− MEFs pre-treated with 50 μM FB1 for 30 min prior to the addition of 10 μM Sph for 4 h or 12 h.
(G) Immunoblot of SphK1−/− MEFs pre-treated with 50 μM FB1 for 30 min prior to the addition of 10 μM Sph for 12 h. Where indicated, E/P/L was added during the last 6 h of treatment.
Scale bars represent: 20 μm in (A, B, D, & F); 5 μm in (C, i); 1 μm in (C, ii–iii); 0.5 μm in enlarged panel of (C, iii).
To examine the mechanism of vacuole clearance, MEFs stably expressing Lamp1-RFP were treated with SK1-I and monitored by time-lapse imaging. During vacuole clearance, small Lamp1-positive granule-like structures are recruited to the vacuole membrane prior to the gradual condensation of vacuoles (Movie S6). This mechanism is distinct from autophagic lysosome reformation in which proto-lysosomal tubules extend and bud from enlarged lysosomes (Yu et al., 2010). TEM imaging after vacuole clearance reveals the accumulation of significantly smaller vesicles containing multi-lamellar membranes (Figure 6C). As the enlarged LEs were initially devoid of membranes (Figure 3E), internalization of the limiting membrane appears to lead to vacuole shrinkage. Further study is required to uncover the mechanism of this process.
Sphingosine and ceramide have been implicated in the induction of autophagy and regulation of autophagic flux (Young et al., 2013). To determine whether sphingosine metabolism to ceramide is required for the autophagy-mediated clearance of SK1-I-induced vacuoles, ceramide synthase was inhibited by fumonisin B1 (FB1). Interestingly, FB1 significantly delays the clearance of SK1-I-induced vacuoles (Figure 6D). Of note, vacuole clearance is slightly accelerated in SphK1+/+ MEFs (12–20 h; Figure 6D and data not shown) compared to Atg5+/+MEFs (16–24 h; Figures 6A–C) to indicate that the precise timing of vacuole formation and clearance is likely dependent on genetic background. Importantly, LC3-II is increased upon co-treatment with SK1-I and FB1 compared to SK1-I alone (Figure 6E). Moreover, LC3-II accumulation appears to result from impaired flux, as LC3-II does not further accumulate with E/P/L. To assess the role of ceramide in the clearance of Sph-induced vacuoles in SphK1−/− MEFs, cells were treated with Sph in the presence of FB1. Consistent with SK1-I, inhibition of ceramide synthase by FB1 accumulates Sph-induced vacuoles in SphK1−/− MEFs (Figure 6F). A similar autophagic phenotype is observed, where FB1 increases LC3-II in the presence of Sph compared to Sph alone (Figure 6G). Moreover, FB1 impairs Sph-induced autophagic flux as LC3-II accumulation is insensitive to E/P/L compared to Sph treatment alone (Figure 6G). More detailed studies are required to dissect the dual effects of Sph and Sph metabolites in autophagosome formation and degradation.
While lysosomal protease activity is required for efficient clearance of SK1-I-induced vacuoles (Figure 6B), Cathepsin B activity is significantly suppressed by SK1-I after a few hours of treatment (Figure 3B). Thus, we hypothesized that new lysosome biogenesis may facilitate clearance. Transcription factor EB (TFEB) is a master regulator of autophagy and lysosome-associated genes (Settembre and Medina, 2015). As lysosomal Sph can activate TFEB (Höglinger et al., 2015), we examined TFEB localization during the clearance of SK1-I-induced vacuoles. Indeed, TFEB translocates to the nucleus prior to vacuole clearance (Figures 7A and 7B). Consistently, the expression of Lamp1 and Rab7, two TFEB target genes, are increased during vacuole clearance (Figure 7C).
Figure 7. The clearance of SK1-I-induced vacuoles occurs concomitantly with the activation of TFEB-mediated lysosome biogenesis and is dependent on Atg5.

(A) Live cell fluorescence images of WT and Atg5−/− MEFs stably expressing GFP-TFEB treated with 7.5 μM SK1-I for 16 h. White and yellow dotted lines represent outlines of nuclei lacking or containing GFP-TFEB, respectively.
(B) WT or Atg5−/− MEFs were treated with 10 μM SK1-I for 24 h and fractionated to obtain cytoplasmic (Cyt), nuclear binding proteins (NBP) or insoluble nuclear proteins (INB). Immunoblot for TFEB, α-tubulin and PARP.
(C) WT MEFs were treated with DMSO or 10 μM SK1-I for the indicated time points. Cell lysates were analyzed by immunoblot for Lamp1, Rab7 and β-actin.
(D) WT and Atg5−/− MEFs were pulsed with 100 μg/mL AF488-Dex for 1 h followed by a 2.5 h chase in dextran-free DMEM to label lysosomes. Live cell fluorescent images of cells treated with DMSO or 10 μM SK1-I for 4 h followed by MagicRed Cathepsin B substrate (MR-CathB).
Scale bars represent: 20 μm in (A); 10 μm in (D).
Notably, the nuclear translocation of TFEB in response to SK1-I is markedly suppressed in Atg5-deficient cells, which have impaired vacuole clearance (Figures 7A and 7B). To monitor lysosomes in Atg5−/− MEFs during SK1-I treatment, lysosomal compartments were pulse-chase labelled with 10 kDa AlexaFluor488-dextran. Unexpectedly, while the SK1-I-induced vacuoles of WT cells were labelled by fluorescent dextran, fluorescent dextran was maintained in punctate structures and not enlarged vacuoles in SK1-I treated Atg5−/− MEFs (Figure 7D). Loss of Atg5 has been reported to impair the retromer-mediated retrieval of mannose-6-phosphate receptor to result in hybrid LE/Lys (Peng et al., 2014). While beyond the scope of the current manuscript, we propose that the hybrid LE/Lys lack the machinery required for association with vacuoles for clearance. As Lys are not consumed in Atg5-deficient cells by autophagy, TFEB is not activated for lysosome biogenesis. These results emphasize the complex crosstalk between the endocytic pathway and autophagy machinery to suggest a potential mechanism for the clearance of dysfunctional LEs.
Discussion
The function of SphK1 in membrane trafficking appears to be highly conserved. Here, we provide evidence for the role of Sph and SphK1 in endocytic membrane trafficking. Our results suggest that SK1-I enters the cell via lipid raft-mediated endocytosis to imply that, like Sph, the inhibitor is largely restricted to membranes. By overloading endocytic membranes with exogenous Sph or Sph mimetic while inhibiting SphK1 activity (e.g. by SphK1aG82D, SK1-I or PF-543), SphK1 is stabilized at LE membranes to promote membrane fusion and reveal a role for Sph and SphK1 in endosomal fusion. We believe that small molecule inhibitors like PF-543 fail to selectively accumulate Sph and SphK1 at endosomal membranes and thus do not induce vacuoles. While we recognize that our current system is inherently artificial, we hope that future technologies will aid in monitoring sphingosine metabolism during dynamic processes such as endosomal trafficking.
Sph is a fusogenic lipid that can promote bilayer fusion (Castro et al., 2014; Goñi et al., 2014). Moreover, perturbation of the local membrane environment by Sph can enhance SNARE-mediated membrane fusion by the direct activation of SNARE proteins such as synaptobrevin (Darios et al., 2009). Sph also regulates the electrostatic interaction of vesicles and SNARE vesicle-associated membrane protein 2 (VAMP2) by neutralization of negatively charged membranes (Williams et al., 2009). As the core machinery for membrane fusion in neuronal and endosomal systems are highly conserved (Antonin, 2000), the identification of endosomal SNARE proteins as Sph-interactors is an exciting future direction.
Unexpectedly, catalytically inactive SphK1aG82D enhances the fusion of Lamp1-positive vacuoles induced by SK1-I or Sph to suggest that SphK1 may promote membrane fusion independent of catalytic activity. A possible explanation for this result is that SphK1aG82D binds endogenous Sph at endocytic vesicles to limit its metabolism and accumulate the fusogenic lipid. Alternatively, SphK1 may facilitate membrane fusion independent of kinase activity. SphK1 assembles dimers that contain a concave positively charged groove separating two lipid binding loop-1 (LBL-1) motifs (Adams et al., 2016). Docking of SphK1 dimers to convex negatively charged membranes orients the LBL-1 motifs to the membrane for substrate extraction with projection of the C-terminus away from the surface (Adams et al., 2016). Notably, LBL-1 is implicated in the curvature-sensitive recruitment of SphK1 to negatively charged membranes during endocytosis (Shen et al., 2014) to suggest that dimerization may regulate SphK1 recruitment to endocytic membranes. We propose that the Sph-mediated recruitment of SphK1 dimers to endosomal membranes primes membranes for fusion by acting as a membrane tether and/or recruiting endocytic factors via its C-terminus. As Sph-induced SNARE complex assembly was determined using purified synaptic vesicles, the presence of SphK1 cannot be excluded (Darios et al., 2009). Further investigation is required to test this hypothesis.
Strikingly, vacuoles do not accumulate under basal conditions in SphK1−/− MEFs. We propose that endocytic sphingolipid metabolism is tightly regulated to limit Sph accumulation and protonation during endosomal maturation leading to membrane destabilization (Goñi et al., 2014). We propose that SphK2 compensates for SphK1 to prevent the accumulation of Sph and LE fusion. While SphK1-deficient mice lack any apparent abnormalities (Mizugishi et al., 2005), SphK1/2 double knockout mice are embryonic lethal with defective vascularization and highly vacuolated endothelial cells (Mizugishi et al., 2005). Whether impaired endocytic trafficking and/or Sph accumulation contribute to this phenotype is an interesting avenue for further investigation.
Our results indicate that autophagy, ceramide synthase activity, and lysosome biogenesis aid in the clearance of dysfunctional LEs. First, SK1-I induces autophagy while dynamically modulating autophagic flux. SK1-I was observed to suppress mTORC1, a well-established negative regulator of autophagy, thus providing a potential mechanism for autophagy induction (Figure S6A). Intriguingly, mTOR associates with sphingolipid-enriched vacuoles to that sphingolipids may regulate mTOR localization (Figure S6). Moreover, sphingolipids are established regulators of autophagy (Young et al., 2013), and the recruitment of SphK1 to endosomes, autophagosomes, and amphisomes has recently been linked to autophagosome biogenesis and degradation (Moruno Manchon et al., 2015; Manchon et al., 2016). Additionally, ceramide directly interacts with LC3-II to mediate cargo recruitment to autophagosomes for efficient degradation (Sentelle et al., 2012; Dany et al., 2016). We found that inhibition of ceramide synthase by FB1 impairs autophagic flux to sustain SK1-I- and Sph-induced vacuoles (Figures 6D–G). Further dissection of sphingolipid metabolites and SphK1 in the regulation of autophagy is of great interest.
Finally, we demonstrate that lysosome biogenesis and restored autophagic flux coordinate for the clearance of the enlarged LEs induced by SK1-I. As LysoSensor-positive puncta persist in the presence of SK1-I-induced vacuoles after a few hours of treatment (Figure 3C), autophagic flux temporarily be maintained (6 h; Figure 5C). However, we hypothesize that the continued induction of autophagy (Figure 5B) and the sequestration of mTOR at vacuoles (Figure S6B) will deplete the cell of functional lysosomes by impairment of mTORC1-dependent autophagic lysosome reformation. Consequently, the activation of TFEB for lysosome biogenesis restores autophagic flux and allows for vacuole clearance by an undetermined mechanism.
Our phenotype is remarkably similar to that observed in the lysosomal storage disorder Niemann-Pick type C disease (NP-C). NP-C is a sphingosine storage disease where the lysosomal accumulation of Sph impairs calcium storage leading to secondary lipid accumulation (Lloyd-Evans et al., 2008). Similar to our phenotype, NP-C fibroblasts accumulate LEs enriched in sphingolipids and cholesterol (Sarkar et al., 2014). As SphK activity is suppressed in NP-C (Lee et al., 2014), we propose that a failure to recruit SphK to endosomal membranes may drive Sph accumulation during the pathogenesis of NP-C. Despite functional lysosomes, NP-C cells have impaired autophagic flux due to the failure to recruit autophagic SNARE machinery to LEs (Sarkar et al., 2013). Autophagy induction restores autophagic flux through the direct fusion of autophagosomes with lysosomes and has been proposed as a therapeutic strategy (Sarkar et al., 2013). Collectively, our studies implicate Sph and SphK1 in endocytic membrane trafficking and may contribute to the development of new therapeutic strategies to restore endocytic membrane trafficking in sphingolipid storage disorders.
Experimental Procedures
Isolation and immortalization of mouse embryonic fibroblasts (MEFs)
SphK1−/− mice were kindly provided by Dr. Richard Proia (NIDDK, National Institutes of Health, Bethesda, MD) (Allende et al., 2004). SphK1−/− mice were backcrossed with C57BL/6J mice, and heterozygous mice were intercrossed for MEF isolation from littermate day 12.5 embryos. MEFs were genotyped by PCR amplification of genomic DNA isolated from the embryo heads, as described previously (Allende et al., 2004). Passage two primary MEFs were immortalized by transduction with recombinant retrovirus encoding SV40 large T-antigen and selected by continuous passage.
Live cell imaging
Cells were seeded in NUNC Lab-Tek II chamber slides (ThermoScientific) and imaged in a humidified live-cell chamber equilibrated to 5% CO2 and 37°C using an Olympus IX81 deconvolution microscope equipped with SlideBook Software (Version 5.0.0.14, Intelligent Imaging Innovations, Inc.). To monitor fluid phase endocytosis, cells were treated with 0.1 mgml−1 AlexaFluor488-dextran (10 kDa; Life Technologies). To label acidic organelles, cells were incubated with LysoSensor DND-189 (1μM; Life Technologies) according to the manufacturer’s protocol. For detection of cathepsin B activity, cells were incubated with MagicRed Cathepsin B (ImmunoChemistry Technologies, LLC) per the manufacturer’s protocol.
Immunofluorescence imaging
Cells were seeded in NUNC Lab-Tek II chamber slides (Thermo Scientific), treated as indicated, and fixed with 2% paraformaldehyde in PBS. For immunostaining, cells were permeabilized with 100 ugml−1 digitonin in PBS, washed in PBS, and blocked with 5% normal goat serum prior to primary antibody incubation overnight followed by secondary antibody for at room temperature for 1 h and mounting with ProlongGold mounting medium (Invitrogen). Antibody information is provided in the Supplemental Information. Confocal images were obtained using a Leica TCS SP8 confocal microscope (Leica Microsystems, Inc.) and analyzed using Imaris 3D–4D Image Analysis Software (Bitplane USA). All other imaging was performed using an Olympus IX81 deconvolution microscope. Vacuole size (arbitrary units (AU); pixels per vacuole) was manually quantified from differential interference contrast (DIC) images using Slide Book software. Data are presented as the mean ± SEM.
Electron microscopy
Cells were seeded on Thermanox coverslips (Electron Microscopy Sciences) followed by fixation in Karnovsky’s fixative (1.5% paraformaldehyde, 3% gluteraldehyde in 0.1M phosphate buffer, pH 7.3) containing 4.2mM ethyleneglycol-bis(b-aminoethyl)-N,N,N′,N′-tetracetic acid for 30 minutes at room temperature followed by 1 h at 4°C. Cells were wash ed in 0.1M phosphate buffer and 0.1M sodium cacodylate buffer, pH 7.36 and post-fixed in 1% osmium tetroxide, 1.5% potassium ferrocyanide in 0.1M sodium cacodylate buffer for 30 minutes at 4°C. After thoroughly washing with water, cells were incubated with 1% uranium acetate at room temperature for 1.5 h followed by dehydration in a graded series of ethanol and propylene oxide. Coverslips were embedded in Embed 812 resin (Electron Microscopy Sciences), sectioned at a thickness of 70–90 nm, and mounted on mesh copper grids followed by staining with uranyl acetate and lead citrate. Images were obtained using a JEM 1400 digital capture transmission electron microscope (JEOL).
Subcellular fractionation and mass spectrometry
MEFs were treated with DMSO or 10 μM SK1-I for 4h, washed twice with ice-cold PBS, scraped in ice-cold PBS and pelleted by centrifugation (250×g, 4°C). Cell pell ets were resuspended in 0.9ml of homogenization buffer (0.25M sucrose, 140mM NaCl, 1mM EDTA, 20mM Tris-HCl, pH 8.0) containing protease and phosphatase inhibitors, passed through a 27-guage syringe and centrifuged (500×g, 4°C) to obtain pos t-nuclear supernatant (PNS). Protein concentration was determined by BCA assay and equal amounts of protein were loaded onto 7.2ml of a continuous 5–20% OptiPrep (Sigma D1556) gradient prepared in homogenization buffer. Samples were centrifuged at 90,000×g for 20 h at 4°C using a SW-41 swing rotor. Twelve fractions were collected from the top of the gradient by aspiration of the meniscus. An aliquot of each fraction was removed for immunoblot analysis and the resultant fractions were immediately mixed with ice-cold HPLC-grade methanol (1:1) and submitted to Virginia Commonwealth University Lipidomics Core Facility for liquid chromatography tandem mass spectrometry (LC-MS/MS). Data are presented as the total lipid species (pmol) per fraction. Equal volumes of each fraction were analyzed by immunoblot. Expression was quantified using Image Studio Lite (Version 5.0.21) and presented as the percent of protein enrichment in each fraction.
Mass spectrometry of cellular lipids
Cells were seeded in a 6-well plate and harvested in 500μl of ice-cold PBS containing phosphatase and protease inhibitors. A portion of the cell suspension was mixed with ice-cold HPLC-grade methanol (3:10) and submitted to Virginia Commonwealth University Lipidomics Core Facility for LC-MS/MS. The remaining cell suspension was sonicated and centrifuged prior to protein quantification by BCA assay. Data were generated from three replicates and are presented as the mean pmol per mg protein ± SD.
Western blotting
Cells were washed with ice-cold PBS and scraped in 2X RIPA buffer containing protease and phosphatase inhibitor cocktails. Nuclear protein isolation was performed using the Qiagen Qproteome Nuclear Protein Kit according to the manufacturer’s protocol with the addition of phosphatase inhibitors to all buffers. Proteins were separated by SDS-PAGE and transferred to PVDF, as described previously (Young et al., 2012). Detailed antibody information is provided in the Supplemental Information. Blots were developed by chemiluminescent substrate (Thermo Scientific) using the LI-COR C-DiGit Blot Scanner or Infrared imaging using the LI-COR Odyssey CLx. Immunoblots were quantified using Image Studio Lite (Version 5.0.21). LC3-II and p62 were normalized to β-actin, and normalized LC3-II was used for autophagic calculations, as described previously (Tooze et al., 2015). Briefly, basal autophagic flux was calculated as [(DMSO + E/P/L) – (DMSO)]; induced autophagy was calculated as [(SK1-I + E/P/L) – (DMSO + E/P/L)]; and induced autophagic flux was calculated by [(SK1-I + E/P/L) – (SK1-I)].
Statistical analysis
Data are representative of at least two independent experiments. Statistical significance was evaluated by two-tailed Student’s t-test or ANOVA with Tukey’s post-test for multiple comparison using GraphPad Prism software. Thresholds of significance are indicated in figure legends.
Supplementary Material
Highlights.
Inhibition of SphK1 impairs endocytic trafficking to enlarge late endosomes
SphK1 aids in endosomal membrane fusion independent of catalytic activity
Autophagy is induced but flux is impaired by inhibition of SphK1 with SK1-I
Restored autophagic flux and lysosome biogenesis restore endosomal trafficking
Acknowledgments
This work was funded in part by NIH Program Project Grant (P01CA171983), and Lois High Berstler Fund and Four Diamonds Fund of Penn State College of Medicine. Confocal images were generated using the Leica SP8 microscope (NIH Shared Instrumentation Grant S10OD010756-01A1) located in the Penn State Microscopy Imaging Core Facility. LC-MS/MS data were generated by the Virginia Commonwealth University Lipidomics and Metabolomics Core (NIH-NCI Cancer Center Support Grant P30 CA016059 to the VCU Massey Cancer Center; NIH Shared Instrumentation Grant S10RR031535).
Abbreviations
- Sphk1
sphingosine kinase 1
- Sph
sphingosine
- S1P
sphingosine-1-phosphate
- SK1-I
sphingosine kinase 1 inhibitor
- LE
late endosome
- MEF
mouse embryonic fibroblast
- Atg
autophagy related gene
Footnotes
Author contributions
Conceptualization, M.M.Y. and H.G.W.; Methodology, M.M.Y., Y.T., H.G.W.; Investigation, M.M.Y., T.E.F. and Y.T.; Writing-Original Draft, M.M.Y. and H.G.W.; Writing-Review & Editing, M.M.Y., J.Y., T.E.F., M.K., H.G.W.; Supervision, M.K., H.G.W.; Funding Acquisition, H.G.W.
Publisher's Disclaimer: This is a PDF file of an unedited manuscript that has been accepted for publication. As a service to our customers we are providing this early version of the manuscript. The manuscript will undergo copyediting, typesetting, and review of the resulting proof before it is published in its final citable form. Please note that during the production process errors may be discovered which could affect the content, and all legal disclaimers that apply to the journal pertain.
References
- Acharya U, Patel S, Koundakjian E, Nagashima K, Han X, Acharya JK. Modulating Sphingolipid Biosynthetic Pathway Rescues Photoreceptor Degeneration. Science. 2003;299:1740–1743. doi: 10.1126/science.1080549. [DOI] [PubMed] [Google Scholar]
- Acharya U, Mowen MB, Nagashima K, Acharya JK. Ceramidase expression facilitates membrane turnover and endocytosis of rhodopsin in photoreceptors. Proc Natl Acad Sci U S A. 2004;101:1922–1926. doi: 10.1073/pnas.0308693100. [DOI] [PMC free article] [PubMed] [Google Scholar]
- Adams DR, Pyne S, Pyne NJ. Sphingosine Kinases: Emerging Structure-Function Insights. Trends Biochem Sci. 2016;41:395–409. doi: 10.1016/j.tibs.2016.02.007. [DOI] [PubMed] [Google Scholar]
- Alexaki A, Gupta SD, Majumder S, Kono M, Tuymetova G, Harmon JM, Dunn TM, Proia RL. Autophagy regulates sphingolipid levels in the liver. J Lipid Res. 2014;55:2521–2531. doi: 10.1194/jlr.M051862. [DOI] [PMC free article] [PubMed] [Google Scholar]
- Allende ML, Sasaki T, Kawai H, Olivera A, Mi Y, van Echten-Deckert G, Hajdu R, Rosenbach M, Keohane CA, Mandala S, et al. Mice Deficient in Sphingosine Kinase 1 Are Rendered Lymphopenic by FTY720. J Biol Chem. 2004;279:52487–52492. doi: 10.1074/jbc.M406512200. [DOI] [PubMed] [Google Scholar]
- Amaya C, Fader CM, Colombo MI. Autophagy and proteins involved in vesicular trafficking. FEBS Lett. 2015;589:3343–3353. doi: 10.1016/j.febslet.2015.09.021. [DOI] [PubMed] [Google Scholar]
- Antonin W. A SNARE complex mediating fusion of late endosomes defines conserved properties of SNARE structure and function. EMBO J. 2000;19:6453–6464. doi: 10.1093/emboj/19.23.6453. [DOI] [PMC free article] [PubMed] [Google Scholar]
- van Blitterswijk WJ, van der Luit AH, Veldman RJ, Verheij M, Borst J. Ceramide: second messenger or modulator of membrane structure and dynamics? Biochem J. 2003;369:199–211. doi: 10.1042/BJ20021528. [DOI] [PMC free article] [PubMed] [Google Scholar]
- Camoletto PG, Vara H, Morando L, Connell E, Marletto FP, Giustetto M, Sassoè-Pognetto M, Van Veldhoven PP, Ledesma MD. Synaptic vesicle docking: sphingosine regulates syntaxin1 interaction with Munc18. PloS One. 2009;4:e5310. doi: 10.1371/journal.pone.0005310. [DOI] [PMC free article] [PubMed] [Google Scholar]
- Castro BM, Prieto M, Silva LC. Ceramide: a simple sphingolipid with unique biophysical properties. Prog Lipid Res. 2014;54:53–67. doi: 10.1016/j.plipres.2014.01.004. [DOI] [PubMed] [Google Scholar]
- Chan JP, Sieburth D. Localized Sphingolipid Signaling at Presynaptic Terminals Is Regulated by Calcium Influx and Promotes Recruitment of Priming Factors. J Neurosci. 2012;32:17909–17920. doi: 10.1523/JNEUROSCI.2808-12.2012. [DOI] [PMC free article] [PubMed] [Google Scholar]
- Chan JP, Hu Z, Sieburth D. Recruitment of sphingosine kinase to presynaptic terminals by a conserved muscarinic signaling pathway promotes neurotransmitter release. Genes Dev. 2012;26:1070–1085. doi: 10.1101/gad.188003.112. [DOI] [PMC free article] [PubMed] [Google Scholar]
- Dany M, Gencer S, Nganga R, Thomas RJ, Oleinik N, Baron KD, Szulc ZM, Ruvolo P, Kornblau S, Andreeff M, et al. Targeting FLT3-ITD signaling mediates ceramide-dependent mitophagy and attenuates drug resistance in AML. Blood. 2016 doi: 10.1182/blood-2016-04-708750. [DOI] [PMC free article] [PubMed] [Google Scholar]
- Darios F, Wasser C, Shakirzyanova A, Giniatullin A, Goodman K, Munoz-Bravo JL, Raingo J, Jorgačevski J, Kreft M, Zorec R, et al. Sphingosine Facilitates SNARE Complex Assembly and Activates Synaptic Vesicle Exocytosis. Neuron. 2009;62:683–694. doi: 10.1016/j.neuron.2009.04.024. [DOI] [PMC free article] [PubMed] [Google Scholar]
- Feng Y, He D, Yao Z, Klionsky DJ. The machinery of macroautophagy. Cell Res. 2014;24:24–41. doi: 10.1038/cr.2013.168. [DOI] [PMC free article] [PubMed] [Google Scholar]
- Goñi FM, Sot J, Alonso A. Biophysical properties of sphingosine, ceramides and other simple sphingolipids. Biochem Soc Trans. 2014;42:1401–1408. doi: 10.1042/BST20140159. [DOI] [PubMed] [Google Scholar]
- Hannich JT, Umebayashi K, Riezman H. Distribution and functions of sterols and sphingolipids. Cold Spring Harb Perspect Biol. 2011;3:a004762. doi: 10.1101/cshperspect.a004762. [DOI] [PMC free article] [PubMed] [Google Scholar]
- Hannun YA, Obeid LM. Principles of bioactive lipid signalling: lessons from sphingolipids. Nat Rev Mol Cell Biol. 2008;9:139–150. doi: 10.1038/nrm2329. [DOI] [PubMed] [Google Scholar]
- Höglinger D, Haberkant P, Aguilera-Romero A, Riezman H, Porter FD, Platt FM, Galione A, Schultz C. Intracellular sphingosine releases calcium from lysosomes. eLife. 2015;4:e10616. doi: 10.7554/eLife.10616. [DOI] [PMC free article] [PubMed] [Google Scholar]
- Kapitonov D, Allegood JC, Mitchell C, Hait NC, Almenara JA, Adams JK, Zipkin RE, Dent P, Kordula T, Milstien S, et al. Targeting sphingosine kinase 1 inhibits Akt signaling, induces apoptosis, and suppresses growth of human glioblastoma cells and xenografts. Cancer Res. 2009;69:6915–6923. doi: 10.1158/0008-5472.CAN-09-0664. [DOI] [PMC free article] [PubMed] [Google Scholar]
- Kim HJ, Zhong Q, Sheng ZH, Yoshimori T, Liang C, Jung JU. Beclin-1-interacting autophagy protein Atg14L targets the SNARE-associated protein Snapin to coordinate endocytic trafficking. J Cell Sci. 2012;125:4740–4750. doi: 10.1242/jcs.100339. [DOI] [PMC free article] [PubMed] [Google Scholar]
- Klionsky DJ, Abdalla FC, Abeliovich H, Abraham RT, Acevedo-Arozena A, Adeli K, Agholme L, Agnello M, Agostinis P, Aguirre-Ghiso JA, et al. Guidelines for the use and interpretation of assays for monitoring autophagy. Autophagy. 2012;8:445–544. doi: 10.4161/auto.19496. [DOI] [PMC free article] [PubMed] [Google Scholar]
- Lamb CA, Dooley HC, Tooze SA. Endocytosis and autophagy: Shared machinery for degradation. BioEssays News Rev Mol Cell Dev Biol. 2013;35:34–45. doi: 10.1002/bies.201200130. [DOI] [PubMed] [Google Scholar]
- Lee H, Lee JK, Park MH, Hong YR, Marti HH, Kim H, Okada Y, Otsu M, Seo EJ, Park JH, et al. Pathological roles of the VEGF/SphK pathway in Niemann–Pick type C neurons. Nat Commun. 2014;5:5514. doi: 10.1038/ncomms6514. [DOI] [PMC free article] [PubMed] [Google Scholar]
- Liang C, Lee J, Inn KS, Gack MU, Li Q, Roberts EA, Vergne I, Deretic V, Feng P, Akazawa C, et al. Beclin1-binding UVRAG targets the class C Vps complex to coordinate autophagosome maturation and endocytic trafficking. Nat Cell Biol. 2008;10:776–787. doi: 10.1038/ncb1740. [DOI] [PMC free article] [PubMed] [Google Scholar]
- Lloyd-Evans E, Morgan AJ, He X, Smith DA, Elliot-Smith E, Sillence DJ, Churchill GC, Schuchman EH, Galione A, Platt FM. Niemann-Pick disease type C1 is a sphingosine storage disease that causes deregulation of lysosomal calcium. Nat Med. 2008;14:1247–1255. doi: 10.1038/nm.1876. [DOI] [PubMed] [Google Scholar]
- Manchon JFM, Uzor NE, Finkbeiner S, Tsvetkov AS. SPHK1/sphingosine kinase 1-mediated autophagy differs between neurons and SH-SY5Y neuroblastoma cells. Autophagy. 2016;12:1418–1424. doi: 10.1080/15548627.2016.1183082. [DOI] [PMC free article] [PubMed] [Google Scholar]
- Mizugishi K, Yamashita T, Olivera A, Miller GF, Spiegel S, Proia RL. Essential Role for Sphingosine Kinases in Neural and Vascular Development. Mol Cell Biol. 2005;25:11113–11121. doi: 10.1128/MCB.25.24.11113-11121.2005. [DOI] [PMC free article] [PubMed] [Google Scholar]
- Moruno Manchon JF, Uzor NE, Dabaghian Y, Furr-Stimming EE, Finkbeiner S, Tsvetkov AS. Cytoplasmic sphingosine-1-phosphate pathway modulates neuronal autophagy. Sci Rep. 2015;5:15213. doi: 10.1038/srep15213. [DOI] [PMC free article] [PubMed] [Google Scholar]
- Murrow L, Malhotra R, Debnath J. ATG12-ATG3 interacts with Alix to promote basal autophagic flux and late endosome function. Nat Cell Biol. 2015;17:300–310. doi: 10.1038/ncb3112. [DOI] [PMC free article] [PubMed] [Google Scholar]
- Paugh SW, Paugh BS, Rahmani M, Kapitonov D, Almenara JA, Kordula T, Milstien S, Adams JK, Zipkin RE, Grant S, et al. A selective sphingosine kinase 1 inhibitor integrates multiple molecular therapeutic targets in human leukemia. Blood. 2008;112:1382–1391. doi: 10.1182/blood-2008-02-138958. [DOI] [PMC free article] [PubMed] [Google Scholar]
- Peng J, Zhang R, Cui Y, Liu H, Zhao X, Huang L, Hu M, Yuan X, Ma B, Ma X, et al. Atg5 regulates late endosome and lysosome biogenesis. Sci China Life Sci. 2014;57:59–68. doi: 10.1007/s11427-013-4588-8. [DOI] [PubMed] [Google Scholar]
- Razi M, Chan EYW, Tooze SA. Early endosomes and endosomal coatomer are required for autophagy. J Cell Biol. 2009;185:305–321. doi: 10.1083/jcb.200810098. [DOI] [PMC free article] [PubMed] [Google Scholar]
- Rohrbough J, Rushton E, Palanker L, Woodruff E, Matthies HJG, Acharya U, Acharya JK, Broadie K. Ceramidase regulates synaptic vesicle exocytosis and trafficking. J Neurosci Off J Soc Neurosci. 2004;24:7789–7803. doi: 10.1523/JNEUROSCI.1146-04.2004. [DOI] [PMC free article] [PubMed] [Google Scholar]
- Ruck A, Attonito J, Garces KT, Nuñez L, Palmisano NJ, Rubel Z, Bai Z, Nguyen KCQ, Sun L, Grant BD, et al. The Atg6/Vps30/Beclin 1 ortholog BEC-1 mediates endocytic retrograde transport in addition to autophagy in C. elegans. Autophagy. 2011;7:386–400. doi: 10.4161/auto.7.4.14391. [DOI] [PMC free article] [PubMed] [Google Scholar]
- Sarkar S, Carroll B, Buganim Y, Maetzel D, Ng AHM, Cassady JP, Cohen MA, Chakraborty S, Wang H, Spooner E, et al. Impaired autophagy in the lipid-storage disorder Niemann-Pick type C1 disease. Cell Rep. 2013;5:1302–1315. doi: 10.1016/j.celrep.2013.10.042. [DOI] [PMC free article] [PubMed] [Google Scholar]
- Sarkar S, Maetzel D, Korolchuk VI, Jaenisch R. Restarting stalled autophagy a potential therapeutic approach for the lipid storage disorder, Niemann-Pick type C1 disease. Autophagy. 2014;10:1137–1140. doi: 10.4161/auto.28623. [DOI] [PMC free article] [PubMed] [Google Scholar]
- Sentelle RD, Senkal CE, Jiang W, Ponnusamy S, Gencer S, Panneer Selvam S, Ramshesh VK, Peterson YK, Lemasters JJ, Szulc ZM, et al. Ceramide targets autophagosomes to mitochondria and induces lethal mitophagy. Nat Chem Biol. 2012;8:831–838. doi: 10.1038/nchembio.1059. [DOI] [PMC free article] [PubMed] [Google Scholar]
- Settembre C, Medina DL. Chapter 3 - TFEB and the CLEAR network. In: FP, Platt N, editors. Methods in Cell Biology. Academic Press; San Diego, CA: 2015. pp. 45–62. [DOI] [PubMed] [Google Scholar]
- Shen H, Giordano F, Wu Y, Chan J, Zhu C, Milosevic I, Wu X, Yao K, Chen B, Baumgart T, et al. Coupling between endocytosis and sphingosine kinase 1 recruitment. Nat Cell Biol. 2014;16:652–662. doi: 10.1038/ncb2987. [DOI] [PMC free article] [PubMed] [Google Scholar]
- Tooze SA, Dooley HC, Jefferies HBJ, Joachim J, Judith D, Lamb CA, Razi M, Wirth M. Assessing mammalian autophagy. Methods Mol Biol. 2015;1270:155–165. doi: 10.1007/978-1-4939-2309-0_12. [DOI] [PubMed] [Google Scholar]
- Williams D, Vicôgne J, Zaitseva I, McLaughlin S, Pessin JE. Evidence that electrostatic interactions between vesicle-associated membrane protein 2 and acidic phospholipids may modulate the fusion of transport vesicles with the plasma membrane. Mol Biol Cell. 2009;20:4910–4919. doi: 10.1091/mbc.E09-04-0284. [DOI] [PMC free article] [PubMed] [Google Scholar]
- Yonamine I, Bamba T, Nirala NK, Jesmin N, Kosakowska-Cholody T, Nagashima K, Fukusaki E, Acharya JK, Acharya U. Sphingosine kinases and their metabolites modulate endolysosomal trafficking in photoreceptors. J Cell Biol. 2011;192:557–567. doi: 10.1083/jcb.201004098. [DOI] [PMC free article] [PubMed] [Google Scholar]
- Young MM, Takahashi Y, Khan O, Park S, Hori T, Yun J, Sharma AK, Amin S, Hu CD, Zhang J, et al. Autophagosomal membrane serves as platform for intracellular death-inducing signaling complex (iDISC)-mediated caspase-8 activation and apoptosis. J Biol Chem. 2012;287:12455–12468. doi: 10.1074/jbc.M111.309104. [DOI] [PMC free article] [PubMed] [Google Scholar]
- Young MM, Kester M, Wang HG. Sphingolipids: regulators of crosstalk between apoptosis and autophagy. J Lipid Res. 2013;54:5–19. doi: 10.1194/jlr.R031278. [DOI] [PMC free article] [PubMed] [Google Scholar]
- Yu L, McPhee CK, Zheng L, Mardones GA, Rong Y, Peng J, Mi N, Zhao Y, Liu Z, Wan F, et al. Termination of autophagy and reformation of lysosomes regulated by mTOR. Nature. 2010;465:942–946. doi: 10.1038/nature09076. [DOI] [PMC free article] [PubMed] [Google Scholar]
Associated Data
This section collects any data citations, data availability statements, or supplementary materials included in this article.