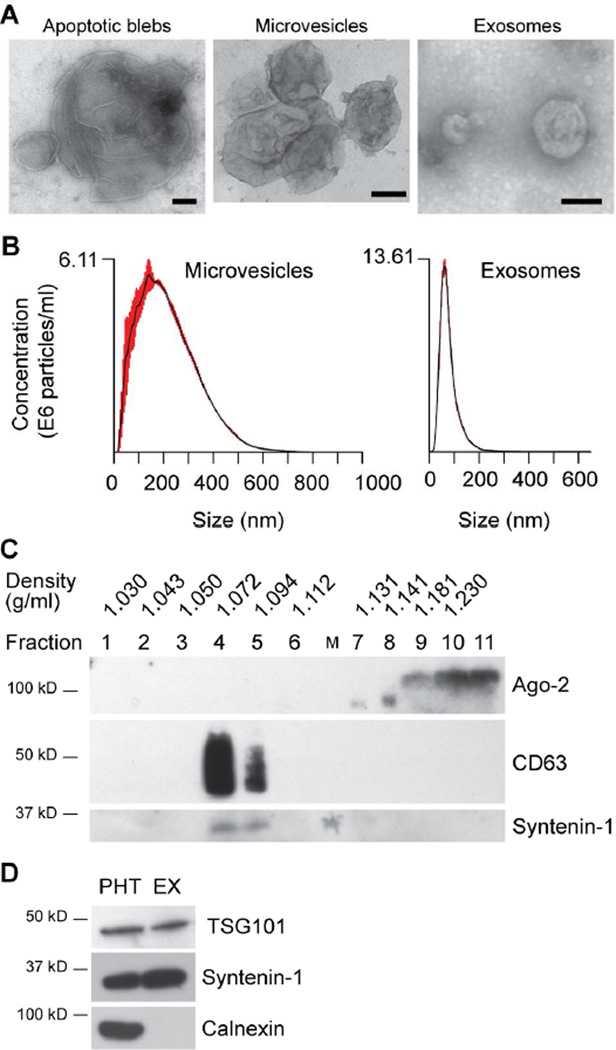
Fig. 2. Characterization of trophoblastic EVs derived from PHT CM.
(A) A western blotting analysis of key exosomal proteins. Trophoblastic EXs were mainly recovered in the three fractions (see Methods for details), which were immuno-reactive to CD63 and syntenin-1. In contrast, Ago2 protein was only present at the bottom fractions, but absent in the fractions corresponding to trophoblastic EXs. (B) Analysis of trophoblastic EVs using NTA. Note that the X-axis indicates the particle size distribution, and the Y-axis denotes particle concentration. (C) Electron microscopy (EM) images of trophoblastic EVs. EM scale bar: 100 nm. (D) A western blotting analysis of exosomal proteins TSG101 and syntenin-1, compared to PHT cells. Calnexin is a marker of endoplasmic reticulum membranes. An equal amount of total proteins in PHT cells and PHT-derived exosomes were loaded. All the isolation and characterization experiments were performed at least three times.

