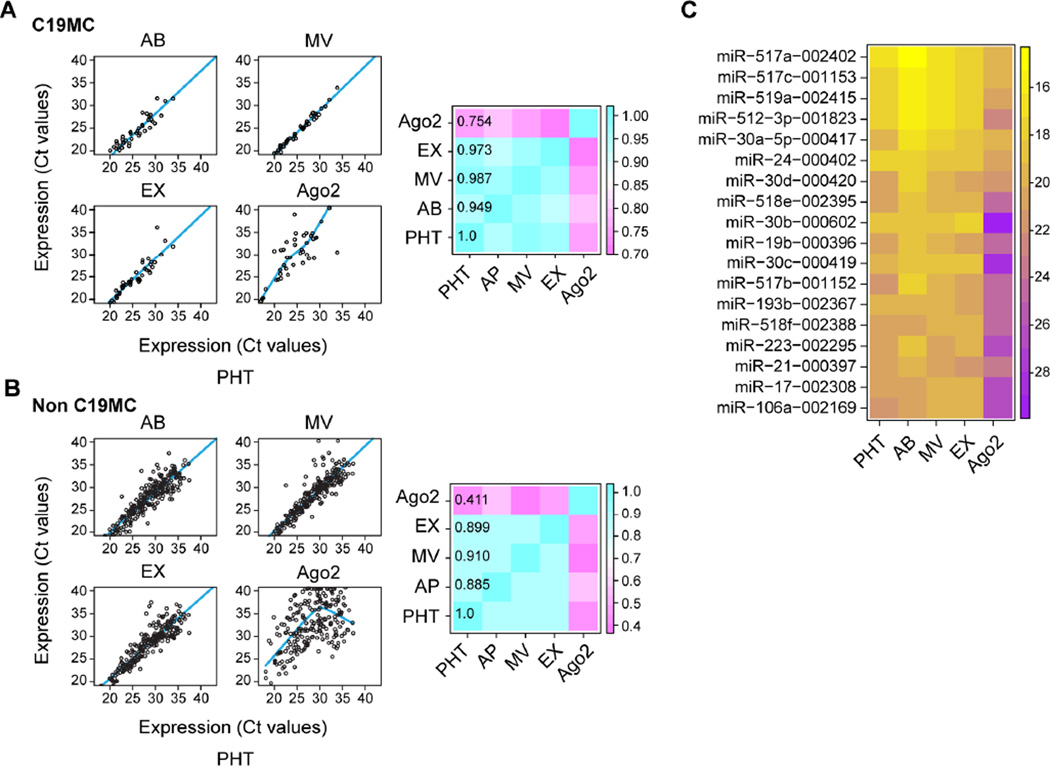
Fig. 4. The miRNA landscape of trophoblastic EVs and extracellular Ago2.
(A–B) Scatter plots of C19MC (A) and non-C19MC (B) miRNA profiles, comparing miRNA in each of the EVs and the Ago-2 bound fraction to the miRNA landscape of PHT cells. The heatmap depicts the correlation matrix of miRNA profiles, including three trophoblastic EVs, extracellular Ago2 population, and parental PHT cells. The regression lines for AP, Exo, and MV were generated by ordinary least square linear regression and by locally weighed scatterplot smoothing (LOWESS) for Ago2. (C) Heatmap of the top 20 miRNAs, ascending by the mean Ct values of PHT cells, ABs, MVs, EXs, and extracellular Ago2 population. Trophoblastic EVs and Ago2 population were isolated from three independent PHT cells. Statistical significance was analyzed as described in Methods.

