Abstract
Brain activation studies in humans have shown the dynamic nature of neuronal N-acetylaspartate (NAA) and N-acetylaspartylglutamate (NAAG) based on changes in their magnetic resonance spectroscopy (MRS) signals in response to stimulation. These studies demonstrated that upon visual stimulation there was a focal increase in cerebral blood flow (CBF) and a decrease in NAA, or in the total of NAA and NAAG signals in the visual cortex, and that these changes were reversed upon cessation of stimulation. In the present study we have developed an animal model in order to explore the relationships between brain stimulation, neuronal activity, CBF and NAA. We use “Designer Receptors Exclusively Activated by Designer Drugs” (DREADDs) technology for site-specific neural activation, a local field potential electrophysiological method for measurement of changes in the rate of neuronal activity, functional MRS for measurement of changes in NAA, and a blood oxygenation level-dependent (BOLD) MR technique for evaluating changes in CBF. We show that stimulation of the rat prefrontal cortex using DREADDs results in (a) an increase in level of neuronal activity, (b) an increase in BOLD and (c) decrease in the NAA signal. These findings show for the first time the tightly coupled relationships between stimulation, neuron activity, CBF and NAA dynamics in brain, and also provide the first demonstration of the novel inverse stimulation-NAA phenomenon in an animal model.
Keywords: depolarization, cerebral blood flow, designer drug, genetic engineering, local field potential, N-acetylaspartate, N-acetylaspartylglutamate
GRAPHICAL ABSTRACT
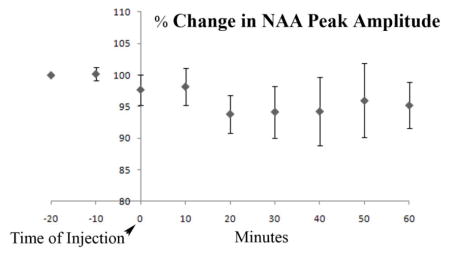
Using the chemogenetic approach known as designer receptor exclusively activated by designer drugs for stimulation of neuronal activity in a rat model, we have demonstrated an inverse relationship between N-acetylaspartate (NAA) content and stimulation previously observed in humans. We do this using Magnetic Resonance spectroscopy and imaging. Changes in neuronal activity were also verified with electrophysiological measures. The figure below shows the changes in NAA peak amplitude from the chemogenetic modulation.
INTRODUCTION
Metabolism and physiology of N-acetylaspartate and N-acetylaspartylglutamate
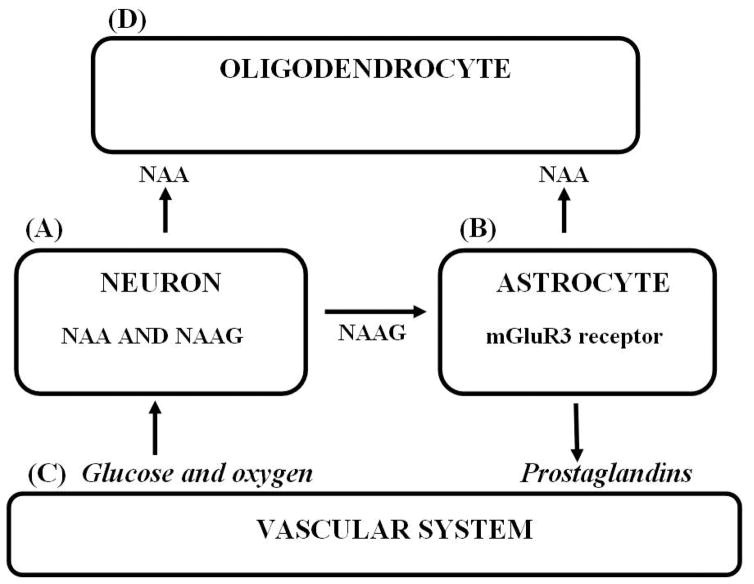
N-acetylaspartate (NAA) and N-acetylaspartylglutamate (NAAG) are among the highest concentration amino acids and dipeptides, respectively, present in brain and are primarily found in neurons. NAA is synthesized by neurons from L-aspartate (Asp) and acetyl Co-enzyme A (AcCoA) by NAA synthase (1) where glucose (Glc) is the source of the acetate (Ac) in AcCoA. NAA is the only known precursor of NAAG, synthesized from NAA and glutamate (Glu) in neurons by NAAG synthase (2). Most neurons in brain synthesize NAA and NAAG and store large quantities of both substances. However, most neurons cannot catabolize either of these substances. For their metabolism, they are exported to extracellular fluid (ECF) (3). NAA is targeted to oligodendrocytes where it is hydrolyzed by aspartoacylase (ASPA) (4) liberating Ac and Asp, and NAAG is targeted to the metabotropic Glu receptor 3 (mGluR3) on the astrocyte surface where the Glu moiety of NAAG is cleaved by NAAG peptidase (5). Glu can activate astrocytes to release secondary messengers that signal the vascular system to increase focal blood flow. NAAG is clearly a neurotransmitter, but the role of NAA and its release to ECF is as yet unresolved. Both NAA and NAAG are relatively inert carriers of the excitatory amino acids Asp and Glu and appear to represent a novel “key-lock” mechanism used by neurons for delivery of these potentially excitotoxic substances via ECF to their target glial cells where these amino acid “keys” can then be safely released by their substance-specific enzymes (6). NAA is also a product of astrocyte NAAG hydrolysis, but since astrocytes do not express ASPA, most of the NAA formed is likely liberated to ECF and then hydrolyzed by oligodendrocyte ASPA. The unique tri-cellular compartmentalized metabolism of NAA and NAAG in brain with two synthetic and two hydrolytic enzymes distributed between three cell types, and the mGluR3-NAAG peptidase-Glu trigger mechanism on the astrocyte surface that can initiate their sending second messengers to the vascular system has been called the “operating system” of the brain. This is because inborn errors in this system in humans have been observed to lead to profoundly abnormal brain function (3). This unique tri-cellular metabolism is depicted in figure 1.
Figure 1. The tri-cellular metabolism of NAA and NAAG.
(A) NAA and NAAG are synthesized by neurons. (B) NAAG is released to ECF where it docks with the mGluR3 receptor on the astrocyte surface and Glu is cleaved by NAAG peptidase. (C) Glu activated astrocytes release second messengers that increase arteriole diameter and increase focal blood flow. (D) NAA released to ECF directly from neurons, or as a product of NAAG catabolism is taken up and hydrolyzed by oligodendrocyte ASPA.
Mechanism of neuronal release of NAA and NAAG to ECF is by membrane depolarization
Both NAA and NAAG are released to ECF upon neuron depolarization. This has been observed for NAA in rat microdialysis studies where neurons were depolarized by K+ (7, 8) and for NAA and NAAG in a rat brain slice superfusion study where depolarization was by electrical stimulation at 15 Hz, 20mA for 3 min and NAA and NAAG were observed to be released at the same relative percentage rate (9). In this latter study it was also shown that the stimulation-induced release of both NAA and NAAG was blocked by tetrodotoxin, a voltage dependent Na+ channel blocker that inhibits neuron depolarization. The neuron membrane ATP-binding cassette subfamily C, member 5 has recently been reported to be an ATP-dependent efflux transporter for both NAA and NAAG into ECF by a non-synaptic mechanism (10). There is also evidence that Li+, an ion that can replace Na+, blocks the efflux of NAA and NAAG from neurons (11).
An inverse relationship between brain stimulation and NAA or tNAA in human brain
In a number of functional magnetic resonance spectroscopy (fMRS) studies in the normal human visual system it has been observed that NAA or the total of NAA and NAAG (tNAA) are reduced in the visual cortex by up to 21 % upon continuous visual stimulation over a period of about 10 min, and to recover in a subsequent 10 min rest period when compared to a baseline period. Sarchielli et al. (12) reported about a 12% decline in tNAA signal. Baslow et al. (13) found about a 20% decline in NAA signal. Castellano et al. (14) reported a 20 % decline in the NAA signal and a 200% rise in the NAAG signal, and Landim et al. (15) reported a 21% decline in the NAA signal and a 64% rise in the NAAG signal. These authors also suggest that in some cases where tNAA is measured, the increase in NAAG could offset and obscure the reduction in the NAA signal. This confounding factor may explain why in some studies where tNAA is measured, an inverse relationship between the NAA signal and stimulation is not observed. The changes in NAA signal have been observed to occur in a relatively short period of time in response to continuous stimulation. Therefore, a second confounding factor in observing this relationship in some studies may be due to the use of a protocol that intersperses very short periods of no stimulation with stimulation, or at the other extreme using very long periods of continuous stimulation. In a related human study using continuous 5-Hz transcranial magnetic stimulation for 7.83 min, tNAA subsequently measured by MRS after an additional 11–14 min period was found to be decreased in the human motor cortex by about 4% (16). This novel and unanticipated phenomenon of a large transient decrease in the NAA or tNAA MRS signal upon stimulation is now well documented in human brain, but has not yet been demonstrated in an animal model.
A missing link in the stimulation process; demonstration of an increase in neuronal activity that precedes the observed increase in BOLD and decrease in NAA
None of the human studies cited offered any direct evidence of the association of the stimulus used with an increase in neuronal activity or rate of depolarization. In these cases, focal areas of brain stimulation were tentatively identified using an MR blood oxygenation-level dependent (BOLD) technique that measures changes in the MR signal as a function of the content of paramagnetic deoxyhemoglobin in blood. The amount of deoxyhemoglobin in blood can be influenced by the rate of focal tissue oxygen use and by the rate of changes in focal cerebral blood flow (CBF). In all of these studies it was assumed that the increase in BOLD was a proxy for an increase in neuronal activity. In the present study we attempt to resolve this issue by exploring the relationships between brain stimulation, neuronal activity, BOLD and NAA dynamics. We do this in rat brain in-vivo using adeno-associated virus (AAV)-mediated expression of “Designer Receptor Exclusively Activated by Designer Drugs” (DREADDs), which are modified acetylcholine receptors for site-specific stimulation (17). Using a within animal design across multiple days, we used local field potential (LFP) electrophysiological recordings in the DREADDs infection site for direct measurement of changes in neuronal activity, BOLD for evaluating changes in the relative content of deoxyhemoglobin and fMRS for measurement of changes in NAA.
METHODS AND MATERIALS
DREADDs technique and method of defining the ROI
DREADDs technology (18, 19) offers many improvements over other techniques for controlling neural activity. After injection of AAV to express the modified receptor in neurons (synapsin promoter), the site is physically marked by needle tracks, and stimulation by the biologically inert drug clozapine-N-oxide (CNO) is site-specific, allowing for preselection of a repeatable region of interest (ROI). Also, since the site does not rely on any external sensory system for activation and the response is robust and prolonged, it can be observed under conditions of deep anesthesia that would inhibit input from most external senses. Anesthesia, while blocking input from most external sources, still allows interaction with brain function in several ways, notably by direct cortical stimulation or by chemical challenges. In a recent study (20) it was shown that coherent BOLD resting state signals are preserved in anaesthetized monkeys demonstrating that functional connectivity architecture is maintained even under deep levels of anesthesia. The modified acetylcholine receptor is incorporated in the rat model using an AAV vector encoding the Gq-coupled hM3Dq fragment. Further, DREADDs expression can be verified and the ROI precisely defined post-mortem via immunohistochemistry.
Animals
Virally-mediated DREADDs technology was used to excite neurons in the medial prefrontal cortex (mPFC) of 8 adult Sprague-Dawley rats. DREADDs virus [AAV(8)-hSyn-hM3Dq-mCherry] was provided by Dr. Roth via the University of North CarolinaVector Core (21). AAV encoding hM3Dq (excitatory) DREADDs was infused (0.5 μl) via bilateral stereotactic injections into mPFC [coordinates relative to Bregma in millimeters: 3.1 anterior, +0.7 lateral, 5.3 ventral (injection 1); 3.1 anterior, −0.7 lateral, 5.3 ventral (injection2)] in anesthetized rats to allow for selective activation of neurons by systemic CNO delivery with a dosage of 2mg/kg (s.c., 2 ml/kg volume). Six weeks were allowed for surgery recovery and receptor expression before the start of the MR experiments. All animal procedures were performed following the National Institutes of Health guidelines with approval from the Institutional Animal Care and Use Committee and the Institutional Biosafety Committee at the Nathan S. Kline Institute for Psychiatric Research.
MR Protocols
All animals were anesthetized using an isoflurane vaporizer set at the following percentages: 3% for induction, 2% during pilot scanning and 1.5% during data acquisition. An animal monitoring unit (model 1025, SA Instruments, Stony Brook, NY, USA) was used to record respiration and rectal temperature. Respiration was measured with a pressure transducer placed under the abdomen just below the ribcage. Body temperature was maintained using forced warm air, controlled by a feedback circuit between the heater and thermistor. After induction, the animals were placed on a holder and restrained using a bite bar and ear bars placed half way into the auditory canal. Oxygen was used as the carrier gas and delivered at a low flow rate (≤0.5 L/min) to a cone positioned before the bite bar, where gases mixed with air and passed over the rodent’s nose. All animals were maintained at 37.0 ± 0.2 °C. All data were obtained on a 7.0 T Agilent (Santa Clara, CA, USA) 40 cm bore system. The gradient coil insert had an internal diameter of 12 cm with a maximum gradient strength of 600 mT/m and minimum rise time of 200 μs, with customized second and third order shim coils. A Rapid (Rimpar, Germany) volume transmit coil (72mm ID) and a four-channel receive-only surface coil was used for RF transmission and reception, respectively.
MR Spectroscopy
The spectral acquisition consisted of a short echo time Point Resolved Spectroscopy (PRESS) (22) sequence with the following parameters: repetition time 4 s, echo time 7.5 ms (4.5 ms delay from center of excitation to first spin echo and 3 ms from first spin echo to double spin echo), number of averages 150 (10 min acquisition), number of points 2048, and bandwidth of acquisition 5 kHz, repeated 9 times. The CNO activation drug was delivered via subcutaneous injection after 20 minutes of baseline acquisition. The subcutaneous route was chosen because others reported success with this method (23) and because this was the simplest way to administer drug systemically through tubing attached to a needle inserted into an exposed area of the rat’s back. The shim settings for the selected voxel of interest were automatically adjusted using FASTMAP, Automatic Shimming Technique by Mapping Along Projections (24), a high-order shim method, which samples the magnetic field along a group of radial columns that focus on the center of a localized voxel. Water suppression was achieved by using Variable Power RF pulses with optimized relaxation delays (25). Outer volume suppression was also used. The voxel of interest size was 15.625 μl (2.5 × 2.5 × 2.5 mm3) placed in the mPFC at the base of the injection site. A coronal anatomical pilot scan was used to position the voxel of interest. These scans were acquired with a gradient echo sequence with the following parameters: field of view 38.4 mm 256 matrix size, 0.5 mm slice thickness, echo time 18 ms, repetition time 1 s and flip angle 60°.
BOLD Imaging
This image acquisition consisted of an interleaved snapshot Echo Planar Imaging (EPI) module. This approach splits the conventional EPI sequence into a series of excitation–acquisition blocks applied in immediate succession within a single repetition period. The full details of this acquisition strategy have been described previously (26). There are virtually no delays between the acquisition segments, so there is almost no loss of temporal resolution in comparison with conventional EPI. The susceptibility distortions are minimized owing to shorter sampling intervals after each excitation, in much the same way as parallel acquisitions methods. There are four key elements: (1) variable flip angles , s=0, 1, 2, …, n−1 are used to equalize the transverse magnetization among all n segments. (2) Polarity of the read gradient is reversed between the segments to preserve the k-space structure of a traditional EPI in the dataset combined from all interleaved segments. (3) Onset of acquisition in a segment s is delayed by (s/n) TRL, where TRL = readout length, to ensure smooth T*2 decay over the k-space data set, free of a step-wise modulation and the associated ghosting in the reconstructed image. (4) There are no other delays between the acquisition blocks to avoid any loss of temporal resolution in comparison with the conventional EPI. The parameters used were: FOV= 40 mm (64×64 matrix), number of segments = 3, echo time = 20 ms, repetition time = 2 s, 0.5mm slice thickness and 6 slices.
Spectral Analysis
All data were processed using the LCModel software developed by Provencher (27). This software calculates the best fit to the acquired data of linear combination of model spectra acquired from in vitro solutions. The model spectra consist of all the metabolites of interest. This basis set was used for the fitting of the field strength, sequence, and echo time. The metabolites measured were: alanine, aspartate, creatine, phosphocreatine, GABA, glucose, glutamine, glutamate, glutathione, glycerophosphocholine, phosphocholine, myo-inositol, lactate, NAA, NAAG, sycllo-inositol and taurine. An unsuppressed water signal was used for absolute concentration calculation. This has several advantages in that it is straightforward to implement, the water suppression option is simply turned off, and it also eliminates several sources of error such as voxel size and relaxation effects. The method assumes known values of water concentrations of gray and white matter. The unsuppressed water signal was also used for eddy current compensation. In order to minimize interference from the NAAG signal, in the present study we also used a peak amplitude method, independent of the LCModel computed values, to measure changes in the NAA level as was done previously in a human study (13).
Electrophysiological measures
The electrophysiological data used for verification of neuronal activity were acquired for all rats in this study, the full details of which are described in a previously published study (28). Briefly, animals were anesthetized with isoflurane to match conditions in the imaging studies (3–5% for induction, 2–3% for data collection), and a recording electrode was lowered into the mPFC while rats were maintained on a heating pad for the duration of recordings. A tungsten microelectrode was implanted into the mPFC for recording of spontaneous local field potentials (LFP), which were amplified (200×), band-pass filtered (0.5–300 Hz) and digitized (10 kHz) for analysis by Spike2 software (Cambridge Electronic Design). LFP activity before and after CNO injection was analyzed with Fast Fourier Transform (FFT) analyses (2.4Hz bins) to quantify changes in power (μV2) relative to pre-CNO baseline.
RESULTS
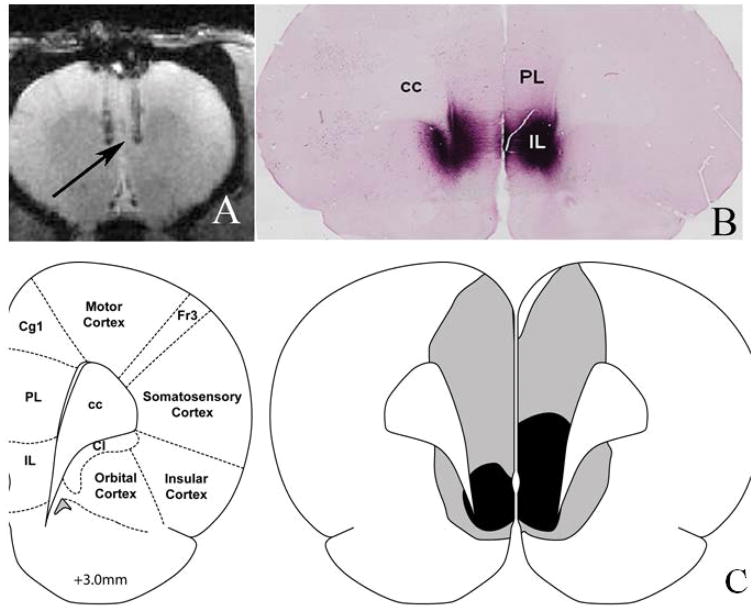
A total of 8 animals were used in this study. Figure 2(A) shows the injection site of the virus. This is a single slice from a gradient echo anatomical acquisition described in the methods sections. Two needle tracks can be seen with the tip of the injection placed in the mPFC (indicated by the arrow). Figure 2(B) shows immunohistological staining for mCherry demonstrating the typical extent of the viral infection and DREADDs/mCherry expression. The CNO was delivered by subcutaneous injection at a dosage of 2mg per Kg of weight mixed in a solution of 5% dimethyl sulfoxide (DMSO)/95% saline, which is often used as a solvent in chemogenetic experiments. Figure 2(C) shows a schematic of the coronal brain slice at approximately +3mm relative to Bregma. Grey indicates maximum acceptable DREADDs expression and black shading indicates minimal acceptable DREADDs staining. In this study 50% of the animals showed poor or misplaced DREADDs expression, as revealed by immunohistological staining, and were eliminated from the final analysis.
Figure 2. DREADDs expression and delineation of the mPFC ROI.
(A) Anatomical image showing the sites of the injection tracks, with the tip of the injection illustrated with the black arrow. (B) Immunohistological staining for mCherry showing the typical extent of the viral infection and DREADDs/mCherry expression. (C) Schematic of coronal brain slice at approximately +3mm relative to Bregma. Grey/black shading indicates maximum/minimum acceptable DREADDs expression in the ROI. Abbreviations: cc: corpus callosum, PL: prelimbic prefrontal cortex, IL: infralimbic prefrontal cortex, Cg1: cingulated cortex area 1, Fr3: frontal cortex Area 3, Cl: claustrum. Panel 2(C) adapted from Paxinos and Watson (38) with permission from Elsevier.
Spectra of CNO and DMSO
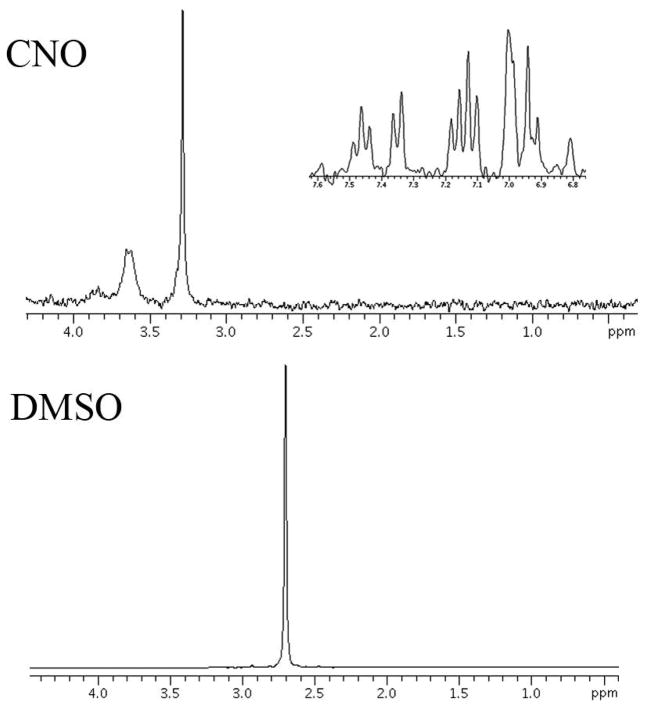
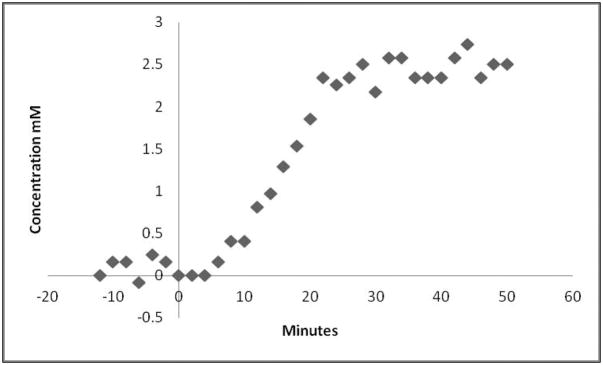
The LCModel software of the resulting spectra showed a rogue peak at 2.7 ppm, which could not be assigned because the software had no reference spectra for this peak. This unknown resonance was either from CNO or DMSO. Figure 3 shows the spectra of both of these substances. For convenience The CNO spectra is split in two to show the resonances in the 6–8 ppm range and the 1–4 ppm range. DMSO has a strong singlet at 2.7 ppm. For correct fitting of spectral data a reference DMSO spectra was included in the basis set and could then be used to quantify the concentration of DMSO. DMSO crosses the blood brain barrier and can diffuse through cellular membranes (29). A previous study also reported a strong resonance seen at 2.7 ppm and suggested the use of DMSO as a potential contrast agent for brain tumors (30). This solvent is very efficient as a delivery mechanism for CNO, however care must be taken in the spectral analysis to avoid inaccurate results in the metabolites of interest. This is particularly true for NAAG which has a CH2 resonance at 2.72 ppm (31). If the spectra are not corrected for DMSO a strong increase in NAAG concentration is noted because the LCModel software incorrectly assigns the unknown DMSO peak to NAAG. Once corrected for DMSO, we used the increase in the DMSO peak to plot the uptake of CNO. Figure 4 shows the increase in concentration of DMSO from a voxel placed in mPFC in a DREADDs expressing rat injected with the mixture of CNO and DMSO after 14 minutes of baseline acquisition. This concentration is calculated using the resonance area of the unsuppressed water and no correction for cerebral spinal fluid was used. The voxel size was 27 mm3 to allow a relatively high temporal resolution of 2 minutes, to characterize this uptake.
Figure 3. Proton spectra of clozapine-N-oxide (CNO) and dimethyl sulfoxide (DMSO).
DMSO has a strong resonance at 2.7 ppm from a CH3 group which is also observed in the in vivo data.
Figure 4. Change in brain concentration of DMSO with time measured by proton spectroscopy.
After a 14 minute baseline, CNO dissolved in 5% DMSO was injected subcutaneously and proton spectra were recorded for an additional 50 minutes. The temporal resolution was 2 minutes from a 27 μl voxel placed in the mPFC. Each point represents the concentration of DMSO measured by the LCModel software using a modified basis set.
BOLD Response
Figure 5(A) shows the BOLD response from a single rodent which showed the largest DREADDs expression. The response from the ROI placed at the base of the injection site shows approximately a 6–7% increase in BOLD signal, achieving maximum signal change approximately 20 minutes after the CNO injection. The ROI placed in the cortical region away from the mPFC exhibits a constant BOLD signal. The average BOLD change from all the animals in this study was 3 %. The DMSO uptake from the spectroscopy measures of the same animal is overlaid on the BOLD response, shown in figure 5(C). This uptake exhibits the same rate of change as the BOLD response which would imply that the DMSO can be used as a reliable proxy for CNO uptake.
Figure 5. BOLD signal increase in the mPFC ROI after CNO injection.
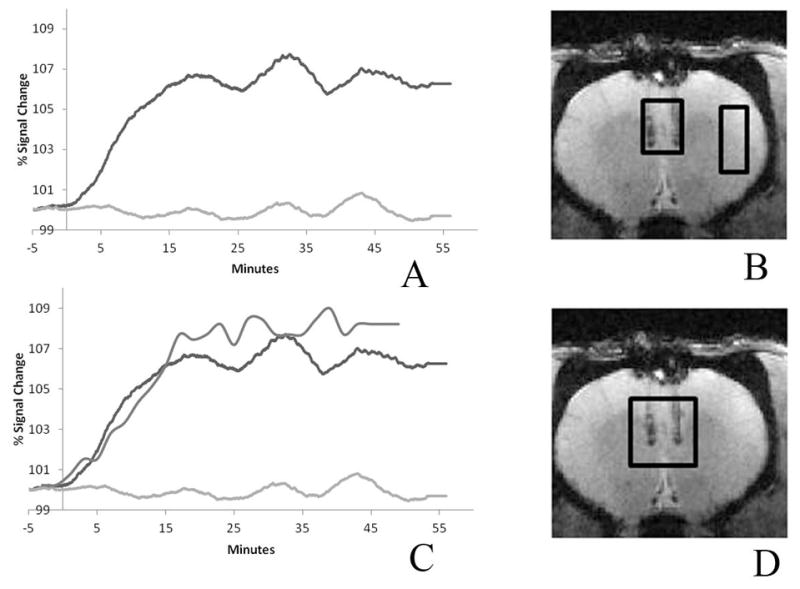
(A) Subcutaneous CNO (2mg/kg) caused a BOLD increase (~7% compared to baseline) that peaked 20 minutes post-injection and persisted for at least 1 hour. The ROI is placed at the base of the injection track where DREADDs expression is highest. The control ROI in a cortical region away from the injection site, which did not express DREADDs, showed minimal change (less than 0.2% increase compared to baseline). The two ROI’s are depicted on the anatomical image. (B) The DMSO uptake is overlaid on the BOLD responses showed in (C). The ROI for the DMSO plot is shown in the anatomical image (D). The mPFC DMSO uptake rate and the BOLD response are seen to parallel one another.
NAA measures with proton spectroscopy
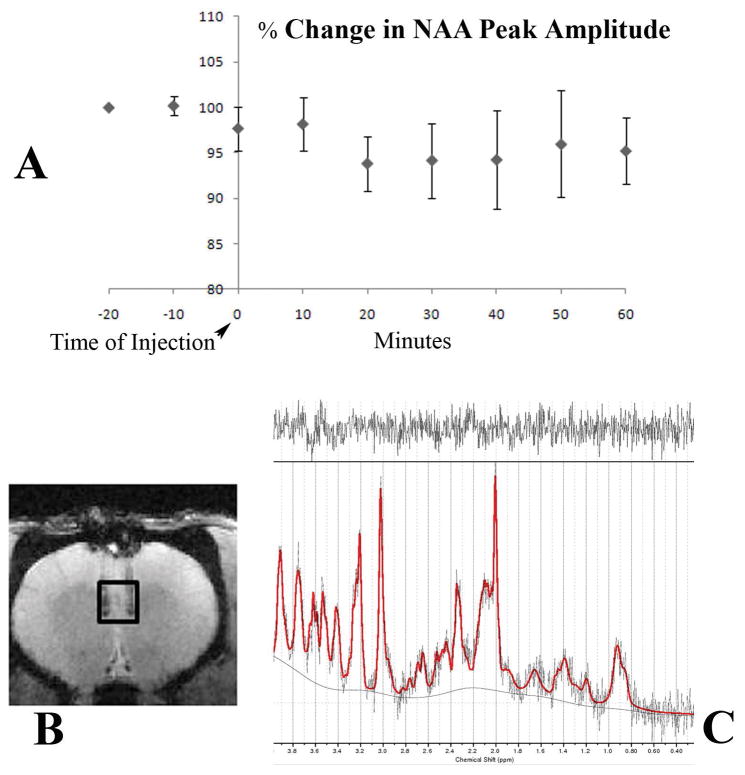
Figure 6(A) shows the average response of the peak amplitude of NAA, corrected for the average BOLD response from all the animals used in this study. The VOI (15.625 μl) is depicted on the anatomical image shown in figure 6(B) with the output of a typical spectrum from the LCModel software shown in 6(C). The real part of the frequency-domain spectrum with no smoothing is plotted as a thin curve. The red line is the LCModel fit to the data. The spectrum at the top of figure 6(C) is the plot of the residuals which is the data minus the fit to the data. This is an indication of the quality of the fit. A good fit should look like random noise with oscillations about zero. The typical signal to noise ratio of the NAA peak was in the range 8–10 and VOI had a typical full width half maximum of 10–15 Hz. This SNR is low but is a compromise between available SNR and temporal resolution. The NAA peak amplitude drops by about 6% 10 minutes post injection. The level then returns to equilibrium level. The error bars represent standard deviation. CNO injection caused a decrease in the NAA signal that is evident within 10 minutes and persisted for 40 minutes, after which time it slowly returned to control levels. In this study, each rat is its own control. Control periods; −20,−10 and 0 min and experimental periods; 10–60 min, all values were normalized to the individual rat value at −20 min. Comparing control values with experimental values at 10–60 min for all rats (n=4), there is a prolonged drop of about 6% and then slow recovery. Using Students’ unpaired t-test, the value at 20 min post-injection was significant (p=0.0128) and at 30 min, also significant (p=0.0470). Our a-priori hypothesis was that CNO would alter neuron function and metabolism and would thus lead to a change in NAA levels, as previously reported (12–15). In a recent study using a spectral editing technique to measure NAAG and NAA separately, Landim et al, 2015 (15) demonstrated a decrease in NAA and increase in NAAG concentration upon visual stimulation. In this study, control animals which did not have any DREADDs expression showed no noticeable change in NAA upon CNO drug challenge.
Figure 6. Changes NAA peak amplitude in mPFC with DREADDs activation.
(A) Mean percent change in NAA peak amplitude, corrected for the average BOLD response, is plotted in 10-minute bins. The error bars represent standard deviation. The image depicted in (B) shows the site of the injection and the VOI used. The spectrum shown in (C) shows a typical LCModel output.
LFP measures
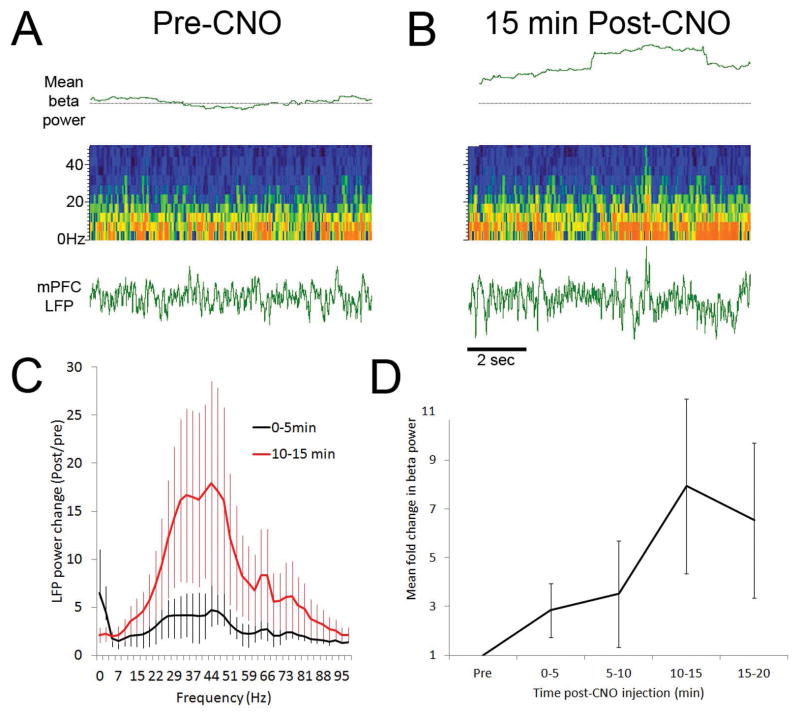
LFP recordings were made at least 1 week after the final scanner session for each rat. After a 15-minute baseline, CNO was injected systemically as in the MRI experiment. Again, CNO effects were evident within 5 minutes, causing increased neural activity at low and high frequencies, as has been reported in hippocampus (32). This is shown in figure 7. This LFP analysis confirms that activation of hM3Dq increases neural activity. The key finding here is that CNO activation of Gq-coupled DREADDs is also detected with MRI within minutes of systemic injection by BOLD signal changes. Thus, MRI can be used to verify effects of the CNO/DREADDs system in live rats that can recover and undergo later testing. These results also suggest that the DREADDs system may be a useful tool for evaluating the relationship between prolonged neural activity changes and BOLD signals.
Figure 7. CNO increases LFP beta frequency oscillations in mPFC.
Representative raw LFP and pseudocolor LFP sonogram analysis for a CNO-treated rat expressing DREADDs in mPFC. Representative examples of mPFC LFPs before (A) and 15 min after (B) CNO administration. Pseudocolor sonograms show changes in broad band (0–50Hz) oscillatory power after CNO, while top trace shows change in beta frequency oscillations (15–35Hz) relative to baseline (dashed horizontal line). (C) Change in broad band oscillatory power (0–100Hz) 5 min and 15 min after CNO injection relative to pre-injection baseline (n=4 rats). (D) Time course of mean change in beta frequency power from pre-CNO baseline. Increase in beta power is significant (repeated measures ANOVA, F(4,16) = 3.01, p < 0.05).
DISCUSSION
Demonstration of the human findings in an animal model
In this study, we demonstrate that DREADDs stimulation of the rat mPFC using the drug CNO results in (a) an increase in neuronal activity (LFP), (b) an increase in CBF based on the BOLD response and (c) a decrease in NAA as measured by its MRS signals. These findings show for the first time the tightly coupled relationships between stimulation, neuronal activity, blood oxygen levels and NAA dynamics in brain. These findings are also consistent with NAA/NAAG dynamics measured in human brain in response to visual stimulation, although direct measures of neural activity were not possible in those studies (12–15). Together, this suggests that the DREADDs system may be used in anesthetized animals to model neural activity induced NAA/NAAG dynamics and investigate translationally relevant mechanisms of neurovascular coupling.
Demonstration of the sequential nature of stimulation-induced changes in neural activity, BOLD, and NAA dynamics using DREADDs technique
Using the DREADDs technique we are also able to show the relative timing and sequential nature of stimulation-induced electrophysiological, blood oxygen level and metabolic events in a specific area of the brain. In this study, the first observable change that occurs is an increase in the LFP-measure of neural activity. This is followed by an initial increase in BOLD at about the same time, and an initial decrease in the NAA signal in less than 10 min, a temporal value consistent with previous human studies. While these changes are exaggerated in time using an infusion technique, the sequence is clear. Stimulation by CNO induces almost immediate neural activity, a rapid blood oxygenation response, and metabolic changes in NAA observable within minutes.
CONCLUSIONS
In this study using proton MRS we demonstrate for the first time a sequence of events that occur upon brain stimulation in a focal ROI. These events include an increase in neural activity, an increase in focal blood oxygenation and a decrease in the NAA signal. We also show that the inverse relationship between stimulation and the NAA signal previously observed in humans can be demonstrated in an animal model.
The direct measures of all metabolites using PRESS do not allow reliable separation of NAA and NAAG. This is because their principal resonances are only separated by 0.03 ppm. A J-editing technique known as MEGA PRESS (33) can be used to take advantage of the relatively large difference of 0.2 ppm between the α-protons of NAA and NAAG. Edden et al., (34) used the MEGA PRESS sequence with inversion pulses placed symmetrically around the α resonance to selectively measure the concentration of NAA and NAAG. Landim et al., (15) used this approach to measure the changes in NAA and NAAG concentration in the human visual cortex in response to visual stimulation. They found that NAA concentration went down by about 10–20% and NAAG concentration increased by about 60%. The advantage of the DREADDs procedure is that the targeted region can be made larger using multiple injection sites. This means that a larger VOI can be used to increase SNR and thus more reliably separate measures of NAA and NAAG using a MEGA-PRESS acquisition.
NAAG is a neurotransmitter and appears to be involved in the activation of astrocytes, a component part of a complex “neurovascular” feedback mechanism (35) to supply sufficient oxygen and energy to neurons. Just how important and what specific role NAAG plays in this process remains to be elucidated. However, there is evidence that blocking the astrocytic hydrolysis of NAAG in vivo in mice results in a prolonged period of reduced global BOLD signal (36). This suggests that the non-synaptic release NAAG (10) may play an important role in longer-term focal and global tonic regulation of brain energy supplies rather than in the rapid phasic focal responses to stimulation (37). The function of NAA is still unresolved. However, there are several hypotheses that have been advanced regarding the roles of exported intact NAA from neurons and of its Ac component liberated by oligodendrocyte ASPA. To date, no hypothesis has been advanced regarding the possible role of its excitatory Asp component that is also liberated by ASPA. We hope that the findings reported in this study will provide an additional tool with which to further unravel the physiological functions of both NAA and NAAG.
Acknowledgments
This work was supported in part by NIH grant 1S10RR023534-01. We also thank Elsevier publications for permission to use the atlas figure used in figure 2.
Abbreviations used
- Ac
acetate
- AcCoA
acetyl Co-enzyme A
- Asp
aspartate
- ASPA
aspartoacylase
- ATP
adenosine triphosphate
- BOLD
blood oxygenation-level dependent
- CBF
cerebral blood flow
- CNO
clozapine-N-oxide
- DMSO
dimethyl sulfoxide
- DREADDs
Designer Receptor Exclusively Activated by Designer Drugs
- ECF
extracellular fluid
- EPI
echo planar imaging
- fMRS
functional MRS
- Glu
glutamate
- LFP
local field potential
- mGluR3
metabotropic Glu receptor 3
- mPFC
medial pre-frontal cortex
- MR
magnetic resonance
- MRS
magnetic resonance spectroscopy
- NAA
N-acetylaspartate
- NAAG
N-acetylaspartylglutamate
- PRESS
Point resolved spectroscopy
- ROI
region of interest
- tNAA
total NAA and NAAG
- VOI
volume of interest
References
- 1.Wiame E, Tyteca D, Pierrot N, Collard F, Amyere M, Noel G, Desmedt J, Nassogne MC, Vikkula M, Octave JN, Vincent MF, Courtoy PJ, Bolthauser E, van Schaftingen E. Molecular identification of aspartate N-acetyltransferase and its mutation in hypoacetylaspartia. Biochem J. 2010;425:127–136. doi: 10.1042/BJ20091024. [DOI] [PubMed] [Google Scholar]
- 2.Becker I, Lodder J, Gieselmann V, Eckhardt M. Molecular characterization of N-acetylaspartylglutamate synthetase. J Biol Chem. 2010;285:29156–29164. doi: 10.1074/jbc.M110.111765. [DOI] [PMC free article] [PubMed] [Google Scholar]
- 3.Baslow MH. Evidence that the tri-cellular metabolism of N-acetylaspartate functions as the brain’s “operating system”: how NAA metabolism supports meaningful intercellular frequency-encoded communications. Amino Acids. 2010;39:1139–1145. doi: 10.1007/s00726-010-0656-6. [DOI] [PubMed] [Google Scholar]
- 4.Bitto E, Bingman CA, Wesenberg GE, McCoy JG, Phillips GN. Structure of aspartoacylase, the brain enzyme impaired in Canavan disease. PNAS. 2007;104:456–461. doi: 10.1073/pnas.0607817104. [DOI] [PMC free article] [PubMed] [Google Scholar]
- 5.Sacha P, Zamecnik J, Barinka C, Hlouchova k, Micochova P, Hilgert I, Eckschlager T, Konvalinka J. Expression of glutamate carboxypeptidase II in human brain. Neurosci. 2007;144:1361–1372. doi: 10.1016/j.neuroscience.2006.10.022. [DOI] [PubMed] [Google Scholar]
- 6.Baslow MH. A novel key-lock mechanism for inactivating amino acid neurotransmitters during transit across extracellular space. Amino Acids. 2010;38:51–55. doi: 10.1007/s00726-009-0232-0. [DOI] [PubMed] [Google Scholar]
- 7.Taylor DL, Davies SEC, Obrenovitch TP, Urenjak J, Richards DA, Clark JB, Symon L. Extracellular N-acetylaspartate in the rat brain: In vivo determination of basal levels and changes evoked by high K+ J Neurochem. 1994;62:2349–2355. doi: 10.1046/j.1471-4159.1994.62062349.x. [DOI] [PubMed] [Google Scholar]
- 8.Sager TN, Fink-Jensen A, Hansen AJ. Transient elevation of interstitial N-acetylaspartate in reversible global brain ischemia. J Neurochem. 1997;68:675–682. doi: 10.1046/j.1471-4159.1997.68020675.x. [DOI] [PubMed] [Google Scholar]
- 9.Shah AJ, de la Flor R, Atkins A, Stone-Murphy J, Dawson LA. Development and application of liquid chromatography/tandom mass spectrometric assay for measurement of N-acetylaspartate, N-acetylaspartylglutamate and glutamate in brain superfusates and tissue extracts. J Chrom B. 2008;876:153–158. doi: 10.1016/j.jchromb.2008.10.012. [DOI] [PubMed] [Google Scholar]
- 10.Jansen RS, Mahakena S, de Hass M, Borst P, van de Wetering K. ATP-binding cassette subfamily C member 5 (ABCC5) functions as an efflux transporter of glutamate conjugates and analogs. J Biol Chem. 2015;290(51):30429–30440. doi: 10.1074/jbc.M115.692103. [DOI] [PMC free article] [PubMed] [Google Scholar]
- 11.Baslow MH, Guilfoyle DN. Evidence that lithium inhibits export of N-acetyl-L-aspartate from neurons: A retrospective study of Canavan disease and bipolar disorder patients. A novel finding connecting lithium therapy for Canavan disease and bipolar disorder with dynamic aspects of NAA metabolism. J Genet Disorders and Genet Reports. 2014;3(1) http//dx.doi.org/10.4172/2327-5790.1000110. [Google Scholar]
- 12.Sarchielli P, Tarducci R, Presciutti O, Gobbi G, Pelliccioli GP, Stipa G, Gobbi G, Pelliccioli GP, Stipa G, Alberti A, Capocchi G. Functional 1H-MRS findings in migraine patients with and without aura assessed interictally. Neuroimage. 2005;24:1025–1031. doi: 10.1016/j.neuroimage.2004.11.005. [DOI] [PubMed] [Google Scholar]
- 13.Baslow MH, Hrabe J, Guilfoyle DN. Dynamic relationship between neurostimulation and N-acetylaspartate metabolism in the human visual cortex. Evidence that NAA functions as a molecular water pump during visual stimulation. J Mol Neurosci. 2007;32:235–245. doi: 10.1007/s12031-007-0049-9. [DOI] [PubMed] [Google Scholar]
- 14.Castellano G, Li LM, Dias CSB, Foerster B, Covolan RJM. NAA and NAAG variation in neuronal activation during visual stimulation. Braz J Med Biol Res. 2012;45:1031–1036. doi: 10.1590/S0100-879X2012007500128. [DOI] [PMC free article] [PubMed] [Google Scholar]
- 15.Landim RC, Edden RA, Foerster B, Li LM, Covolan RJ, Castellano G. Investigation of NAA and NAAG dynamics underlying visual stimulation using MEGA-PRESS in a functional MRS experiment. Magn Reson Imaging. 2016;34(3):239–245. doi: 10.1016/j.mri.2015.10.038. [DOI] [PMC free article] [PubMed] [Google Scholar]
- 16.Marjanska M, Lehericy S, Valabregue R, Popa T, Worbe Y, Russo M, Auerbach EJ, Grabli D, Bonnet C, Gallea C, Coudert M, Yahia-Cherif L, Vidaihet M, Meunier S. Brain dynamic neurochemical changes in dystonic patients: a magnetic resonance spectroscopy study. Mov Disord. 2013;28(2):201–209. doi: 10.1002/mds.25279. [DOI] [PMC free article] [PubMed] [Google Scholar]
- 17.Armbruster BN, Roth B. Creation of designer biogenic amine receptors via directed molecular evolution. Neuropsychopharmacology. 2005;30:S265. [Google Scholar]
- 18.Sternson SM, Roth BL. Chemogenetic tools to interrogate brain function. Annu Rev Neurosci. 2015;37:387–407. doi: 10.1146/annurev-neuro-071013-014048. [DOI] [PubMed] [Google Scholar]
- 19.Urban DJ, Roth BL. DREADDs: Chemogenetic tools with therapeutic utility. Annu Rev Pharmacol Toxicol. 2015;55:399–417. doi: 10.1146/annurev-pharmtox-010814-124803. [DOI] [PubMed] [Google Scholar]
- 20.Vincent JL, Patel GH, Fox MD, Snyder AZ, Baker JT, Van Essen DC, Zempel JM, Snyder LH, Corbetta M, Raichle ME. Intrinsic functional architecture in the anaesthetized monkey brain. Nature. 2007;447:83–86. doi: 10.1038/nature05758. [DOI] [PubMed] [Google Scholar]
- 21.Rogan SC, Roth BL. Remote control of neuronal signaling. Pharmacological reviews. 2011;63:291–315. doi: 10.1124/pr.110.003020. [DOI] [PMC free article] [PubMed] [Google Scholar]
- 22.Bottomley PA. Selective volume method for performing localized NMR spectroscopy in vivo. Ann NY Acad Sci. 1987;508:333–348. doi: 10.1111/j.1749-6632.1987.tb32915.x. [DOI] [PubMed] [Google Scholar]
- 23.Kozorovitskiy Y, Saunders A, Johnson CA, Lowell BB, Sabatini BL. Recurrent network activity drives striatal synaptogenesis. Nature. 2012;485(7400):646–50. doi: 10.1038/nature11052. [DOI] [PMC free article] [PubMed] [Google Scholar]
- 24.Gruetter R. Automatic, localized in vivo adjustment of all first- and second-order shim coils. Magn Reson Med. 1993;29(6):804–11. doi: 10.1002/mrm.1910290613. [DOI] [PubMed] [Google Scholar]
- 25.Tkac I, Starcuk Z, Choi IY, Gruetter R. In vivo 1H NMR spectroscopy of rat brain at 1 ms echo time. Magn Reson Med. 1999;41:649–656. doi: 10.1002/(sici)1522-2594(199904)41:4<649::aid-mrm2>3.0.co;2-g. [DOI] [PubMed] [Google Scholar]
- 26.Guilfoyle DN, Hrabe J. Interleaved snapshot echo planar imaging of mouse brain at 7. 0 T. NMR in Biomedicine. 2006;19:108–115. doi: 10.1002/nbm.1009. [DOI] [PubMed] [Google Scholar]
- 27.Provencher SW. Estimation of metabolite concentrations from localized in vivo proton NMR spectra. Magn Reson Med. 1993;30:672–679. doi: 10.1002/mrm.1910300604. [DOI] [PubMed] [Google Scholar]
- 28.Wilson DA, Yan X. Sleep-like states modulate functional connectivity in the rat olfactory system. J Neurophysiol. 2010;104:3231–3239. doi: 10.1152/jn.00711.2010. [DOI] [PMC free article] [PubMed] [Google Scholar]
- 29.Notman R, Noro M, O’Malley B, Anwar J. Molecular basis for dimethylsulfoxide (DMSO) action on lipid membranes. J Am Chem Soc. 2006;128:13982–13983. doi: 10.1021/ja063363t. [DOI] [PubMed] [Google Scholar]
- 30.Delgado-Goñi T, Martín-Sitjara J, Simões RV, Acostab M, Lope-Piedrafitac S, Arús C. Dimethyl sulfoxide (DMSO) as a potential contrast agent for brain tumors. NMR in Biomedicine. 2012;26:173–184. doi: 10.1002/nbm.2832. [DOI] [PubMed] [Google Scholar]
- 31.De Graaf RA. In vivo NMR spectroscopy Principles and techniques. John Wiley and sons; 2007. [Google Scholar]
- 32.Alexander GM, Rogan SC, Abbas AI, Armbruster BN, Pei Y, Alen JA, Nonneman RJ, Hartmann J, Moy SS, Nicolelis MA, McNamara JO, Roth BL. Remote control of neuronal activity in transgenic mice expressing evolved G protein-coupled receptors. Neuron. 2009;63:27–39. doi: 10.1016/j.neuron.2009.06.014. [DOI] [PMC free article] [PubMed] [Google Scholar]
- 33.Mescher M, Merkle H, Kirsch J, Garwood M, Gruetter R. Simultaneous in vivo spectral editing and water suppression. NMR in Biomed. 1998;11:266–272. doi: 10.1002/(sici)1099-1492(199810)11:6<266::aid-nbm530>3.0.co;2-j. [DOI] [PubMed] [Google Scholar]
- 34.Edden R, Pomper MG, Barker PB. In vivo differnentiation of N-acetyl aspartyl glutamate from N-acetyl aspartate at 3 Tesla. Magn Reson Med. 2007;57:977–982. doi: 10.1002/mrm.21234. [DOI] [PubMed] [Google Scholar]
- 35.Dormanns K, van Disseldorp EMJ, Brown RG, David T. Neurovascular coupling and the influence of luminal agonists via the endothelium. J Theoret Biol. 2015;364:49–70. doi: 10.1016/j.jtbi.2014.08.029. [DOI] [PubMed] [Google Scholar]
- 36.Baslow MH, Dyakin VV, Nowak K, Hungund BL, Guilfoyle DN. 2-PMPA, a NAAG peptidase inhibitor, attenuates the BOLD signal in brain of anesthetized mice: Evidence of a link between NAAG release and hyperemia. J Mol Neurosci. 2005;26:1–16. doi: 10.1385/JMN:26:1:001. [DOI] [PubMed] [Google Scholar]
- 37.Rosenegger DG, Tran CH, Wamsteeker Cusulin JI, Gordon GR. Tonic local brain flow control by astrocytes independent of phasic neurovascular coupling. J Neurosci. 2105;30(39):13463–13474. doi: 10.1523/JNEUROSCI.1780-15.2015. [DOI] [PMC free article] [PubMed] [Google Scholar]
- 38.Paxinos G, Watson C. The rat brain in stereotaxic coordinates. Elsevier; 2006. [DOI] [PubMed] [Google Scholar]


