

Abstract
Reductions in metabolism and excess oxidative stress are prevalent in multiple neurodegenerative diseases. The activity of the mitochondrial enzyme α-ketoglutarate dehydrogenase complex (KGDHC) appears central to these abnormalities. KGDHC is diminished in multiple neurodegenerative diseases. KGDHC can be rate limiting for NADH production and for substrate level phosphorylation, but is also a source of reactive oxygen species (ROS). The goal of these studies was to determine how changes in KGDHC modify: baseline ROS, the ability to buffer ROS, baseline glutathionylation, calcium modulation and cell death in response to external oxidants. In vivo, reducing KGDHC with adeno virus diminished neurogenesis and increased oxidative stress. In vitro, treatments of short duration increased ROS and glutathionylation and enhanced the ability of the cells to diminish the ROS from added oxidants. However, long term reductions lessened the ability to diminish ROS, diminished glutathionylation and exaggerated oxidant induced changes in calcium and cell death. Increasing KGDHC enhanced the ability of the cells to diminish externally added ROS and protected against oxidant induced changes in calcium and cell death. The results suggest that brief periods of diminished KGDHC are protective, while prolonged reductions are harmful. Furthermore, elevated KGDHC activities are protective. Thus, mitogenic therapies that increase KGDHC may be beneficial in neurodegenerative diseases.
Keywords: Mitochondria, α-ketoglutarate dehydrogenase complex, cell death, oxidative stress
Graphical Abstract
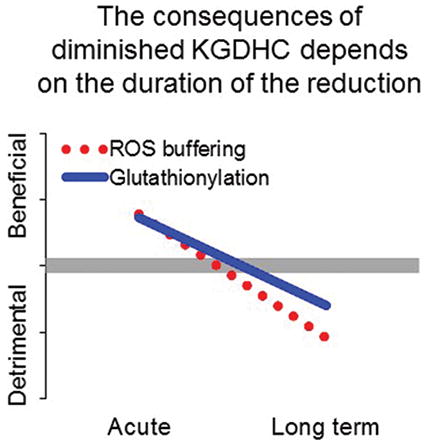
Reductions in the activity of the mitochondrial enzyme α-ketoglutarate dehydrogenase complex (KGDHC) occur in multiple neurodegenerative diseases. KGDHC is important in energy production, but is also a source of reactive oxygen species. The goal of the studies was to determine whether the reduction was good or bad. Short term reduction of KGDHC activity leads to enhanced buffering of ROS and increased glutathionylation-both of which are protective. However, prolonged reduction in activity diminishes buffering and glutathionylation. Increasing KGDHC activity was always protective.
Introduction
Glucose metabolism is diminished in multiple neurodegenerative diseases. The finding is particularly well-documented in Alzheimer’s disease (Mosconi 2005) in which diminished glucose metabolism is highly correlated to the decline in mental function (Furst et al. 2012). The decline in brain glucose metabolism has been widely used as a biomarker for AD (Jack Jr et al. 2013, Bateman et al. 2012). Although not as extensively studied, reductions in glucose metabolism accompany Huntington Disease (Unschuld et al. 2012, Túnez et al. 2011), Parkinson’s disease (Svenningsson et al. 2012) and tauopathies, including progressive supranuclear palsy (Hellwig et al. 2013). Understanding the basis for the decline in glucose metabolism is important for developing strategies to ameliorate the diseases and perhaps to develop early stage biomarkers. Mitochondrial abnormalities are well established in all of these disorders. The α-ketoglutarate dehydrogenase complex (KGDHC) is partially diminished in numerous neurological disorders (Gibson et al. 2013, Gibson et al. 1988b). KGDHC is a key, and often rate limiting enzyme of the mitochondrial tricarboxylic acid (TCA) cycle. It consists of multiple copies of three proteins (E1k, E2k and E3). A reduction in KGDHC can be plausibly linked to declines in glucose metabolism. For example, reducing brain KGDHC by one half by genetic manipulation in mice reduces brain glucose metabolism in mice (Nilsen et al. 2011).
Whether the decline of KGDHC (or the decline in glucose metabolism) is protective or harmful is unclear. On the one hand, KGDHC is critical for NADH production for the electron transport chain, ATP production and for substrate level phosphorylation within the mitochondria, which is beneficial. On the other hand, under reducing conditions KGDHC generates H2O2 and reactive oxygen species (ROS) (Starkov et al. 2004, Tretter & Adam-Vizi 2004, Quinlan et al. 2014), which could be considered harmful. Thus, one could postulate that the reduction in KGDHC in neurodegenerative diseases is good or bad. In human embryonic kidney (HEK) cells, chronic reduction of E2k diminishes the ability to buffer externally added ROS and increases cell death in response to external ROS (Shi et al. 2005). On the other hand, inhibiting KGDHC protects cultured neurons against glutamate excitotoxicity (Kabysheva et al. 2009).
Previous in vivo studies demonstrated that mice deficient in E2k or E3 showed slight increases in oxidative stress and reduced neurogenesis (Calingasan et al. 2008). These mice were KGDHC deficient from conception.
Calcium homeostasis is also altered in cells from AD patients, with an increase in IP3 releasable calcium stores (Gibson & Huang 2004). We previously showed that varying durations of KGDHC inhibition have varying consequences on calcium homeostasis. Acute inhibition of KGDHC with a specific inhibitor of KGDHC produces a different effect than long term reductions with shRNA or chronic reductions in neurons from transgenic mice. Long term or chronic reductions in KGDHC produce the same exaggerated internal calcium stores as occurs in AD (Gibson et al. 2012) or in cells treated with particular oxidants (Huang et al. 2005).
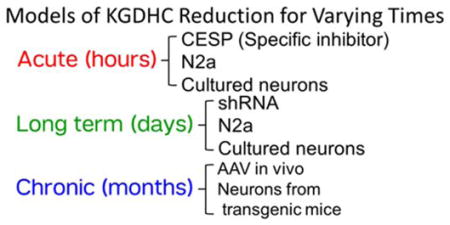
The current experiments tested the effects of reducing KGDHC activity for varying times (see chart). We first tested whether diminishing KGDHC activity chronically in vivo with a very specific adenovirus leads to increased oxidative stress and to cell death. Subsequent experiments explored the same concepts in vitro. We tested whether over-expression of the gene for E1k (OGDH), or acute, long term or chronic reductions in KGDHC alters calcium dynamics, cell death, the resting level of ROS as well as the ability of cells to buffer externally added oxidants. Acute inhibition of KGDHC activity was produced with the selective inhibitor carboxyethyl succinyl phosphonate (CESP)(Bunik et al. 2005). CESP is a mechanism based inhibitor. Substitution of the carboxylate of α-keto acids with a phosphonate results in reversible inhibition of the α-keto acid dehydrogenases. The phosphonates induce conformational transitions that both increase the specificity of the phosphonate reaction with thiamine diphosphate, and tighten binding of the resulting adduct, but are unable to undergo cleavage analogous to that exhibited by the α-keto carboxylate substrates. The limited pathways for biodegradation of the C-P bond ensure that phosphonates upon entering cells are not rapidly metabolized (Bunik et al. 2005). Long term reduction of KGDHC activity was produced with the adenovirus shRNA (Ad-GFP-U6-OGDH-shRNA) to reduce production of the E1k subunit of KGDHC in N2a cells and neurons (Gibson et al. 2012). Neurons with chronic diminished activity of KGHC were cultured from mice deficient in the E2k portion of the complex (Gibson et al. 2012). As described below, the reductions in KGDHC activity are similar in the three models. However, two treatments (acute and long term) alter E1k and the chronic model reduces E2k. Thus, the possibility exists that some of the differences we observed are not just due to variation in KGDHC activity, but may be related to manipulation of E1 or E2, because each subunit of the complex can have additional actions (Shi et al. 2005).
In each case, the added oxidant was t-butyrl hydroperoxide (t-BHP). Of several oxidants tested t-BHP produced the most AD like effects on bombesin-releasable calcium stores (BRCS) (Huang et al. 2005).
Materials and Methods
Experimental chronic KGDHC deficiency in vivo
B6C3F1 mice received a unilateral stereotactic injection of AAV shRNA targeting the E1k subunit of KGDHC into the dentate gyrus of the hippocampus. shRNA to reduce the mRNA levels required for the production of the E1k subunit of KGDHC according to our pervious publication (Gibson et al. 2013). The sense strand of the shRNA is GATGAGAAGATCTTGCACATGAATTCAAGAGATTGATGTGCAAGATCTTCTCATCTT TTTT. Plasmids of pAAV that express scrambled shRNA served as a negative control. The AAV expressing shRNA for the gene for E1k (OGDH)(AAV2-GFP-U6-shOGDH) or control AAV (AAV2-GFP) were made in collaboration with Vectorbiolabs (Philadelphia, PA, USA) (Gibson & Huang 2004).
Four weeks after the injection into four-month old mice, the mice were sacrificed. Brains were processed for histochemical staining to visualize KGDHC activity in situ as described previously (Park et al. 2000). A modified avidin–biotin–peroxidase immunohistochemistry was also performed using antibodies against a lipid peroxidation marker, malondialdehyde (provided by Dr. Craig E. Thomas, 1:1,000) and doublecortin (Santa Cruz Biotechnology, Santa Cruz, CA, USA; 1:200), a marker of migrating neuroblasts, which provides a means to perform relative quantitation of the level of adult neurogenesis. All experiments were approved by the Weill Cornell Medical College Institutional Animal Care and Use Committee (IACUC).
Cell culture
N2a neuroblastoma cells were purchased from American Type Culture Collection (Manassas; VA, USA). Cells were maintained at 37°C in a humidified incubator under 5% CO2 and 95% air in complete media (DMEM supplemented with 10% fetal bovine serum).
Neurons from embryos were prepared from the cerebral cortices of E15.5 of C57BL/6 mice (Charles River, Wilmington MA). All procedures were approved by Weill Cornell Medical College IACUC. After the brains were dissected, the blood vessels and meninges were removed under a microscope. Then, the cortices were placed in ice-cold DMEM and minced. The tissue chunks were incubated with papain solution (2 mg/ml papain, 0.5 mM EDTA, 0.2 mg/ml cysteine, 1.5 mM CaCl2 and 50 μg/ml DNase I) at 37°C for 30 min to dissociate the cells, and the reaction was terminated by adding heat-inactivated horse serum. After the cell suspensions were centrifuged at 700 g, the pellets were resuspended in DMEM supplemented with 10% horse serum. Cells were plated onto poly-D-Lysine coated Delta TPG dishes (Bioptechs, Butler, PA) at a seeding density of 4 × 10⁵ cells /dish and incubated at 37°C in a humidified incubator with 5% CO2. Two hours after plating, the media were replaced with neurobasal/B27 containing 0.5 mM glutamine and 25 μM glutamate. The medium was changed to neurobasal/B27 medium without glutamate after 4 days and cultured for an additional 6 days.
KGDHC activity assay in cell lysates
KGDHC catalyzes the following reaction: α-ketoglutarate + NAD+ + CoA → succinyl CoA + CO2 + NADH. N2a cells in 6-well plates were washed twice with Dulbeccoo’s Phosphate Buffered Saline (D-PBS) and lysed with 250 μl of cell lysate buffer [50 mM Tris-HCl pH 7.2, 0.4% Triton X-100, 0.2 mM EGTA, 50 μM leupeptin and 1 mM dithiothreitol]. KGDHC activities were assayed immediately as described previously (Gibson et al. 1988a). KGDHC activity is routinely measured using a mixture of NAD and CoA coupled with α-ketoglutarate. KGDHC activity was estimated by measuring the production of NADH using a Gemini EM fluorescent plate reader at 340 nm at 37°C for 30 minutes. The reaction mixture contained (Final): magnesium chloride anhydrous (1 mM), calcium chloride dihydrate (1 mM), dithiothreitol (1 mM), Triton X-100 (Final=0.1%), EDTA (0.5 mM), TPP (300 μM), Tris buffer, (50 mM, pH 7.8), β-NAD (4 mM), Coenzyme A (0.5 mg/ml), α-ketoglutarate (8 mM).
Sodium dodecyl sulfate (SDS) polyacrylamide gel electrophoresis (PAGE) and Western blotting
A 5×SDS-sample loading dye (50% glycerol, 250 mM Tris buffer [pH 6.8], 10 mM EDTA, 10% SDS, and 0.04% bromophenol blue) was added to N2a cell lysates to achieve 1 × final concentration. Electrophoresis was done with a 4%–20% Tris-glycine gel (Life Technologies, Grand Island, NY) using 90 volts for 3 hours. Western blotting was performed as described in a previous study (Shi et al. 2011, Shi et al. 2005). The antibodies E1k (1:1000 dilution, Rockland Immunochemicals, Gilbertsville, PA) and actin (1:5000 dilution, Sigma) were used at the indicated dilutions.
Protein glutathionylation detection
After treatments, cells were incubated with 100 μM t-BHP for 5 min and the mitochondrial fractions were isolated by our published method (Huang et al., 2003; Yang et al., 1997). Equal amounts of protein (20 μg) from each group were loaded onto SDS-PAGE gels under nonreducing (no β-mercaptoethanol) conditions and protein glutathionylation was detected by Western blotting with an anti-GSH antibody (1:1000 dilution, ViroGen, Watertown, MA).
Real-time reverse transcription PCR
Total RNA was isolated from N2a cells 96 hours postinfection by an RNeasy Plus Micro Kit (Qiagen, Valencia CA). First strand cDNA was synthesized from the isolated total RNA. Real-time PCR of E1k was performed using an Applied Biosystems 7500 Fast RealTime PCR system with predesigned Taqman gene expression assays (Applied Biosystems, Foster City CA) by a published method (Shi et al. 2011).
Temporal response of ROS production by fluorescence spectroscopy
CellROX® Orange Reagent is a fluorogenic probe with phycoerythrin for measuring oxidative stress in live cells. This cell-permeant dye is non-fluorescent while in a reduced state and exhibits bright orange fluorescence upon oxidation by hydroxyl radical, superoxide anion, and t-BHP (possibly alkoxyl radical) (Thermofisher web site) (Onoue et al. 2016). Cells (4 × 10⁴ cells/well in 96-well plate) were loaded with 100 μl of 5 μM CellROX orange AM in balanced salt solution (BSS) for one hour at 37°C and rinsed twice with BSS. The temporal responses for one hour incubations were determined using a SPECTRA MAX GEMINI EM fluorescence microplate reader in well scan mode (fill pattern) with Ex545/Em565, 550-nm cutoff.
ROS production measured by microscopic imaging
Since microscopic imaging might provide much precise and different aspect of measurement, data was confirmed with imaging at the five min time point. Cells (4 × 10⁵ cells/dish in Delta TPG dish; Bioptechs, Butler, PA ) were loaded with 5 μM (100 μl) CellROX Orange reagent (Life Technologies, Grand Island NY) in balanced salt solution (BSS) for one hr at 37°C and rinsed twice with BSS. ROS signals were monitored on the stage of an inverted Olympus IX70 microscope at room temperature with a Delta Scan System from PTI (Photon Technology International, Birmingham NJ). Excitation wavelength was at 545 nm and emission was monitored at 565 nm with a Hamamatsu C2400 SIT camera at 5 sec intervals.
Measurement cell death by fluorescence spectroscopy
Cells (4 × 10⁴ cells/well in 96-well plate) were pretreated with t-BHP in Neurobasal medium/ B-27 Supplement minus antioxidants (Life Technologies, Grand Island NY) for 24 hours at 37°C. After pretreatment, cells were treated with 100 μL of live/dead viability working reagents containing 0.5 μM calcein violet AM and 4 μM ethidium homodimer-1 (EthD-1) (Life Technologies, Grand Island NY) for 30 min at 37°C. After a 30 min incubation, calcein violet AM/EthD-1-stained cells were analyzed using a SPECTRA MAX GEMINI EM fluorescence microplate reader in well scan mode (fill pattern) with the following settings: Ex525/Em620, 590-nm cutoff for dead cells; Ex400/Em452, 435-nm cutoff for live cells. The relative percentage of dead cells was presented as relative fluorescence units (RFU) obtained from dead cells divided by RFU obtained from both live and dead cells.
Models with different durations of altered KGDHC
Methods to mimic different durations of altered KGDHC were established. Bunik and her colleagues showed that In brain the subunit ratio is 2.5 E1k, 1 E2k, 1.8 E3 (I. Bunik et al. 2013, Bunik et al. 2013). This varies between tissues and maybe with metabolic state. Kinetic analysis suggests that E1k is rate limiting (Bunik et al. 2008, Bunik et al. 2013). Studies in mice and culture show that diminishing each subunit can be rate limiting. CESP (carboxyethyl succinyl phosphonate) produces an acute reversible inhibition of KGDHC (Bunik et al. 2005, Gibson et al. 2012). The use of CESP (Gibson et al. 2012), the knockdown of KGDHC (Ad-GFP-U6-OGDH-shRNA) (Gibson et al. 2012) and the transgenic mice with diminished KGDHC activity (E2k+/− mouse) have been described previously (Yang et al. 2009). At the concentrations used in these studies (100 μM CESP), the inhibition of KGDHC in N2a cells is about 80% while that in neurons is about 39%. To overexpress KGDHC, Ad-GFP-mOGDH with construction of OGDH, the gene encoding E1k of KGDHC with cytomegalovirus (CMV) promoter was employed. The adenovirus for overexpressing OGDH(Ad-GFP-mOGDH) and control adenovirus (Ad-CMV-GFP) were packaged from Vectorbiolabs (Philadelphia, PA, USA). Adenovirus (Ad-GFP-U6-OGDH-shRNA) to reduce the mRNA levels required for the production of the E1k subunit of KGDHC produces a long term reduction of KGDHC activity. The conditions are described in our previous publication (Gibson et al. 2012). In N2a cells, this reduces mRNA (90%), protein (62%) and activity (30%) by the indicated percentage. In neurons, this reduces mRNA (92%), protein (60%) and activity (33%) by the indicated percentage. Neurons cultured from E2k+/− mice produce a chronic reduction of KGDHC activity. The activity of KGDHC in brain of E2k+/− mouse is diminished by about one half as compared to that of the wild-type mouse (E2k+/+) (Yang et al. 2009). Adenovirus overexpressing the gene for the E1k subunit of KGDHC (OGDH)(Ad-GFP-mOGDH) produces an over-expression of OGDH in N2a and cultured neuroblastoma cells.
Measures of BRCS
Cells were loaded with 2 μM fura-2 AM (Life Technologies, Grand Island NY) in BSS for one hour at room temperature and rinsed twice with Ca2+-free BSS (140 mM NaCl, 5 mM KCl, 1.5 mM MgCl2, 5 mM glucose, 10 mM HEPES, 0.1 mM CaCl2,1mM EGTA, pH 7.4) (Gibson et al., 2002). Then, two mL of Ca2+-free BSS was added to each dish and [Ca2+] was monitored with the Delta Scan System (Photon Technology International). Basal [Ca2+] was measured for one minute. Bradykinin (200 nM) (Sigma) was added to release ER calcium and the signal was measured for another 5 minutes. Each value was the average of 32 images taken within 5 seconds. Standard images of fura-2 solutions with minimum and maximum [Ca2+] were taken at the end of each day’s experiment to calculate the intracellular calcium concentrations (Huang et al., 2004, 2005).
Protein measurements
Proteins were determined with the Bradford Protein Assay Bio-Rad protein Assay Dye Reagent Cat #500-0006.
Data presentation
When values are presented as a percent of control, all values for a particular day including the controls are divided by the average of the controls for that experiment. Since the individual values in control group are not the same, the S.E.M. is not zero. This allows us to account for some day to day variation in values and still do statistical comparisons.
Results
Reduction of of KGDHC activity in vivo increases oxidative stress
KGDHC histochemistry revealed a generalized reduction of KGDHC activity staining in the hippocampus ipsilateral to the injection of AAV2-GFP-U6-shOGDH compared to the contralateral side (Figure 1). The reduction of staining intensity was very evident in the dentate gyrus (Figure 1, middle panel). To verify the localization of the AAV2-GFP-U6-shOGDH, GFP autofluorescence was examined. GFP-expressing cells were localized in the dentate gyrus of the injected side only (Figure 1, bottom panel).
Figure 1.

Reduction of histochemical KGDHC activity staining in the hippocampal dentate gyrus ipsilateral to injection with AAV2-GFP-U6-shOGDH targeting the E1k subunit of KGDHC. Photomicrographs showing KGDHC activity staining in mouse brain 4 weeks after a unilateral AAV2-GFP-U6-shOGDH injection (top panel, arrow). The ipsilateral and contralateral sides are magnified in the lower panels. High magnification photomicrographs of the boxed areas show marked reduction of KGDHC activity staining in the ipsilateral dentate gyrus relative to the contralateral side (middle panel). The green fluorescence photomicrographs at the bottom panel show the GFP autofluorescence from the non-injected (left) and AAV2-GFP-U6-shOGDH injected sides of a singular tissue section. This section is adjacent to the section used for the histochemical KGDHC staining. They clearly show GFP autofluorescence in the ipsilateral side indicating the localization of the AAV2-GFP-U6-shOGDH in the dentate gyrus of injected side without encroaching upon the opposite side of the hippocampus. The darker portions of the GFP fluorescence on the injected side is just due to “burning” and does not interfere with the visualization of AAV2-GFP-U6-shOGDH localization.
Oxidatively damaged cells were examined in the hippocampus by immunohistochemistry using a polyclonal antibody to malondialdehyde-modified proteins. We employed this in situ technique to enable direct comparison of the ipsilateral and contralateral sides. Malondialdehyde immunoreactivity was elevated in cells in the ipsilateral dentate gyrus compared to the uninjected side (Figure 2, top panels). Since oxidative stress is associated with impairment of neurogenesis, we examined doublecortin immunoreactivity in the subgranular zone of the dentate gyrus. Doublecortin-immunoreactive immature neurons were apparently reduced in the dentate gyrus of the side injected with AAV2-GFP-U6-shOGDH (Figure 2, bottom panels). Scrambled shRNA did not alter KGDHC activity (Supplementary Figure S1). Neither malondialdehyde nor reduce doublecortin immunoreactivity were altered with the scrambled sequence (Data not shown).
Figure 2.

Increased malondialdehyde immunoreactivity and reduced doublecortin immunoreactivity in the hippocampal dentate gyrus ipsilateral to AAV2-GFP-U6-shOGDH injection (arrows). Low and high magnification photomicrographs of brain sections through the hippocampus. Boxed areas (dentate gyrus) are high magnification photomicrographs showing increased malondialdehyde immunoreactivity and reduced doublecortin immunoreactivity in the injected side compared to the intact side.
Models to induce acute and long-term reduction in KGDHC activity, and increased activity by over-expression of the gene for E1k (OGDH) in N2a cells
Acute inhibition of KGDHC can be produced with carboxyethyl succinyl phosphonate (CESP), a selective, reversible inhibitor of KGDHC (Bunik et al. 2005). In N2a cells CESP (50 μM) inhibits KGDHC activity by 60% in N2a cells, while 100 μM CESP inhibits KGDHC activity by 80% (Gibson et al. 2012). Long term reduction of KGDHC activity can be produced with the adenovirus to reduce the mRNA levels required for the production of the E1k subunit of KGDHC in N2a cells and neurons. Adenovirus expressing scrambled shRNA (Ad-U6-RNAi-GFP) was used as control. Activity levels of KGDHC were lowered by 15% and 30% at 24 and 48 hours post-infection, respectively, as compared with the Ad-U6-RNAi-GFP infected N2a cells (Gibson et al. 2012). A model of over-expression of OGDH was developed to test whether increasing KGDHC could modify the effects of exogenously added oxidants. Adenovirus overexpressing OGDH, the gene for the E1k subunit of KGDHC (Ad-GFP-mOGDH) increased KGDHC activity in N2a cells. Seventy two hours after addition of the adenovirus to N2a cells, mRNA levels increased by 352%, protein levels increased by 27% and activity levels increased by 21%. The infection efficiency of the Ad-GFP-mOGDH was 71%, while that of the Ad-CMV-GFP was 79% (Supplementary Figure S2A).
Production of ROS following the addition of t-BHP in N2a cells
In previous studies, ROS were detected with dichlorofluroscein acetyoxymethyl ester (DCF-AM). However, the overlap of DCF-AM fluorescent wavelengths with those of the GFP from the adenovirus made DCF unsuitable for the current studies. Therefore, Cell-Rox Orange-AM, which complements GFP fluorescence, was used to detect increases in ROS. Addition of t-BHP increased Cell-Rox orange whether it was measured by imaging with fluorescence microscopy or with a plate reader. t-BHP increased ROS in N2a cells in a dose and time dependent manner (Supplementary Figure S3). The response was similar whether it was done with imaging or the plate reader. As a reference to previous studies, dose and time responses were also established for menadione and H2O2 with Cell-Rox Orange (Supplementary Figure S4).
Acute or long term reduction of KGDHC activity altered the response to oxidants in N2a cells differently
Acute inhibition of KGDHC increased resting ROS from 12 FU to 15 FU (+26%) (Figure 3A). The final values for ROS after t-BHP were similar with or without CESP. However, the delta after t-BHP declined from 13.6 to 7.2 (−47%) (Figure 3A).
Figure 3.

Acute and long term reduction of KGHC altered ROS differently with or without t-BHP in N2a cells.
3A. Acute inhibition of KGDHC increased ROS but lowered t-BHP induced ROS. Cells were loaded with CellROX Orange Reagent (5 μM) containing CESP (100 μM) for 60 min at 37°C. After 60 min, the medium was rinsed with BSS buffer, and 3 min later the ROS measurements were initiated in the presence of CESP. Resting ROS was measured from the first one minute and ROS after t-BHP was measured after adding t-BHP (100 μM) for 5 min. Values are the means ± S.E.M. of fluorescent signal and changes after t-BHP from two independent experiments (total 414 N2a cells, 228 cells from 12 dishes in control and 186 cells from 10 dishes in treatment group). Values with different letters vary statistically from each other (p<0.05) as determined by One-Way ANOVA followed by Student Newman-Keuls.
3B. Long term reduction of KGDHC did not alter ROS and increased t-BHP induced ROS. Cells were infected with adenovirus to knockdown E1k (100 MOI) for 48 hours. After 48 hours of infection cells were loaded with 5 μM (100 μL) CellROX Orange Reagent in BSS for one hour at 37°C. Resting ROS was measured from the first one minute and ROS after t-BHP was measured after adding t-BHP (100 μM) for 5 min. Values are the means ± S.E.M. of fluorescent signal and changes after t-BHP from two independent experiments (total 398 N2a cells, 213 cells from 10 dishes in control and 185 cells from 10 dishes in treatment group). Values with different letters vary statistically from each other (p<0.05) as determined by One-Way ANOVA followed by Student Newman-Keuls.
In N2a cells, long term reduction of of KGDHC activity did not alter resting ROS, but it increased t-BHP induced ROS from 21.6 FU to 28.1 FU (+30%. Long term diminished activity of KGDHC activity increased the delta after t-BHP from 8.9 to 14.7 (+65%) (Figure 3B).
Over-expression of OGDH altered ROS levels and the response to oxidants in N2a cells
The experiments tested whether over-expression of OGDH altered ROS after either a 5 min or 60 min treatment with t-BHP. Increasing KGDHC activities reduced resting ROS by 28% from 15 to 11 and lowered diminished t-BHP induced ROS by 37% from 29 to 18 (Figure 4A). The delta after t-BHP decreased by 47% from 13.6 to 7.2 (Figure 4A). In the experiments testing the effects of a 60 min oxidant treatment, resting ROS was unchanged by increased KGDHC activity. Increasing KGDHC diminished the increase in ROS after t-BHP from 83 to 53 (−36%). The delta after t-BHP decreased from 25.2% to 1.8% (−93%) (Figure 4B). Both time points suggest increasing KGDHC leads to better buffering of ROS.
Figure 4.

Overexpression of OGDH lowered oxidant induce ROSin N2a cells.
Overexpression of OGDH in N2a cells altered ROS and oxidant induced ROS at either 5 min (4A) or 60 min (4B) of oxidant treatement. Cells were infected with adenovirus to overexpress OGDH (1000 MOI) for 72 hours. After infection, cells were loaded with 5 μM CellROX Orange Reagent in BSS for one hour at 37°C. Resting ROS was measured from the first one minute and ROS after t-BHP was measured after adding t-BHP (100 μM) for shorter time treatment (5 min, with microscopic imaging) or for longer time treatment (60 min, with fluorescent plate reader). For shorter time treatment, values are the means ± S.E.M. of fluorescent signal and changes after t-BHP from two independent experiments (total 336 N2a cells, n=158 from 9 dishes in control group and n=178 from 10 dishes in treatment group). For longer time treatments, values are the means ± S.E.M. of fluorescent signal and changes after t-BHP from two independent experiments (total 40 wells, n=10 in each group).
Acute or long reduction of KGDHC activativity KGDHC and increased activity by OGDH over-expression altered the glutathionylation response to oxidants in N2a cells
The effects of acute and long term reduction of KGDHC activity of oxidant-induced changes stimulated experiments to determine whether these would be reflected in glutathionylation. Previous studies demonstrate that oxidant challenges altered glutathionylation of proteins (Applegate et al. 2008, Shi et al. 2008, Shi et al. 2011). To test whether this response was altered by varying activities of KGDHC, KGDHC activitiy was diminished either acutely or long term in N2a cells and the extent of glutathionylation of proteins was determined with or without oxidant. Acute reduction of KGDHC increased glutathionylation by 114%. The quantitative change in t-BHP induced glutathionylation was similar whether or not KGDHC was reduced (Figure 5A). On the other hand, following long term reduction of KGDHC activity, glutathionylation was reduced 40.2%. The addition of oxidant either diminished or did not change glutathionylation (Figure 5B). On the other hand, over expression of OGDH completely blocked the t-BHP induction of glutathionylation (Figure 5C).
Figure 5.

Acute and long term reduction of KGDHC activity and increased KGDHC activity altered glutathionylation differently with or without t-BHP in N2a cells.
5A. Acute inhibition of OGDH increased glutathionylation and increased t-BHP induced glutathionylation in N2a cells. Cells were treated with CESP (100 μM) for 60 min at 37°C. After treatment, cell were treated with t-BHP (100μM) for 5 min and protein glutathionylation in the mitochondrial fractions were detected by Western blotting with an anti-GSH antibody. Values are the means ± S.E.M. of eight samples from two independent experiments. Values with different letters vary statistically from each other (p<0.05) as determined by One-Way ANOVA followed by Student Newman-Keuls.
5B. Long term reduction of KGDHC activity either lowered or did not change glutathionylation and either lessened or did not change t-BHP induced glutathionylation in N2a cells. Cells were infected with Ad-GFP-U6-OGDH-shRNA (100 MOI) for 48 hours at 37°C. After infection, cell were treated with t-BHP (100μM) for 5 min and protein glutathionylation in the mitochondrial fractions were detected by Western blotting with an anti-GSH antibody. Values are the means ± S.E.M. of nine samples from four independent experiments. Values with same letter show no statistically different from each other as determined by One-Way ANOVA followed by Student Newman-Keuls. However, there are statistically differences for the inhibitory effect of long term reduction of KGHDC activity with or without adding t-BHP (p<0.05).
5C. Overexpression of OGDH lowered t-BHP induced glutathionylation in N2a cells. Cells were infected with Ad-GFP-mOGDH (1000 MOI) for 72 hours at 37°C. After infection, cell were treated with t-BHP (100μM) for 5 min and protein glutathionylation were detected by Western blotting with an anti-GSH antibody in the mitochondrial fractions. Values are the means ± S.E.M. of four samples from two independent experiments. Values with different letters vary statistically from each other (p<0.05) as determined by One-Way ANOVA followed by Student Newman-Keuls.
Over-expression of OGDH increased BRCS in N2a neuroblastoma in the absence or presence of oxidant
BRCS are increased in fibroblasts from patients with AD and in response to specific oxidants, especially t-BHP (Huang et al. 2005). These experiments tested whether increasing KGDHC activity alters this response. BRCS was measured with Fura-2 AM five min after oxidant treatment to test whether the effect of over-expression of OGDH on oxidant induced ROS can diminish the oxidant effect on BRCS. In controls, t-BHP induced BRCS by 31% in N2a. Over-expression of OGDH increased BRCS by 51% in N2a cells (Supplementary Figure S5). Furthermore, the increase with t-BHP was only 18.4% (Supplementary Figure S5).
Models to induce acute and long-term, chronic reduction of KGDHC activity, and over-expression of OGDH in neurons
Acute inhibition of KGDHC was produced with carboxyethyl succinyl phosphonate (CESP), a selective, reversible inhibitor of KGDHC (Bunik et al. 2005). CESP (100 μM) inhibits KGDHC activity by 39% in neurons (Gibson et al. 2012). Long term reduction of of KGDHC activity was produced with the adenovirus expressing shRNA to the gene expressing the gene for the E1k subunit of KGDHC (Ad-GFP-U6-OGDH-shRNA) in neurons. Adenovirus expressing scrambled shRNA (Ad-U6-RNAi-GFP) is used as control. Ad-GFP-U6-OGDH-shRNA diminishes the mRNA and activity level of E1k by 30% at 48 hours post-infection as compared with the Ad-U6-RNAi-GFP infected cells. Neurons with chronic reduction of KGHC are cultured neurons from mice deficient in the E2k portion of the complex. The activity of KGDHC in brain of E2k+/− mouse is diminished by about half as compared with that of the wild type mouse (Dumont et al. 2009, Gibson et al. 2012).
A model of increased activity of KGDHC was developed in neurons to test whether increasing KGDHC could modify the effects of exogenously added oxidants (Supplementary Figure S2B). Adenovirus overexpressing the E1k subunit of KGDHC (OGDH)(Ad-GFP-mOGDH) increased mRNA, protein and activities (Supplementary Figure S2B). mRNA levels increased by 16 fold at 48 hours and by 36 fold at 96 hours. Protein levels increased by 32% at 48 hours and by 82% at 96 hours. KGDHC activities increased by 25% at 48 hours and by 62% at 96 hours. The infection efficiency of the Ad-GFP-mOGDH was 53% for 48 hours and 64% for 96 hours, while that of the Ad-CMV-GFP was 52% for 48 hours and 63% for 96 hours (Data not shown)
Acute and long term reduction of of KGDHC activity altered the response to oxidants in cultured neurons
In cultured neurons, acute inhibition of KGDHC did not alter resting ROS, but it diminished t-BHP induced ROS from 17 FU to 14 FU (−18%) (Figure 6A). The delta after t-BHP decreased from 6.5 to 3.6 (−44%) (Figure 6A). Long term reduction of of KGDHC activity altered neither resting ROS nor t-BHP induced ROS. The changes after t-BHP decreased from 5.9 to 4.2 (−29%) (Figure 6B).
Figure 6.

Acute inhibition and long term reduction of KGDHC activity increase t-BHP induced ROS in cultured neurons.
6A. Acute inhibition of KGDHC lessened t-BHP induced ROS. Cells were loaded with CellROX Orange Reagent (5 μM) containing CESP (100 μM) for 60 min at 37°C. After 60 min the medium was rinsed with BSS buffer, and 3 min later the ROS measurements were initiated in the presence of CESP. Resting ROS was measured from the first one minute and ROS after t-BHP was measured after adding t-BHP (100 μM) for 5 min. Values are the means ± S.E.M. of fluorescent signal and changes after t-BHP from two independent experiments (total 419 neurons, 213 cells from 11 dishes in control and 206 cells from 10 dishes in treatment group). Values with different letters vary statistically from each other (p<0.05) as determined by One-Way ANOVA followed by Student Newman-Keuls.
6B. Long term reduction of KGDHC activity increased t-BHP induced ROS in cultured neurons. Cells were infected with adenovirus to knockdown E1k (100 MOI) for 48 hours. After 48 hours of infection cells were loaded with 5 μM (100 μL) CellROX Orange Reagent in BSS for one hour at 37°C. Resting ROS was measured from the first one minute and ROS after t-BHP was measured after adding t-BHP (100 μM) for 5 min. Values are the means ± S.E.M. of fluorescent signal and changes after t-BHP from two independent experiments (total 360 neurons, 185 cells from 9 dishes in control and 175 cells from 8 dishes in treatment group). Values with different letters vary statistically from each other (p<0.05) as determined by One-Way ANOVA followed by Student Newman-Keuls.
Chronic reduction of KGDHC activity alters ROS production in cultured neurons
The resting ROS for the five minutes pretreatment was reduced by 14% (Figure 7A). However, chronic reduction of KGDHC increased t-BHP induced ROS by 30% compared to 23% in the controls. The delta after t-BHP increased with chronic reduction of of KGDHC activity (+15%) (Figure 7A). The resting ROS did not vary in the 60 min oxidant treatment group. However, the delta ROS after t-BHP was exaggerated by chronic reduction of KGDHC activity by 107%. (Figure 7B).
Figure 7.

Chronic reduction of KGDHC activity f KGDHC activity exaggerated ROS in response to t-BHP in cultured neurons. Neurons from E2k+/− and wild type mice were loaded with 5 μM CellROX Orange Reagent in BSS for one hour at 37°C. Resting ROS was measured from the first one minute and ROS after t-BHP was measured after adding t-BHP (100 μM) for shorter time treatment (5 min, with microscopic imaging) or for longer time treatment (60 min, with fluorescent plate reader). For shorter time treatment, values are the means ± S.E.M. of fluorescent signal and changes after t-BHP from two independent experiments (total 323 cells, n=172 from 8 wild type mice and n=151 from 7 E2k+/− mice). For longer time treatment, values are the means ± S.E.M. of fluorescent signal and changes after t-BHP from two independent experiments (total 131 wells, n=75 from 10 wild type mice and n=56 from 7 E2k+/− mice). Values with different letters vary statistically from each other (p<0.05) as determined by One-Way ANOVA followed by Student Newman-Keuls.
Over-expression of OGDH altered ROS production in cultured neurons
Increasing KGDHC activity associated with the five min oxidant treatment did not alter resting ROS (Figure 8A). However, over-expression of OGDH diminished t-BHP induced ROS. The delta after t-BHP decreased from 6.1 to 3.8 (−37%) (Figure 8A). Nor did the resting ROS change in the 60 min oxidant treatment group. However, the increased E1k diminished the maximal ROS signal after t-BHP from 159 to 83 (−48%, Figure 8B). The delta after t-BHP declined from 90.9 to 13.8 (−85%) (Figure 8B). Increased KGDHC activity completely abolished H2O2 induced ROS in cultured neurons (Supplementary Figure S6).
Figure 8.

Overexpression of OGDH lowered ROS in response to t-BHP in cultured neurons. Cells were infected with adenovirus to overexpress OGDH (1000 MOI) for 96 hours. After infection, cells were loaded with 5 μM CellROX Orange Reagent in BSS for one hour at 37°C. Resting ROS was measured from the first one minute and ROS after t-BHP was measured after adding t-BHP (100 μM) for shorter time treatment (5 min, with microscopic imaging) or for longer time treatment (60 min, with fluorescent plate reader). For shorter time treatment, values are the means ± S.E.M. of fluorescent signal and changes after t-BHP from two independent experiments (total 381 neurons, n=182 from 9 dishes in control group and n=199 from 9 dishes in treatment group).
For longer time treatment, values are the means ± S.E.M. of fluorescent signal and changes after t-BHP from two independent experiments (total 40 wells, n=10 in each group). Values with different letters vary statistically from each other (p<0.05) as determined by One-Way ANOVA followed by Student Newman-Keuls.
Chronic reduction of KGDHC activity and increased KGDHC activity by over-expression of OGDH on bombesin inducible calcium stores (BRCS)
BRCS are increased in fibroblasts from patients with AD (Ito et al. 1994) and in response to specific oxidants, especially t-BHP (Huang et al. 2005). These experiments tested whether manipulation of KGDHC alters this response. BRCS was measured with Fura-2 AM five min after oxidant treatment to test whether over-expression of OGDH can diminish the effect of oxidant induced ROS on BRCS. In E2k+/+ neurons, t-BHP induced BRCS by fivefold (Supplementary Figure S7). Chronic reduction of KGHC activity KGDHC increased maximal BRCS by 85% in neurons from E2k +/− mice compared to neurons from E2k+/+ mice (Supplementary Figure S7A). Over-expression of OGDH diminished the maximal BRCS by 68% in cultured neurons (Supplementary Figure S7B).
Twenty four hour or 96 hour reduction of KGDHC activity as well as increased activity by over-expression of OGDH and cell death in cultured neurons
Twenty four hour treatment with t-BHP increased cell death by 21% in cultured neurons (Figure 9). Neither 24 hr (Figure 9A) nor 48 hr (Figure 9B) reduction of KGDHC altered the t-BHP induced cell death in cultured neurons. Similarly, neither 24 hr (Figure 9A) nor 48 hr (Figure 9B) reduction of of KGDHC altered H2O2 induced cell death in cultured neurons (Supplementary Figure S8). However, 96 hr reduction of of KGDHC activity increased t-BHP induced cell death in N2a cells. A twenty four hour treatment with t-BHP increased the cell death by 42% in cultured neurons from the E2k+/− mice and increased cell death by 22% in cultured neurons from E2k+/+ mice (Figure 10A). Over-expression of OGDH diminished t-BHP induced cell death in cultured neurons. In controls, t-BHP increased cell death by 31%, but only 5% in the OGDH over-expressing cells (Figure 10B).
Figure 9.

Acute or long term reduction of KGDHC activity and t-BHP induced cell death in cultured neurons.
9A. Inhibition of KGDHC for 24 hours with CESP did not alter oxidant induced cell death in cultured neurons. Neurons were pretreated with CESP (100 μM) and or t-BHP at 37°C for 24 hours. CESP (100 μM). In our previous studies, we demonstrated that KGHDC is still inhibited after a 24 hr treatment (Banerjee et al. 2016). In addition, oxidant induced cell death is evident after 24 hours (Shi et al. 2011). After pretreatment, cells were loaded with 0.5 μM calcein violet AM and 4 μM ethidium homodimer-1 (EthD-1) at 37°C for 30 min. Florescence signals were measured with a fluorescence microplate reader. Values are the means ± S.E.M. of relative changes over control group from two independent experiments (total 40 wells, n=10 in each group). Values with different letters vary statistically from each other (p<0.05) as determined by One-Way ANOVA followed by Student Newman-Keuls.
9B. Reduction of KGDHC activity before and during t-BHP treatment did not alter t-BHP induced cell death in cultured neurons. Neurons were infected with adenovirus to knockdown E1k (100 MOI) for 24 hours and then t-BHP was added. Cell death was assessed 24 hours later. Controls were treated with scrambled shRNA. After pretreatment, cells were loaded with 0.5 μM calcein violet AM and 4 μM ethidium homodimer-1 (EthD-1) at 37°C for 30 min. Florescent signals were measured with the fluorescence microplate reader. Values are the means ± S.E.M. of relative changes over control group from two independent experiments (total 40 wells, n=10 in each group). Values with different letters vary statistically from each other (P<0.05) as determined by One-Way ANOVA followed by Student Newman-Keuls.
Figure 10.

Manipulations of KGDHC for longer duration and oxidant induced cell death in cultured neurons
10A. Chronic reduction of KGDHC activity increased t-BHP-induced cell death in cultured neurons. Neurons from E2k+/− and wild type mice were pretreated with t-BHP (100 μM) for 24 hours. After pretreatment, cells were loaded with 0.5 μM calcein violet AM and 4 μM ethidium homodimer-1 (EthD-1) at 37°C for 30 min. Florescence signals were measured with fluorescence microplate reader. Values are the means ± S.E.M. of relative changes over control group from two independent experiments (total 121 wells; n=70 from 15 wild type mice and n=51 from 11 E2k+/− mice). Values with different letters vary statistically from each other (P<0.05) as determined by One-Way ANOVA followed by Student Newman-Keuls.
10B. Over-expression of OGDH lessened t-BHP induced cell death in cultured neurons. Cells were infected with adenovirus to overexpress OGDH (1000 MOI) for 96 hours and pretreated with oxidants for 24 hours. After infection, cells were loaded with 0.5 μM calcein violet AM and 4 μM ethidium homodimer-1 (EthD-1) at 37°C for 30 min. Florescence signals were measured with a fluorescence microplate reader. Values are the means ± S.E.M. of relative changes over control group from two independent experiments (total 32 wells, n=8 in each group). Values with different letters vary statistically from each other (P<0.05) as determined by One-Way ANOVA followed by One-Way ANOVA followed by Student Newman-Keuls.
Discussion
Whether reductions in KGDHC are beneficial or detrimental has not been established. The variety of models that we used consistently suggest that a decline for short intervals is protective, whereas longer term reductions are damaging and over expression of OGDH and increased KGDHC activity is beneficial. In vivo, chronic reduction of of KGDHC has very selective effect. Previous studies demonstrate that transgenic mice with diminished KGHC from conception have increases in oxidative stress and reduced neurogenesis (Calingasan et al. 2008). These experiments demonstrated that reducing KGDHC activity in vivo in select hippocampal regions of adult animals also diminished neurogenesis and increased oxidative stress (Figures 1 and 2). Thus, in vivo experiments consistently demonstrate that reducing KGDHC is damaging.
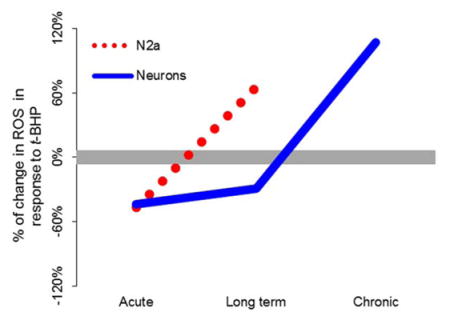
Since mechanistic studies are difficult in vivo, the interactions were tested in vitro. The in vitro experiments tested whether the role of reduced KGDHC changed with the model (N2a or neurons) or the duration (acute, long term or chronic). The results from the different models and varying durations of treatment form a simple pattern (see diagram). Mild reductions in KGDHC enhanced the ability of the cells to handle external ROS: acute in N2a (−47%, Figure 3), acute (−44%, Figure 6) and long term neurons (−29%, Figure 6). However, more severe reductions in KGDHC for longer times diminished the ability of the cells to diminish ROS: long term in N2a (+65%, Figure 3), chronic in neurons (+107%, Figure 7). This suggests that perturbation in metabolism caused by reduced KGDHC activated other antioxidant responses, so that they may respond rapidly when the oxidant was added. For example, the increase in ROS in the acute group could activate HIF or NRF2/ARE, which would initiate a series of events that would enable the neurons to buffer ROS. On the other hand, longer term reductions in KGDHC (long term in N2a’s; chronic in neurons) lessened the ability to diminish ROS generated by an externally added oxidant. This is consistent with our previous results with HEK cells that demonstrated that a longer duration in reduction of KGDHC reduces the ability of the cells to diminish ROS (Shi et al. 2005). This is consistent with the in vivo results in the E2k or E3 heterozygotes in which KGDHC activities are reduced by half. The lesions and oxidative stress following MPTP or malonate are much larger (Klivenyi et al. 2004). Further, the number of plaques in mice overexpressing mutant human amyloid precursor protein is markedly increased (Dumont et al. 2009).
The reduced KGDHC produces a global cellular response. Our previous studies examined the effects of reduced KGDHC on metabolism on cells in culture. In intact cerebellar granule neurons, specific inhibition of KGDHC] on [1-13C]glucose and [U-13C]glutamate revealed: increased α-ketoglutarate formation; increased transamination of α-ketoglutarate with valine, leucine and GABA, a new equilibrium position of the aspartate aminotransferase reaction. The findings suggest that some carbon derived from α-ketoglutarate bypasses the block in the TCA cycle at KGDHC by means of the GABA shunt and/or conversion of valine to succinate (Santos et al. 2006). This has also been tested in HEK cells deficient in E2k and their ability to metabolize 13U-glucose. The E2k deficient cells showed a greater increase in 13C labeling of alanine compared with the E2k100 cells compared to controls. This suggested an increase in glycolysis. Increased GABA shunt in the E2k67 cells was indicated by increased 13C labeling of GABA. Thus, the data are consistent with an enhanced glycolysis and GABA shunt in response to a mild reduction in KGDHC (Shi et al. 2009).
In each case, the added oxidant was t-butyrl hydroperoxide (t-BHP). Of several oxidants tested t-BHP produced the most AD like effects on bombesin-releasable calcium strores (BRCS) (Huang et al. 2005). t-BHP produces different organic free radicals (metyl, tert-butoxyl, and tert-butylperoxy radicals) by reactions with catalytically active metal ions (heme proteins, such as cytochrome P450 (Iannone et al. 1993, O’Brien 1988). t-BHP is also a substrate for glutathione peroxidase (Srivastava et al. 1974).
The results suggest that the response of internal antioxidants may be diminished by a chronic reduction in KGDHC. Glutathion is a major antioxidant. When it is oxidized, it glutathionylates proteins. For KGDHC, it is well established that glutathionylation is protective (Applegate et al. 2008). However, a large number of proteins are glutathionylated. In these studies, we used mitochondrial protein glutathionylation as a measure of changes in glutathione metabolism. Our previous results and those of others suggest that the E2k may mediate diverse responses of KGDHC suggests that glutathionylation is one possible mechanism underlying oxidative stress-induced inhibition of the TCA cycle enzymes (Shi et al. 2008, Applegate et al. 2008). The oxidant induced movement of glutathione to proteins, particularly to KGDHC, can participate in a cycle of reducing and oxidizing KGDHC (Shi et al. 2008), can be protective in mitochondria (Applegate et al. 2008) and regulate ROS production by KGDHC (Mailloux et al. 2016). Although t-BHP is not as effective as H2O2 in promoting glutathionylation, previous reports suggest it does increase glutathionyaltion (Srivastava et al. 1974) and the current results confirmed that finding (Figure 5). The acute reduction of KGDHC increased glutathionylation and this was increased further by tBHP (Figure 5). The increased glutathionylation with an acute reduction of KGDHC is consistent with the increase in ROS with acute reductions in KGDHC (Figure 3). However, long term reduction in KGDHC blunted the response to oxidant and even caused a large, but non-significant reduction in glutathionylation. This suggests that with prolonged reduction of KGDHC activity glutathione can no longer be maintained in the reduced state so it does not respond to an oxidative challenge. Thus, with long term reduction in KGDHC activity glutathionylation is no longer employed as a protective mechanism, and this may partially explain the vulnerability of cells following the prolonged reduction of KGDHC activity.
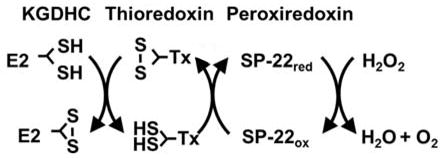
The results suggest that internal antioxidants linked to KGDHC such as thioredoxin/peroxiredoxin are depleted by the reduction in KGHDC. The beneficial effects of the over-expression of OGDH are consistent with the suggestion that KGHDC helps to keep cellular redox measures primed to respond. The interactions of KGDHC with thioredoxin/peroxiredoxin link metabolism to regulation of cell redox state. Thioredoxin is a ubiquitious thiol-disulfide oxidoreductase that participates in regulation of the cellular redox state. Peroxiredoxin oxidizes thioredoxin (Bunik & Follmann 1993, McLain et al. 2011). Oxidized thioredoxin can be reduced by free lipoic acid which, in turn, is reduced by KGDHC to complete the catalytic cycle and regenerate reduced thioredoxin. The lipoate of E2k is directly linked to the sulfur redox state of thioredoxin. Thus, less activity of KGDHC would be expected to produce less reduced lipoate to reduce thioredoxin and leave it partially oxidized. Thus, the current findings are consistent with longer periods of reduced KGDHC activity leading to a diminished thioredoxin/peroxiredoxin system.
Considerable evidence suggests that impairing peroxiredoxin/thioredoxin alters the ability to buffer external oxidants. Inhibitors of thioredoxin reductase attenuate H2O2 removal rates in mitochondria by 80%. Furthermore, a 50% lowering of H2O2 removal occurs following oxidation of peroxiredoxin. These findings implicate respiration- and thioredoxin-dependent ROS removal as a potentially important mitochondrial function that may contribute to multiple physiological and pathological processes in the brain (Drechsel & Patel 2010). Thioredoxin reductase deficiency potentiates oxidative stress, mitochondrial dysfunction and cell death in dopaminergic cells (Lopert et al. 2012). Our previous studies also reveal that impairing KGDHC increases cytochrome c release (Huang et al. 2003), which is frequently a precursor to apoptosis. This is consistent with current results showing that chronic reduction of of KGDHC activity increases cell death whereas increased activity (i.e., over-expression of OGDH diminished cell death).
An increase in bombesin releasable calcium stores occurs in fibroblasts from AD patients, with long term reduction of of KGDHC activity (Gibson et al. 2012) with select oxidants (Huang et al. 2005). The current studies show that chronic reduction of of KGDHC activity in neurons greatly exaggerated the ability of t-BHP to increase bombesin releasable calcium (an AD like effect), while increased activity produced by over-expression of OGDH greatly diminished the response (Supplementary Figure S7). In contrast, over-expression in N2a cells increased BRCS in the presence or absence of oxidant. The current results suggest that increasing KGDHC may protect the endoplasmic reticulum calcium from normal oxidants in neurons.
Our results are consistent with the observation that over-expression of OGDH enhances the ability of the cells to diminish externally added ROS. The vitamin E analogue Trolox, greatly increases KGDHC activity and enhances the ability of cultured cells to reduce externally added ROS (Gibson & Huang 2004). Increasing KGDHC is protective and maybe an important marker in screening for effective therapies for AD. However, the studies shown here are the first to examine the consequences of a specific induction of KGDHC. Multiple mitogenic therapies have been proposed for treating neurodegenerative diseases (Michel et al. 2012). However, these approaches use the electron transport chain as the end point and the response of KGDHC is not assessed. Mitogenic therapies that increase KGDHC as well as other TCA cycle mitochondrial enzymes may be the most effective clinically.
Innovation
The role of the tricarboxylic acid cycle in many neurological diseases is still unknown. Despite dramatic changes in neurodegeneration and the cycle’s central role in metabolism, the link of the cycle to neurodegeneration has not been defined. These results focused on one enzyme of the cycle, KGDHC, which is reduced in multiple diseases. The results suggest that the reduction in KGDHC may initially be protective but with longer duration it becomes damaging. Increasing KGDHC can be protective and “mitogenic” therapies that also increase KGDHC activity will be the most effective clinically.
Supplementary Material
Acknowledgments
The research was supported by NIH PP-AG14930 and the Burke Medical Research Institute. The authors would like to acknowledge the advice of Dr. Thong Ma on critical technical aspects of this research.
List of Abbreviations
- BSS
balanced salt solution
- CESP
carboxyethyl-succinylphosphonate
- DCF-AM
6-c-H2DCF-AM (6-carboxy-2′, 7′-dichloro- dihydrofluorescein diacetate, di- (acetoxymethl ester)
- GFP
green fluorescent protein
- DTT
dithiothreitol
- EGTA
Ethylene glycol tetraacetic acid
- KGDHC
α-ketoglutarate dehydrogenase complex
- OGDH
oxoglutarate dehydrogenase (gene for E1k)
- PAGE
polyacrylamide gel electrophoresis
- ROS
reactive oxygen species
- SDS
Sodium dodecyl sulfate
- TCA
Tricarboxylic acid
- t-BHP
tert-Butyl hydroperoxide
- TESP
triethylester succinyl phosphonate
- TRX-2
thioredoxin-2
Footnotes
Author Disclosure Statement
None of the authors have any commercial associations that conflict with the manuscript.
References
- Applegate MAB, Humphries KM, Szweda LI. Reversible Inhibition of α-Ketoglutarate Dehydrogenase by Hydrogen Peroxide: Glutathionylation and Protection of Lipoic Acid. Biochemistry. 2008;47:473–478. doi: 10.1021/bi7017464. [DOI] [PubMed] [Google Scholar]
- Banerjee K, Munshi S, Xu H, et al. Mild mitochondrial metabolic deficits by α-ketoglutarate dehydrogenase inhibition cause prominent changes in intracellular autophagic signaling: Potential role in the pathobiology of Alzheimer’s disease. Neurochemistry International. 2016;96:32–45. doi: 10.1016/j.neuint.2016.02.011. [DOI] [PMC free article] [PubMed] [Google Scholar]
- Bateman RJ, Xiong C, Benzinger TLS, et al. Clinical and Biomarker Changes in Dominantly Inherited Alzheimer’s Disease. New England Journal of Medicine. 2012;367:795–804. doi: 10.1056/NEJMoa1202753. [DOI] [PMC free article] [PubMed] [Google Scholar]
- Bunik V, Follmann H. Thioredoxin reduction dependent on α-ketoacid oxidation by α-ketoacid dehydrogenase complexes. FEBS Letters. 1993;336:197–200. doi: 10.1016/0014-5793(93)80801-z. [DOI] [PubMed] [Google Scholar]
- Bunik V, Kaehne T, Degtyarev D, Shcherbakova T, Reiser G. Novel isoenzyme of 2-oxoglutarate dehydrogenase is identified in brain, but not in heart. FEBS Journal. 2008;275:4990–5006. doi: 10.1111/j.1742-4658.2008.06632.x. [DOI] [PubMed] [Google Scholar]
- Bunik V, Raddatz G, Strumilo S. Translating Enzymology into Metabolic Regulation: The Case of the 2- Oxoglutarate Dehydrogenase Multienzyme Complex. Current Chemical Biology. 2013;7:74–93. [Google Scholar]
- Bunik VI, Denton TT, Xu H, Thompson CM, Cooper AJL, Gibson GE. Phosphonate Analogues of α-Ketoglutarate Inhibit the Activity of the α-Ketoglutarate Dehydrogenase Complex Isolated from Brain and in Cultured Cells†. Biochemistry. 2005;44:10552–10561. doi: 10.1021/bi0503100. [DOI] [PubMed] [Google Scholar]
- Calingasan NY, Ho DJ, Wille EJ, et al. Influence of mitochondrial enzyme deficiency on adult neurogenesis in mouse models of neurodegenerative diseases. Neuroscience. 2008;153:986–996. doi: 10.1016/j.neuroscience.2008.02.071. [DOI] [PMC free article] [PubMed] [Google Scholar]
- Drechsel DA, Patel M. Respiration-dependent H2O2 Removal in Brain Mitochondria via the Thioredoxin/Peroxiredoxin System. Journal of Biological Chemistry. 2010;285:27850–27858. doi: 10.1074/jbc.M110.101196. [DOI] [PMC free article] [PubMed] [Google Scholar]
- Dumont M, Ho DJ, Calingasan NY, Xu H, Gibson G, Beal MF. Mitochondrial dihydrolipoyl succinyltransferase deficiency accelerates amyloid pathology and memory deficit in a transgenic mouse model of amyloid deposition. Free Radical Biology and Medicine. 2009;47:1019–1027. doi: 10.1016/j.freeradbiomed.2009.07.008. [DOI] [PMC free article] [PubMed] [Google Scholar]
- Furst AJ, Rabinovici GD, Rostomian AH, Steed T, Alkalay A, Racine C, Miller BL, Jagust WJ. Cognition, glucose metabolism and amyloid burden in Alzheimer’s disease. Neurobiology of Aging. 2012;33:215–225. doi: 10.1016/j.neurobiolaging.2010.03.011. [DOI] [PMC free article] [PubMed] [Google Scholar]
- Gibson G, Huang HM. Mitochondrial Enzymes and Endoplasmic Reticulum Calcium Stores as Targets of Oxidative Stress in Neurodegenerative Diseases. J Bioenerg Biomembr. 2004;36:335–340. doi: 10.1023/B:JOBB.0000041764.45552.f3. [DOI] [PubMed] [Google Scholar]
- Gibson GE, Chen HL, Xu H, Qiu L, Xu Z, Denton TT, Shi Q. Deficits in the mitochondrial enzyme α-ketoglutarate dehydrogenase lead to Alzheimer’s disease-like calcium dysregulation. Neurobiology of Aging. 2012;33:1121e1113–1121.e1124. doi: 10.1016/j.neurobiolaging.2011.11.003. [DOI] [PMC free article] [PubMed] [Google Scholar]
- Gibson GE, Hirsch JA, Cirio RT, Jordan BD, Fonzetti P, Elder J. Abnormal thiamine-dependent processes in Alzheimer’s Disease. Lessons from diabetes. Molecular and Cellular Neuroscience. 2013;55:17–25. doi: 10.1016/j.mcn.2012.09.001. [DOI] [PMC free article] [PubMed] [Google Scholar]
- Gibson GE, Sheu KR, Blass JP, et al. Reduced activities of thiamine-dependent enzymes in the brains and peripheral tissues of patients with Alzheimer’s Disease. Archives of Neurology. 1988a;45:836–840. doi: 10.1001/archneur.1988.00520320022009. [DOI] [PubMed] [Google Scholar]
- Gibson GE, Sheu KR, Blass JP, et al. REduced activities of thiamine-dependent enzymes in the brains and peripheral tissues of patients with alzheimer's disease. Archives of Neurology. 1988b;45:836–840. doi: 10.1001/archneur.1988.00520320022009. [DOI] [PubMed] [Google Scholar]
- Hellwig S, Frings L, Bormann T, Kreft A, Amtage F, Spehl TS, Weiller C, Tüscher O, Meyer PT. Neural correlates of cognitive dysfunction in Lewy body diseases and tauopathies: Combined assessment with FDG-PET and the CERAD test battery. Brain and Language. 2013;127:307–314. doi: 10.1016/j.bandl.2013.10.004. [DOI] [PubMed] [Google Scholar]
- Huang HM, Chen HL, Xu H, Gibson GE. Modification of endoplasmic reticulum Ca2+ stores by select oxidants produces changes reminiscent of those in cells from patients with Alzheimer disease. Free Radical Biology and Medicine. 2005;39:979–989. doi: 10.1016/j.freeradbiomed.2005.05.017. [DOI] [PubMed] [Google Scholar]
- Huang HM, Ou HC, Xu H, Chen HL, Fowler C, Gibson GE. Inhibition of α-ketoglutarate dehydrogenase complex promotes cytochrome c release from mitochondria, caspase-3 activation, and necrotic cell death. Journal of Neuroscience Research. 2003;74:309–317. doi: 10.1002/jnr.10756. [DOI] [PubMed] [Google Scholar]
- Bunik IV, Raddatz G, Strumilo S. Translating Enzymology into Metabolic Regulation: The Case of the 2- Oxoglutarate Dehydrogenase Multienzyme Complex. Current Chemical Biology. 2013;7:74–93. [Google Scholar]
- Iannone A, Marconi A, Zambruno G, Giannetti A, Vannini V, Tomasi A. Free Radical Production During Metabolism of Organic Hydroperoxides by Normal Human Keratinocytes. Journal of Investigative Dermatology. 1993;101:59–63. doi: 10.1111/1523-1747.ep12359510. [DOI] [PubMed] [Google Scholar]
- Ito E, Oka K, Etcheberrigaray R, Nelson TJ, McPhie DL, Tofel-Grehl B, Gibson GE, Alkon DL. Internal Ca2+ mobilization is altered in fibroblasts from patients with Alzheimer disease. Proceedings of the National Academy of Sciences. 1994;91:534–538. doi: 10.1073/pnas.91.2.534. [DOI] [PMC free article] [PubMed] [Google Scholar]
- Jack CR, Jr, Knopman DS, Jagust WJ, et al. Tracking pathophysiological processes in Alzheimer’s disease: an updated hypothetical model of dynamic biomarkers. The Lancet Neurology. 2013;12:207–216. doi: 10.1016/S1474-4422(12)70291-0. [DOI] [PMC free article] [PubMed] [Google Scholar]
- Kabysheva MS, Storozhevykh TP, Pinelis VG, Bunik VI. Synthetic regulators of the 2-oxoglutarate oxidative decarboxylation alleviate the glutamate excitotoxicity in cerebellar granule neurons. Biochemical Pharmacology. 2009;77:1531–1540. doi: 10.1016/j.bcp.2009.02.001. [DOI] [PubMed] [Google Scholar]
- Klivenyi P, Starkov AA, Calingasan NY, et al. Mice deficient in dihydrolipoamide dehydrogenase show increased vulnerability to MPTP, malonate and 3-nitropropionic acid neurotoxicity. Journal of Neurochemistry. 2004;88:1352–1360. doi: 10.1046/j.1471-4159.2003.02263.x. [DOI] [PubMed] [Google Scholar]
- Lopert P, Day BJ, Patel M. Thioredoxin reductase deficiency potentiates oxidative stress, mitochondrial dysfunction and cell death in dopaminergic cells. PloS one. 2012;7:e50683. doi: 10.1371/journal.pone.0050683. [DOI] [PMC free article] [PubMed] [Google Scholar]
- Mailloux RJ, Craig Ayre D, Christian SL. Induction of mitochondrial reactive oxygen species production by GSH mediated S-glutathionylation of 2-oxoglutarate dehydrogenase. Redox Biology. 2016;8:285–297. doi: 10.1016/j.redox.2016.02.002. [DOI] [PMC free article] [PubMed] [Google Scholar]
- McLain AL, Szweda PA, Szweda LI. α-Ketoglutarate dehydrogenase: A mitochondrial redox sensor. Free Radical Research. 2011;45:29–36. doi: 10.3109/10715762.2010.534163. [DOI] [PMC free article] [PubMed] [Google Scholar]
- Michel S, Wanet A, De Pauw A, Rommelaere G, Arnould T, Renard P. Crosstalk between mitochondrial (dys)function and mitochondrial abundance. Journal of Cellular Physiology. 2012;227:2297–2310. doi: 10.1002/jcp.23021. [DOI] [PubMed] [Google Scholar]
- Mosconi L. Brain glucose metabolism in the early and specific diagnosis of Alzheimer’s disease. Eur J Nucl Med Mol Imaging. 2005;32:486–510. doi: 10.1007/s00259-005-1762-7. [DOI] [PubMed] [Google Scholar]
- Nilsen LH, Shi Q, Gibson GE, Sonnewald U. Brain [U-13C]glucose metabolism in mice with decreased α-ketoglutarate dehydrogenase complex activity. Journal of Neuroscience Research. 2011;89:1997–2007. doi: 10.1002/jnr.22606. [DOI] [PMC free article] [PubMed] [Google Scholar]
- O’Brien PJ. Radical formation during the peroxidase catalyzed metabolism of carcinogens and xenobiotics: The reactivity of these radicals with GSH, DNA, and unsaturated lipid. Free Radical Biology and Medicine. 1988;4:169–183. doi: 10.1016/0891-5849(88)90025-1. [DOI] [PubMed] [Google Scholar]
- Onoue T, Goto M, Tominaga T, et al. Reactive oxygen species mediate insulin signal transduction in mouse hypothalamus. Neuroscience Letters. 2016;619:1–7. doi: 10.1016/j.neulet.2016.03.011. [DOI] [PubMed] [Google Scholar]
- Park LCH, Calingasan NY, Sheu KFR, Gibson GE. Quantitative α-Ketoglutarate Dehydrogenase Activity Staining in Brain Sections and in Cultured Cells. Analytical Biochemistry. 2000;277:86–93. doi: 10.1006/abio.1999.4359. [DOI] [PubMed] [Google Scholar]
- Quinlan CL, Goncalves RLS, Hey-Mogensen M, Yadava N, Bunik VI, Brand MD. The 2-Oxoacid Dehydrogenase Complexes in Mitochondria Can Produce Superoxide/Hydrogen Peroxide at Much Higher Rates Than Complex I. Journal of Biological Chemistry. 2014;289:8312–8325. doi: 10.1074/jbc.M113.545301. [DOI] [PMC free article] [PubMed] [Google Scholar]
- Santos SS, Gibson GE, Cooper AJL, Denton TT, Thompson CM, Bunik VI, Alves PM, Sonnewald U. Inhibitors of the α-ketoglutarate dehydrogenase complex alter [1-13C]glucose and [U-13C]glutamate metabolism in cerebellar granule neurons. Journal of Neuroscience Research. 2006;83:450–458. doi: 10.1002/jnr.20749. [DOI] [PubMed] [Google Scholar]
- Shi Q, Chen HL, Xu H, Gibson GE. Reduction in the E2k Subunit of the α-Ketoglutarate Dehydrogenase Complex Has Effects Independent of Complex Activity. Journal of Biological Chemistry. 2005;280:10888–10896. doi: 10.1074/jbc.M409064200. [DOI] [PubMed] [Google Scholar]
- Shi Q, Risa Ø, Sonnewald U, Gibson GE. Mild reduction in the activity of the α-ketoglutarate dehydrogenase complex elevates GABA shunt and glycolysis. Journal of Neurochemistry. 2009;109:214–221. doi: 10.1111/j.1471-4159.2009.05955.x. [DOI] [PMC free article] [PubMed] [Google Scholar]
- Shi Q, Xu H, Kleinman WA, Gibson GE. Novel functions of the α-ketoglutarate dehydrogenase complex may mediate diverse oxidant-induced changes in mitochondrial enzymes associated with Alzheimer’s disease. Biochimica et Biophysica Acta (BBA) - Molecular Basis of Disease. 2008;1782:229–238. doi: 10.1016/j.bbadis.2007.12.008. [DOI] [PMC free article] [PubMed] [Google Scholar]
- Shi Q, Xu H, Yu H, Zhang N, Ye Y, Estevez AG, Deng H, Gibson GE. Inactivation and Reactivation of the Mitochondrial α-Ketoglutarate Dehydrogenase Complex. Journal of Biological Chemistry. 2011;286:17640–17648. doi: 10.1074/jbc.M110.203018. [DOI] [PMC free article] [PubMed] [Google Scholar]
- Srivastava SK, Awasthi YC, Beutler E. Useful agents for the study of glutathione metabolism in erythrocytes. Organic hydroperoxides. Biochemical Journal. 1974;139:289–295. doi: 10.1042/bj1390289. [DOI] [PMC free article] [PubMed] [Google Scholar]
- Starkov AA, Fiskum G, Chinopoulos C, Lorenzo BJ, Browne SE, Patel MS, Beal MF. Mitochondrial α-Ketoglutarate Dehydrogenase Complex Generates Reactive Oxygen Species. The Journal of Neuroscience. 2004;24:7779–7788. doi: 10.1523/JNEUROSCI.1899-04.2004. [DOI] [PMC free article] [PubMed] [Google Scholar]
- Svenningsson P, Westman E, Ballard C, Aarsland D. Cognitive impairment in patients with Parkinson’s disease: diagnosis, biomarkers, and treatment. The Lancet Neurology. 2012;11:697–707. doi: 10.1016/S1474-4422(12)70152-7. [DOI] [PubMed] [Google Scholar]
- Tretter L, Adam-Vizi V. Generation of Reactive Oxygen Species in the Reaction Catalyzed by α-Ketoglutarate Dehydrogenase. The Journal of Neuroscience. 2004;24:7771–7778. doi: 10.1523/JNEUROSCI.1842-04.2004. [DOI] [PMC free article] [PubMed] [Google Scholar]
- Túnez I, Sánchez-López F, Agüera E, Fernández-Bolaños R, Sánchez FM, Tasset-Cuevas I. Important Role of Oxidative Stress Biomarkers in Huntington’s Disease. Journal of Medicinal Chemistry. 2011;54:5602–5606. doi: 10.1021/jm200605a. [DOI] [PubMed] [Google Scholar]
- Unschuld PG, Edden RAE, Carass A, et al. Brain metabolite alterations and cognitive dysfunction in early Huntington’s disease. Movement Disorders. 2012;27:895–902. doi: 10.1002/mds.25010. [DOI] [PMC free article] [PubMed] [Google Scholar]
- Yang L, Shi Q, Ho DJ, et al. Mice deficient in dihydrolipoyl succinyl transferase show increased vulnerability to mitochondrial toxins. Neurobiology of disease. 2009;36:320–330. doi: 10.1016/j.nbd.2009.07.023. [DOI] [PMC free article] [PubMed] [Google Scholar]
Associated Data
This section collects any data citations, data availability statements, or supplementary materials included in this article.