Abstract
Mn/Zn ethylene-bis-dithiocarbamate (Mn/Zn-EBDC) fungicides are among some the most widely-used fungicides in the world. Although they have been available for over 50 years, little is known about their mechanism of action in fungi, or their potentially toxic mechanisms in humans. To determine if exposure of Caenorhabditis elegans (C. elegans) to a representative fungicide (Manzate; MZ) from this group inhibits mitochondria or produces reactive oxygen species (ROS), we acutely (30 min) exposed worms to various MZ concentrations. Initial oxygen consumption studies showed an overall statistically significant decrease in oxygen consumption associated with addition of Complex I- and/or II-substrate in treatment groups compared to controls (*p < 0.05). In order to better characterize the individual complex activity, further studies were completed that specifically assessed Complex II or Complex IV. Data indicated that neither of these two complexes were targets of MZ treatment. Results from tetramethylrhodamine ethyl ester (proton gradient) and ATP assays showed statistically significant reductions in both endpoints (*p < 0.05, **p < 0.01, respectively). Additional studies were completed to determine if MZ treatment also resulted in increased ROS production. These assays provided evidence that hydrogen peroxide, but not superoxide or hydroxyl radical levels were statistically significantly increased (*p < 0.05). Taken together, these data indicate exposure of C. elegans to MZ concentrations to which humans are exposed leads to mitochondrial inhibition and concomitant hydrogen peroxide production. Since mitochondrial inhibition and increased ROS are associated with numerous neurodegenerative diseases, we suggest further studies to determine if MZ catalyzes similar toxic processes in mammals.
Keywords: Mancozeb, manzate, C. elegans, mitochondrial inhibition, reactive oxygen species, hydrogen peroxide
1.0. Introduction
While epidemiology studies have shown a link between Parkinson’s disease (PD) and exposure to paraquat and maneb (Costello et al., 2009), the use of maneb (Mn ethylene-bis-dithiocarbamate) has declined in recent years due to its withdrawal from the pesticide market (Billingslea, 2009; Nevola, 2011). This has resulted in increased market shares of mancozeb-containing fungicides (USGS, 2013). Mancozeb (Mn/Zn ethylene-bis-dithiocarbamate; Mn/Zn-EBDC) is the active ingredient in such fungicides as Manzate (MZ), and it is widely sold throughout the United States. It is most-commonly applied to vegetables and fruit (Bonide, 2010), and is used in both commercial agricultural and household settings. As with most pesticides, formulations are available in a variety of strengths, from ‘ready-to-apply’ to highly concentrated solutions that require dilution before application (Bonide, 2010).
Documented cases of movement abnormalities attributed to neurotoxicity following acute exposure to commercially available maneb or mancozeb formulations have been reported for decades (Colosio et al., 1996; Erro et al., 2011; Israeli et al., 1983a, b). Recognition of the potential toxicity of MZ and maneb led to studies involving the active ingredient. For example, treatment of mesencephalic cell cultures with Mn/Zn-EBDC leads to activation of voltage-gated potassium channels (Li et al., 2013), and production of reactive oxygen species (ROS) and mitochondrial inhibition (Domico et al., 2007; Domico et al., 2006). Other studies indicate that Mn/Zn-EBDC catalyzes ROS formation in vitro (Fitsanakis et al., 2002), and leads to mitochondrial inhibition in isolated mitochondria from treated rats (Zhang et al., 2003). More recently, however, studies show that exposure to commercially-available formulations of MZ lead to behavioral deficits (Harrison Brody et al., 2013) and neurodegeneration (Negga et al., 2011; Negga et al., 2012) in Caenorhabditis elegans (C. elegans).
While previous data generated using Mn/Zn-EBDC showed in vitro ROS production (Calviello et al., 2006; Domico et al., 2007) these results have not been replicated in vivo. Numerous cellular probes exist to determine whether specific ROS, i.e., superoxide, hydrogen peroxide, or hydroxyl radical, are produced in vitro, and these techniques can be modified for use in C. elegans because they are transparent. Although careful interpretation of data is required (Winterbourn, 2014), when multiple probes with different affinities to specific ROS are used to assess production, this method can be useful in identifying the probable ROS species. The same is true of assays designed to detect inhibition of mitochondrial electron transport chain complexes (Grad et al., 2007). By combining multiple techniques, we assayed both mitochondrial function and oxidative stress to determine if exposure to a commercial formation of MZ would result in either of these toxic responses in C. elegans. Thus, by elucidating the potential site of mitochondrial inhibition at the respiratory complexes and the putative oxidative species involved, this work anticipates shedding light on mechanisms responsible for the observed toxicity of this organometallic fungicide.
2.0. Materials and Methods
2.1. Worm and Escherichia coli strains
Wild-type (N2) and CL2166 nematodes, as well as NA22 Escherichia coli (E. coli) and OP50-1 E. coli, were provided by the Caenorhabditis Genetics Center (CGC). CL2166 worms (dvIs19 [(pAF15)gst-4p::GFP::NLS] III) are genetically modified such that a green fluorescent protein gene (gfp) is fused with a nuclear localization sequence driven by the promoter for the glutathione-S-transferase gene, gst-4p. This construct results in a strain that shows increased fluorescence in the presence of oxidative stress (Leiers et al., 2003). Concentrated (37%) Mancozeb Flowable with Zinc (Bonide, Oriskany, NY) was purchased at a local lawn and garden store.
2.2. Synchronization
C. elegans strains were maintained at 20°C and synchronized according to standard protocols (Brenner, 1974), and as previously published (Negga et al., 2011). Briefly, C. elegans were grown on 8P plates (51.3 mM NaCl, 25.0 g bactoagar/L, 20.0 g bactopeptone/L, 1mM CaCl2, 0.5 mM KH2PO4 (pH 6), 0.013 mM cholesterol (dissolved in 95% ethanol), 1mM MgSO4) with a lawn of NA22 E. coli (grown in 16 g tryptone/L, 10 g yeast extract/L, 85.5 mM NaCl) until gravid. Nematodes were then washed from plates into 15-mL conical vials using sterile dH2O, and treated with a bleaching solution (0.55% NaOCl, 0.5 mM NaOH) permitting the release of eggs from gravid hermaphrodites. The egg/bleach mixture was diluted and washed 3X with M9 solution (20 mM KH2PO4, 40 mM Na2HPO4, 68 mM NaCl) prior to addition of 30% sucrose to facilitate isolation of eggs via centrifugation. Once removed, eggs were placed in a separate 15-mL conical tube, and washed 3X with sterile dH2O and centrifuged. The dH2O was then replaced with M9, and eggs were stored at 20°C on a nutator for 18 h. At the time of treatment, worms are in a starved state in the first larval stage.
2.3. Treatments
Following independent synchronizations on separate days, 5000 worms per treatment group (n = 3 treatment groups/treatment concentration/synchronization) were exposed to various concentrations of the commercially-available fungicide, Manzate (MZ), all of which were within the application range recommended by the manufacturer (Bonide, 2010). Based on previous lethality and neurodegeneration studies (Negga et al., 2011; Negga et al., 2012), the following final concentrations were used: 0.1% Mn/Zn-EBDC as MZ, 7.5% Mn/Zn-EBDC as MZ, or 17.0% Mn/Zn-EBDC as MZ. In addition to encompassing a range of concentrations to which humans could be exposed (Bonide, 2010), these also included concentrations on either side of the LD50 in worms (Negga et al., 2011). Furthermore, all concentrations used in these studies and following the same treatment protocol have shown evidence of neurodegeneration in C. elegans (Negga et al, 2011; Negga et al., 2012, Harrison Brody et al., 2013). All final concentrations were made by diluting the stock solution (37% Mn/Zn-EBDC) with dH2O, as directed by the manufacturer. The final volume of each treatment vial was always maintained at 1000 μL of solution (water, worms, and MZ), with a total of 5000 worms in each microcentrifuge tube. To facilitate comparison of our results with other Mn/Zn-EBDC fungicides, concentrations are reported as percent active ingredient (Mn/Zn-EBDC) rather than percent commercial formulation (Negga et al., 2011; Negga et al., 2012). The worms were exposed to the various concentrations for 30 min, washed with sterile dH2O to remove residual MZ, and subsequently placed on nematode growth media plates (NGM; 51.3 mM NaCl, 17.0 g bactoagar/L, 2.5 g bactopeptone/L, 1 mM CaCl2, 1 mM MgSO4, 0.5 mM KH2PO4 (pH 6.0), 12.9 mM cholesterol (95% ethanol), 1.25 mL nystatin/L, 0.2 g streptomycin/L) with a lawn of OP50-1 E. coli. Washed worms were then incubated (without MZ) for 24 h at 20° C. Respective assays for each endpoint were then carried out.
Since concentrated MZ formulations are diluted with H2O to the proper application concentration (Bonide, 2010), control worms were treated with sterile dH2O. Following the incubation period, control worms were also assessed for mitochondrial function or ROS production.
2.4. Mitochondrial Assays
2.4.1. Complex I- and II-stimulated mitochondrial oxygen consumption
Following MZ treatment, nematodes were washed from plates with sterile M9 into 15-mL conical vials, centrifuged, and washed an additional 3X to remove bacteria and residual MZ. After final washing, live worms were counted and normalized to yield 10 nematodes/μL per treatment group. Worms and M9 were added to heated (22°C) water bath chambers (YSI 5301B Standard Bath) and an oxygen probe (YSI 5304) was inserted and equilibrated to 100% oxygen in the sample chamber. Measurements were recorded every ten seconds. After an initial ten minute recording period to allow for equilibration, Complex I respiration was stimulated by injection of 100 mM glutamate into the assay chamber per modified published protocols (Grad et al., 2007). Fifteen minutes post-glutamate addition, Complex II respiration was stimulated by injection of 100 mM sodium succinate into the assay chamber per modified published protocols (Grad et al., 2007).
2.4.2. Fixation and permeabilization of C. elegans
Similar to the protocol published by Grad et al. (2007), during the process of fixation and permeabilization, C. elegans were washed from plates and placed in microcentrifuge tubes with M9 buffer solution. Worms were centrifuged and washed with dH2O. After a subsequent centrifugation to pellet worms, supernatant was removed, and pellet was placed on ice where 500 μL ice-cold 2X Modified Ruvkun’s Witches Brew (MRWB; 160 mM KCl, 40 mM NaCl, 20 mM Na2EGTA (ethylene glycol tetra-acetic acid), 10 mM spermidine HCl, 30 mM Na-PIPES (piperazine-N,N′-bis-(2-ethanesulfonic acid)) pH 7.4, 50% methanol), 400 μL dH2O, and 100 μL 20% (w/v) paraformaldehyde was added to the microcentrifuge tubes. Tubes with worms were vortexed, and incubated for 35 min at 4°C with constant nutation. Fixed worms were centrifuged and washed 2X with a Tris-Triton buffer (TTB; 10 mM Tris (pH 7.4), 100 mM NaCl, 1 mM EDTA (ethylenediaminetetraacetic acid), 1 mM EGTA, 1% Triton X-100, 10% glycerol and 0.1% sodium dodecylsulfate). Following fixation, the worms were incubated with TTB and 1% (v/v) β-mercaptoethanol, and incubated for 15 min at room temperature with constant mixing. Worms were then centrifuged and washed in borate buffer (100 mM boric acid, 75 mM NaCl, 25 mM sodium tetraborate, pH 8.4), then incubated with 10 mM dithiothreitol for 15 min. Worms were centrifuged and washed 2X with phosphate buffered saline (PBS), pH 7.4. Finally, all but 200μL of the supernatant was removed prior to the performing the respective chromophore-based assays. Although this protocol is inappropriate for mammalian cell or tissue culture, the highly structured collagen scaffold, insoluble glycoproteins proteins, and lipids that compose the protective cuticle of C. elegans require these conditions. Care must be taken, however, to adhere to the incubation times to prevent damage to the electron transport chain enzyme complexes.
2.4.3. Complex II activity
Similar to the Complex I assay, following acute MZ treatment, worms were washed with sterile dH2O from NGM plates. Afterwards, samples were normalized to contain 1,000 live nematodes/mL per treatment concentration. Following fixation and permeabilization (see Section 2.4.2), Complex II activity was assayed using 5 mM EDTA, 1mM KCN, 0.2 mM phenazine methosulfate, 50 mM sodium succinate, 0.25 mM nitroblue tetrazolium (NBT) in 10 mL PBS (Grad et al., 2007). In order to verify that the assay measured succinate dehydrogenase activity, a negative control was included that contained 100 mM sodium malonate, but no sodium succinate. After incubation in the assay solution, stained nematodes were washed 3X and counted to yield 1 worm/μL, per treatment group. A total of 250 worms were pipetted into a 96-well plate, and absorbance was read at 560 nm using a Promega® GloMax-Multi+ Detection System (Promega Corporation, Madison, WI).
2.4.4. Complex IV activity
Similar to Complex II preparation, worms were washed with sterile dH2O and counted to yield 1,000 nematodes/mL per treatment group. Following fixation and permeabilization, Complex IV activity was assayed using 0.1% (w/v) 3,3′-diaminobenzidine (DAB), 0.1% (w/v) cytochrome c, 0.02% (w/v) catalase in 10 mL PBS (Grad et al., 2007). Similar to the Complex II assay, a negative control was used containing 50 mM KCN in the absence of cytochrome c. After incubation in assay solution, stained nematodes were read at 450 nm as described in Section 2.4.3.
2.4.5. Proton gradient integrity
Following MZ treatment, nematodes were washed 2X with sterile dH2O, and once with M9. After final washing, live nematodes were counted and standardized at 1,000 nematodes/mL per treatment group. In order to determine proton gradient integrity, nematodes were assayed using a final concentration of 50 μM tetramethylrhodamine ethyl ester (TMRE; Biotium, Hayward, CA) in dimethyl sulfoxide (DMSO). C. elegans were incubated for 1 h, and then washed 3X with sterile dH2O. Afterwards, they were photographed using a digital camera attached to a fluorescence microscope (see Section 2.7).
2.4.6. Relative ATP amount and verification of live worms
Following MZ treatment, nematodes were washed as described. Worms were then counted to yield 10 live nematodes/μL per treatment group, and 200 μL (200 worms) was added to each well. Per the protocol provided by Promega, relative ATP concentration was measured using the Promega Mitochondrial ToxGlo™ Assay (Promega Corporation, Madison, WI). Initially, 20 μL of a fluorogenic peptide substrate, provided in the ToxGlo™ assay kit (Promega Corporation, Madison, WI) was added, and incubated at 20°C for 60 min to determine percent live worms compared to control. Fluorescence was measured at an excitation wavelength of 495 nmEx and an emission wavelength of 520–530 nmEm using a Promega® GloMax-Multi+ Detection System. Next, 100 μL of a luciferin-containing ATP detection reagent, also provided in the ToxGlo™ assay kit (Promega Corporation, Madison, WI), was added to each well and incubated at room temperature for 15 min. Luminescence was measured using the Promega® GloMax-Multi+ Detection System.
2.5. Reactive oxygen species detection
2.5.1. Superoxide detection
As previously described, treated nematodes were washed with sterile dH2O and normalized to 5,000 live worms/mL for each treatment group. Worms were placed in 1.5-mL microcentrifuge tubes and centrifuged to promote sedimentation of worms, then 10 μL of supernatant was removed and replaced with 10 μL of 0.5 mM dihydroethidium (DHE; Merck KGaA, Darmstadt, Germany) for a final concentration of 0.25 mM DHE. C. elegans were incubated for 3 h, and then washed 3X with sterile dH2O. Afterwards, they were photographed using a digital camera attached to a fluorescence microscope (see Section 2.7).
2.5.2. Hydrogen peroxide detection
Following MZ treatment, nematodes were washed with sterile dH2O and counted to yield an average of 4 live nematodes/μL per treatment group. A total of 200 nematodes per control or treatment group were loaded into each well of a 96-well plate. To the negative control, 50 μL of 1X reaction buffer supplied with the Amplex® Red kit (Life Technologies, Grand Island, NY) was added, while the positive control also had 50 μL of 10 μM H2O2. Next, 50 μL of the Amplex® Red mixture was added to all groups. The plate was covered with aluminum foil, to protect the reaction mixture from light, placed on a nutator, and incubated at room temperature for 1 h. Afterwards, fluorescence was read at an excitation wavelength of 525 nmEx and an emission wavelength of 580–640 nmEm using a Promega® GloMax-Multi+ Detection System.
2.5.3. Hydroxyl radical detection
Following 30 min treatment of various MZ concentrations, nematodes were washed with sterile dH2O, and live nematodes were counted to yield 1,000 nematodes/mL per treatment group. Worms were placed in 2.0-mL microcentrifuge tubes with 500 μL of the hydroxyphenyl fluorescein probe (HPF; Life Sciences, Grand Island, NY) and 500 μL of worms. Each group was vortexed and incubated for 1.5 h at 20°C. Following incubation, worms were washed 3X, and counted again to yield 1 live nematode/μL per treatment group. A total of 200 nematodes/well were then added to a 96-well plate, and fluorescence was read at an excitation wavelength of 490 nmEx and an emission wavelength of 510–570 nmEm using a Promega® GloMax-Multi+ Detection System.
2.6. GST Up-regulation
In order to determine if up-regulation of glutathione-S-transferase (GST), an enzyme that facilitates the conjugation of reduced glutathione to electrophilic xenobiotics, occurred following MZ exposure, CL2166 (dvIs19[pAF15(gst-4::gfp::NLS)] III) worms were treated with varying concentrations of MZ. Following exposure, worms from each treatment group were photographed using a digital camera attached to a fluorescence microscope (see Section 2.7).
2.7. Fluorescence microscopy
For studies involving TMRE fluorescence or GFP fluorescence in CL2166 worms, photomicrographs were taken of nematodes on a 4% agarose pad similar to the protocol already published (Negga et al., 2012). Worms were imaged using a fluorescence microscope (Leitz & Wetzlar, Halco Instruments, Inc.) equipped with a 50-W AC mercury source lamp (E. Leitz, Rockleigh, NJ) and 40X objective (Leitz & Wetzlar, Halco Instruments, Inc.). The microscope was coupled to a digital camera (Micrometrics, MilesCo Scientific, Princeton, MN) operated by Micrometrics software (SE Premium, v2.7). Images were obtained under identical exposure time, gain, gamma, saturation, and color gain. Photomicrographs were then imported into Adobe Photoshop 6.0.1, to determine red (TMRE) or green (GFP::GST) pixel intensity + standard deviation (SD).
2.8. Statistical analysis
All data were analyzed using GraphPad Prism (version 4.03 for Windows, GraphPad Software, San Diego California USA, www.graphpad.com). For Complex I- and II-stimulated mitochondrial respiration studies, data are presented as mean + standard error of the mean (SEM) and represent N ≥ 4 separate synchronizations, with 15,000 worms (n > 3) per intra-experimental replicates. Following normalization to percent oxygen consumption at the conclusion of each segment, differences in slope were determined using linear regression followed by one-way analysis of variance (ANOVA) of the regression lines. If the ANOVA resulted in an overall significant p value (p < 0.05), a post-hoc Bonferroni test was performed.
Absorbance data from Complex II and Complex IV assays are represented as mean + SEM, and represent N ≥ 4 separate synchronizations, of at least 750 nematodes per intra-experimental replication (n ≥ 3), per treatment paradigm. Differences in absorbance were determined using one-way ANOVA, followed by a post-hoc Bonferroni test. Luminescence and fluorescence data from Mitochondrial ToxGlo™ assays are represented as mean ± SEM and represent N ≥ 3 separate synchronizations, of at least 500 nematodes per intra-experimental replication (n ≥ 3), per each treatment paradigm. Differences in luminescence or fluorescence were determined using ANOVA, followed by a post-hoc Bonferroni test.
For TMRE and GST regulation studies, pixel intensity of individual worms was measured. Data are represented as mean + SEM and represent N ≥ 3 separate synchronizations, of at least three replicates (n ≥ 3) per treatment group with at least eight worms per analysis. Differences in pixel number were analyzed by one-way ANOVA, followed by a post-hoc Bonferroni test. For all studies, data from treatment groups were considered to be statistically significantly different from control when p < 0.05.
3.0. Results
3.1. Decreased Complex I- and II-stimulated mitochondrial respiration
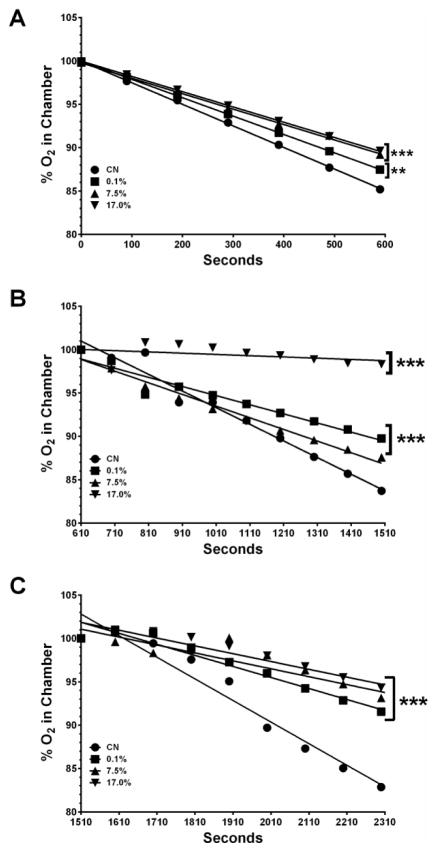
To assess the effect that acute exposure of worms to MZ had on Complex I- and Complex II-stimulated mitochondrial respiration, oxygen consumption in whole worms was determined during an equilibration period, following the addition of glutamate (Complex I), and following the addition of succinate (Complex II; Figure 1A–1C). Linear regression analysis of data collected during the initial equilibration period (Figure 1A) indicated that oxygen consumption from all treatment groups was statistically significantly decreased relative to control (**p < 0.01, ***p < 0.001, or ***p < 0.001, respectively). The percentage of oxygen consumed during this phase, and the corresponding concentrations are presented in Table 1. When oxygen consumption was stimulated with glutamate (Figure 1B), worms exposed to only the lowest (0.1%) or highest (17%) concentrations of the fungicide showed a statistically significant decrease in oxygen consumed compared to control (***p < 0.001). Furthermore, succinate–stimulated (Complex II) respiration (Figure 1C) indicated a statistically significant decrease in oxygen consumption compared to control (***p < 0.001) for all three treatment groups. As with the oxygen consumption associated with the equilibration period, the amount of oxygen used during the Complex I- and Complex II-stimulated phases are shown in Table 1.
Figure 1.
Decreased Complex I- and II-stimulated mitochondrial respiration following treatment with MZ. Oxygen consumption was measured during an initial equilibration period (A), following addition of glutamate (B), or addition of succinate (C). Worms showed a statistically significant decrease in percent oxygen consumed under all conditions. Data are presented as mean percent oxygen consumed and represent at least four separate and independent synchronizations. **p < 0.01, ***p < 0.001 compared to control.
Table 1. Oxygen consumed during each phase of stimulation.
The amount of oxygen consumed over the time course presented in Figure 1 is shown here as percent or the equivalent micromolar concentrations. Equilibration refers to the first 600 seconds, while Complex I and Complex II refer to glutamate- or succinate-stimulated time points, respectively. CN refers to the control worms, and 0.1%, 7.5%, or 17% refer to the amount of active ingredient in the fungicide.
| Oxygen Consumed (%) | Oxygen Consumed (μM) | |||||||
|---|---|---|---|---|---|---|---|---|
| CN | 0.1% | 7.5% | 17% | CN | 0.1% | 7.5% | 17% | |
| Equilibration | 15 | 13 | 11 | 10 | 83 | 70 | 61 | 59 |
| Complex I | 16 | 11 | 12 | 2 | 92 | 59 | 70 | 10 |
| Complex II | 17 | 9 | 7 | 6 | 96 | 48 | 39 | 32 |
3.2. Increased Complex II activity
Oxygen consumption studies are based on the premise that functional mitochondria will use a measurable amount of oxygen during the respiration process. The endpoint, amount of oxygen reduced/consumed, requires function of all electron transport chain enzyme complexes. Thus, to determine Complex II activity, independently of other mitochondrial complexes, nematodes were again acutely exposed to MZ followed by addition of the electron acceptor nitro blue tetrazolium (NBT). In the presence of functional Complex II, NBT is reduced, resulting in the formation of a blue precipitate (Grad et al., 2007). Absorbance, as a result of NBT conversion, was analyzed for each concentration (Figure 2).
Figure 2.
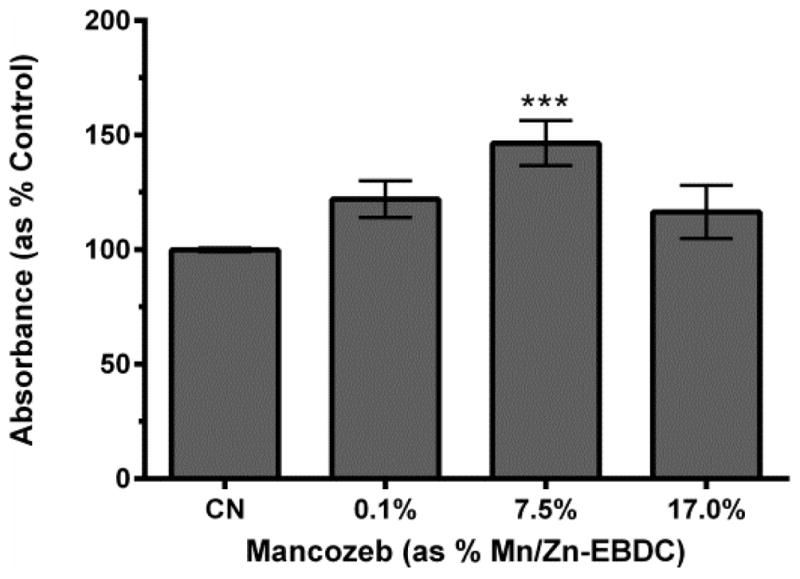
Complex II activity following MZ treatment of N2 worms. Following acute treatment with 7.5% MZ, analysis indicated a statistically significant increase in absorbance. Data are presented as mean absorbance + SEM, and represent N ≥ 4 separate synchronizations. ***p < 0.001 compared to control.
Data indicated that, while acute treatment with 0.1% MZ showed a trend towards increased NBT conversion (p = 0.11), treatment with 7.5% MZ resulted in a statistically significant increase in NBT absorbance compared to control (***p < 0.001). Since the oxygen consumption studies suggested Complex I and Complex II inhibition, we interpreted the increase in Complex II-related NBT conversion as an indication that Complex II was not actually inhibited. Rather, it was unable to send its electrons to Complex III due to inhibition at this complex (cytochrome bc1 complex). The subsequent trend in reduction in Complex II activity from the highest MZ concentration to the 7.5% Mn/Zn-EBDC concentration (p = 0.10) suggests an increase in non-specific mitochondrial inhibition, which is also consistent with data in Figure 1.
3.3. Increased Complex IV activity
To determine Complex IV activity following exposure to MZ, worms were incubated with the electron donor diaminobenzidine (DAB). In the presence of Complex IV activity, DAB is oxidized, leading to the formation of a brown precipitate (Grad et al., 2007). Absorbance data from DAB conversion was analyzed via one-way ANOVA (Figure 3), which indicated that acute treatment with 7.5% or 17.0% MZ resulted in a statistically significant, and dose dependent, increase in DAB absorbance compared to control (*p < 0.05 and ***p < 0.001). Since Complex II was not inhibited (Figure 2), these results suggest that Complex IV was electron starved, further consistent with MZ inhibition of Complex III.
Figure 3.
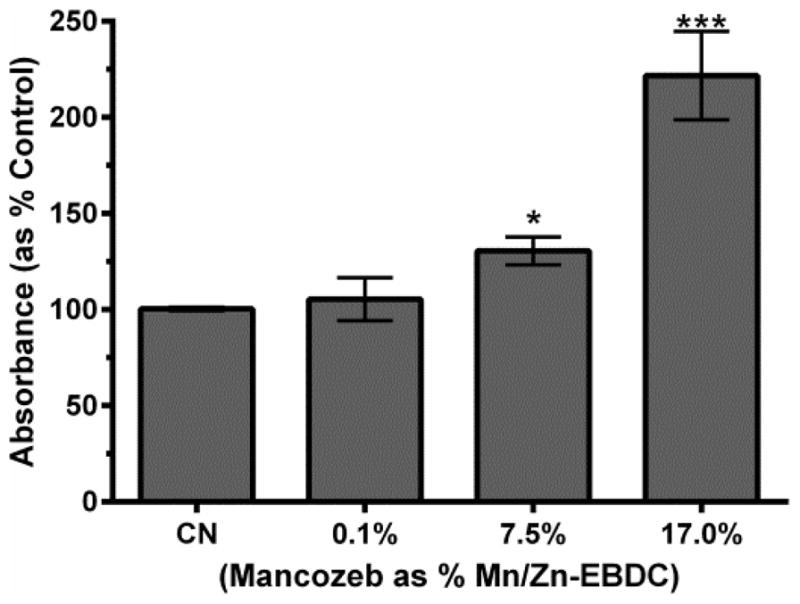
Complex IV activity following MZ treatment. Following acute treatment with 7.5% or 17.0% MZ a statistically significant increase in absorbance associated with DAB conversion was measured. Data are presented as mean absorbance + SEM and represent N ≥ 4 separate synchronizations. *p < 0.05, ***p < 0.001 compared to control.
3.4. Decreased proton gradient integrity
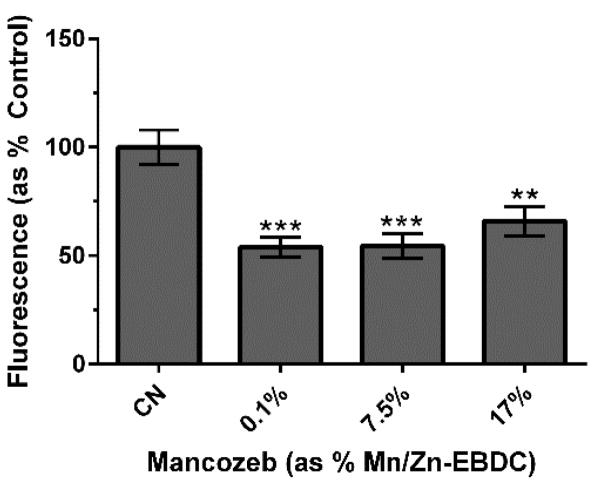
Since the establishment of the proton gradient (Δψ) relies on the ability of Complex I to shuttle electrons to Complex III (and for Complex IV to accept electrons from Complex III), we anticipated a significant decrease in Δψ in treated worms when compared to control worms. To test this hypothesis, tetramethylrhodamine ethyl ester (TMRE) was used to assay the integrity of the proton gradient. TMRE accumulates within mitochondria in the presence of an intact Δψ. Following exposure to MZ and TMRE, analysis indicated that treatment MZ resulted in a statistically significant decrease (**p < 0.01 or ***p < 0.001) in red fluorescence compared to control worms (Figure 4). Taken together, these data suggested that the observed mitochondrial inhibition was sufficient to partially dissipate Δψ.
Figure 4.
Proton gradient integrity following MZ treatment of N2 worms. Following acute treatment MZ, analysis indicated a statistically significant decrease in number of red pixels associated with TMRE accumulation. Data are presented as mean pixel number + SEM and represent N ≥ 3 separate synchronizations. **p < 0.01 or ***p < 0.001 compared to control (CN).
3.5. Decreased relative ATP levels
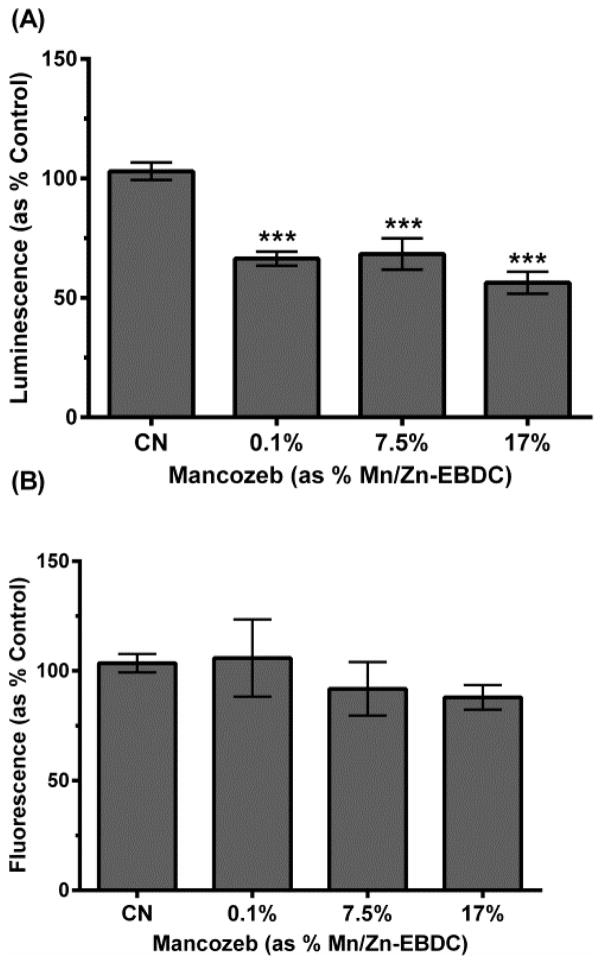
Relative ATP levels following MZ exposure were also assayed to determine whether mitochondrial inhibition and decreased Δψ correlated with lower ATP concentrations in treatment groups. As before, worms were acutely exposed to MZ, and then assayed with a luminescent probe specific for ATP levels (Figure 5A). Results showed a statistically significant decrease in ATP production in all treatment groups compared to control (***p < 0.001). Since lower measured ATP could result from mitochondrial inhibition or fewer living worms, a fluorogenic peptide substrate was used to detect necrotic protease activity (Figure 5B), and thus death. Since these results indicated no statistically significant difference among any groups, the data suggest the actual decrease in ATP was due to mitochondrial inhibition and not decreased worm viability.
Figure 5.
Relative ATP amount following MZ treatment of N2 worms. Following acute treatment with 0.1%, 7.5%, or 17.0% MZ, analysis indicated a statistically significant decrease in ATP amount (A), but no statistically significant change in cell or worm viability (B). Data are presented as mean intensity + SEM and represent N ≥ 3 separate synchronizations. ***p < 0.001 compared to control.
3.6. Superoxide detection following MZ treatment
Following the studies indicating that MZ treatment leads to mitochondrial inhibition in C. elegans, we wanted to determine if ROS were increased in vivo, and if so, the identity of the particular ROS. Initially, we used dihydroethidium (DHE) to determine whether superoxide (·O2) was produced following acute exposure to MZ. DHE is oxidized in the presence of ·O2, resulting in the formation of a red fluorescent product. Analysis of red fluorescence indicated that there was no statistically significant difference between treatment groups compared to control (Figure 6).
Figure 6.
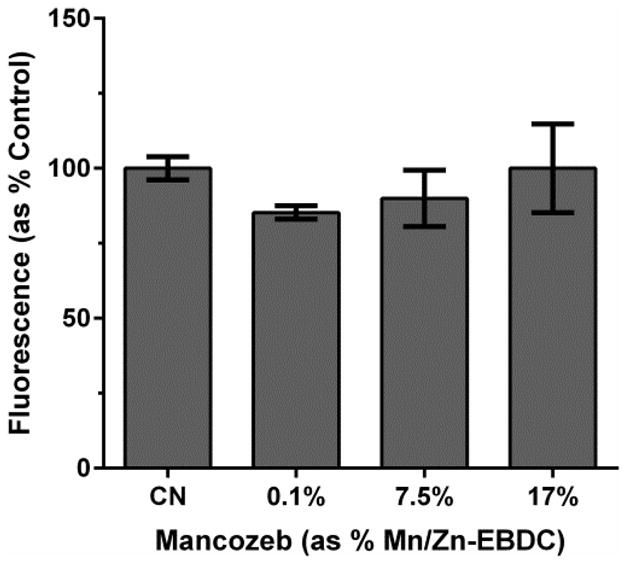
DHE detection of superoxide following MZ treatment of N2 worms. Following acute treatment with 0.1%, 7.5%, or 17.0% MZ, analysis indicated no statistically significant changes in DHE fluorescence Data are presented as mean intensity + SEM and represent N ≥ 3 separate synchronizations.
3.7. Hydrogen peroxide detection following MZ treatment
To determine whether hydrogen peroxide (H2O2) was produced following acute exposure to MZ, N2 worms were assayed using Amplex®Red (Figure 7). Data analysis suggests that acute treatment with all MZ concentrations resulted in a statistically significant, and dose-dependent, increase in H2O2 production compared to control (**p < 0.01 for 0.1% Mn/Zn-EBDC, and ***p < 0.001 for 1.0% and 1.5% Mn/Zn-EBDC). Furthermore, these increases approached eight-fold in the highest MZ treatment group.
Figure 7.
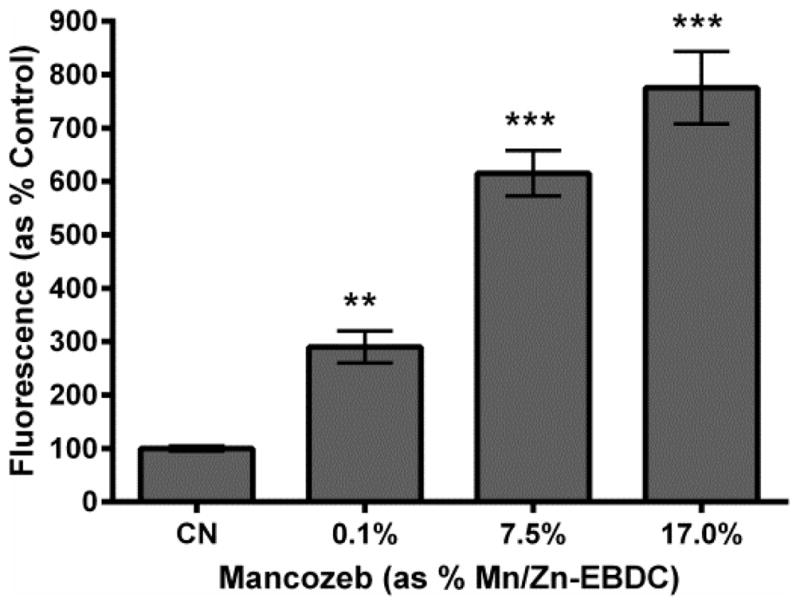
Hydrogen peroxide detection following MZ treatment. Following acute treatment with MZ, N2 worms showed a statistically significant increase in fluorescence in all groups, in a dose dependent manner, compared to control. Data is presented as mean intensity + SEM and represent N ≥ 3 separate synchronizations. **p < 0.01, ***p < 0.001 compared to control.
3.8. Hydroxyl radical detection following MZ treatment
Finally, since hydroxyl radicals (·OH) can be produced from the abstraction by H2O2 of a single electron, we wanted to determine if this highly toxic ROS could be detected following exposure of C. elegans to MZ. To this end, worms were acutely exposed to varying concentrations of MZ and further incubated with hydroxyphenyl fluorescein (HPF). In the presence of ·OH, HPF is oxidized and fluoresces. Following acute exposure to MZ, analysis indicated that treatment with 0.1% MZ resulted in a statistically significant increase in fluorescence compared to control (Figure 8).
Figure 8.
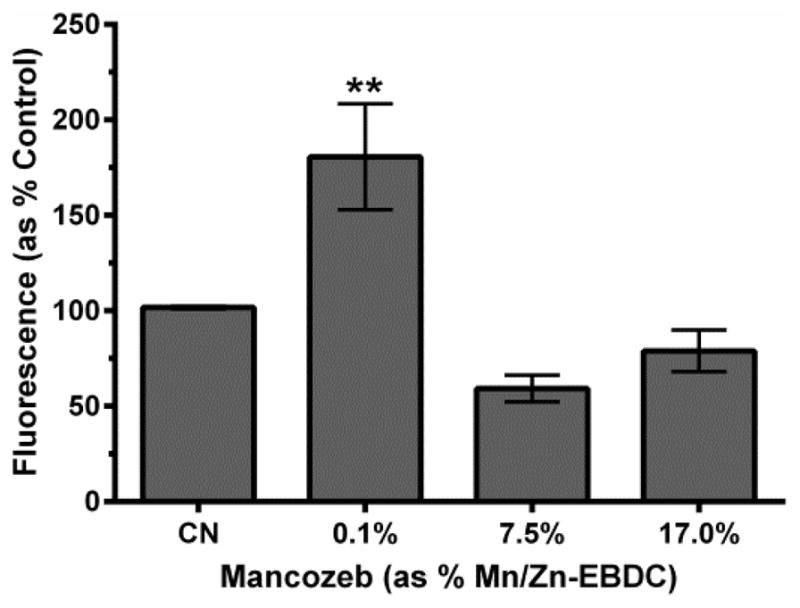
Hydroxyl radical detection following MZ treatment. Following acute MZ treatment with 0.1% MZ, analysis indicated a statistically significant increase in fluorescence compared to control. Data is presented as mean normalized intensity + SEM and represent N ≥ 4 separate synchronizations. **p <0.01 compared to control.
3.9. GST regulation
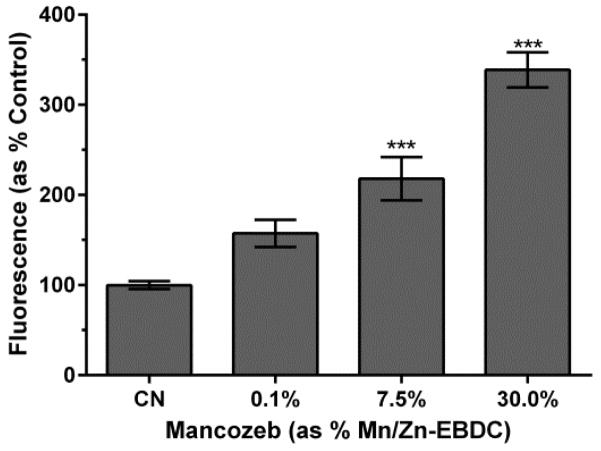
In light of the inverse relationship between H2O2 and ·OH, we wanted to determine if increased H2O2 would correlate to an up-regulation of GSH-related proteins, which can detoxicate ·OH among other toxicants. In order to determine if glutathione-S-transferase, which catalyzes the conjugation of reduced GSH to electrophiles, CL2166 worms (gst-4p::gfp) were exposed to varying concentrations of MZ. Green pixel analysis indicated that a trend towards an increase in green fluorescence from worms exposed to 0.1% MZ (p = 0.067). This reached the level of statistical significance in the two higher treatment groups (p < 0.0001) in a dose-dependent manner (Figure 9). Consistent with changes in H2O2 levels, the magnitude of change in fluorescence approached three-fold by the middle treatment group (Figure 7).
Figure 9.
GST::GFP up-regulation following MZ treatment. Following acute treatment with 7.5% or 30.0% MZ analysis showed a statistically significant increase in fluorescence. Data is presented as mean intensity + SEM and represent N ≥ 3 separate synchronizations. ***p <0.001 compared to control.
4.0. Discussion
Both mitochondrial inhibition (Hauser and Hastings, 2013; Zhu and Chu, 2010) and increased oxidative stress (Van Laar and Berman, 2013; Zuo and Motherwell, 2013) are common mechanisms of toxicity. Both are also well-documented mechanisms of neurodegeneration (Palomo and Manfredi, 2014; Wang et al., 2013). Furthermore, elevated ROS and mitochondrial dysfunction have been implicated in idiopathic and familial PD (Coppede, 2012; Lesage and Brice, 2009; McLelland et al., 2014), Alzheimer’s disease (Chen and Zhong, 2014), Huntington’s disease and amyotrophic lateral sclerosis (Federico et al., 2012). Since we have shown abnormal morphology in neuronal populations in C. elegans following MZ treatment (Negga et al., 2011; Negga et al., 2012), we wanted to determine whether MZ exposure resulted in mitochondrial inhibition and/or ROS production in intact multicellular organisms rather than isolated organelles or cell culture.
Although the exact mechanism of the fungicidal activity of Mn/Zn-EBDC containing pesticide is unknown, this family of agrochemicals is typically classified as having multi-modal or multi-action effects. This broad categorization is used when it likely that the fungicide has multiple cellular or intracellular targets. For Mn/Zn-EBDC formulations, some mechanisms of action include inhibition of metal-containing enzymes (perhaps through chelation) and decreased ATP production (Cornell, 1987), disruption of lipid synthesis (Delf et al., 2012), and inactivation of amino acid sulfhydryl groups (Limited, 2014). As none of these targets are unique to fungi, it is stands to reason that human exposure to Mn/Zn-EBDC containing fungicides could result in toxicity through similar mechanisms. Of particular interest, however, are the reports that document decreased ATP amounts, which are likely linked to mitochondrial inhibition (Domico et al., 2006; Iorio et al., 2015).
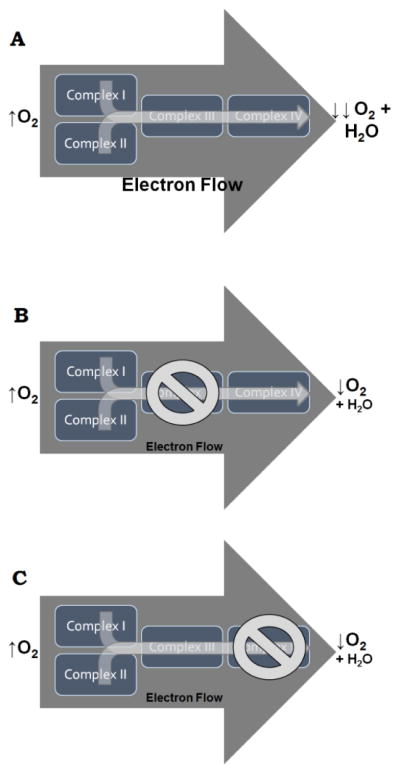
Previous reports also demonstrate that isolated mitochondria exposed to Mn/Zn-EBDC exhibited decreased respiration (Zhang et al., 2003), and that Mn/Zn-EBDC catalyzed redox reactions (Fitsanakis et al., 2002). When we treated C. elegans with a commercially available formulation of MZ, the active ingredient of which is Mn/Zn-EBDC, we also observed mitochondrial inhibition. Initially, we assayed overall electron transport chain function in live worms using oxygen consumption as an endpoint (Figure 1). In these studies, MZ treatment led to decreased oxygen consumption following Complex I- and Complex II-stimulated respiration, particularly at the higher concentrations. This technique, however, relies on the ability of the mitochondrial electron transport chain to transfer electrons to molecular oxygen, resulting in a loss of oxygen from the closed system. By adding substrates for specific mitochondrial complexes, i.e. glutamate or succinate, it is possible to obtain relatively specific information about the overall function of the electron transport chain. If, however, Complex I and Complex II are fully functional, but Complex III or Complex IV is inhibited, then the flow of electrons would be blocked before oxygen could be reduced (consumed) to form water. Thus, it could appear that Complex I or Complex II are inhibited when, in fact, the dysfunction occurs downstream of these initial enzymes (Figure 10). Since the goal was to determine the activity of the unique respiratory complexes, we followed the initial study with colorimetric assays to provide specific functional data for Complex II and Complex IV. These are particularly important to assess further because they of their position on either side of Complex III, which can be difficult to measure directly in vivo.
Figure 10.
Schematic showing the movement of electrons down the electron transport chain complexes. (A) When electrons from either Complex I or Complex II move successively through Complex III and Complex IV, oxygen is fully reduced to water. This results in a large decrease in the amount of oxygen detected by Clark’s electrodes. If Complex III (B) or Complex IV (C) is inhibited, stimulation of Complex I or Complex II will result in much less reduction of oxygen to water. Scenarios depicted in (B) and (C) would be indistinguishable from each other, and thus further assessment of Complex II (upstream of Complex III) and Complex IV (downstream of Complex IV) was warranted to determine the specific location of the inhibition in the electron transport chain.
As seen in Figure 2, mean Complex II activity in worms treated with MZ is slightly increased, but not statistically significantly (p = 0.11), in the lowest treatment group, reaches statistical significance with the mid-range concentration, and slightly decreased at the highest concentration compared to the mid-range group (p = 0.10). This indicated that Complex II is not inhibited by MZ. Furthermore, increased Complex II reduction of NBT in treated worms, when compared to controls, is consistent with a greater reduction of succinate by this complex. This often results from a shift in the reliance by the cells on Complex II-stimulated respiration (Drose, 2013; Pfleger et al., 2015).
When data from the first two studies (Figures 1 and 2) are compared with data from Complex IV assays (Figure 3), it becomes apparent that exposure of C. elegans to MZ does not inhibit Complex IV. In these latter studies, the color change takes place when oxidized Complex IV receives electrons from DAB. In the electron transport change, Complex IV accepts electrons from Complex III via cytochrome c (Grad et al., 2007). Under conditions where Complex IV is inhibited (i.e., cannot accept electrons), then DAB does not change color; if DAB is oxidized to a greater extent (increased absorbance) in worms treated with MZ, then the data suggest that Complex IV is not only intact, but starved for electrons due to up-stream inhibition. Since neither Complex II (upstream of Complex III) nor Complex IV (downstream of Complex III) was inhibited, this data strongly suggest that the decreased oxygen consumption observed in Figure 1 actually resulted from the Complex III inhibition. Furthermore, this inhibition leads to a reduction of ATP levels by 40%, when compared to controls (Figure 5).
Since mitochondrial inhibition generally leads to increased production of ROS, and increased ROS production exacerbates the positive feedback loop of further inhibiting mitochondria, we hypothesized that ROS levels would be increased in MZ-treated worms. Since a one-electron reduction of oxygen, which is common following Complex I inhibition, leads to formation of superoxide, we assayed for this ROS first. No relative increases were detected, however (Figure 6). Instead, our analysis indicated statistically significant, and dose-dependent, increases in H2O2 (Figure 7). Consistent with our mitochondrial data, it is important to note that increased H2O2 levels are generally observed in the presence of Complex III, and not Complex I, inhibitors (Chen et al., 2003; Suraniti et al., 2014). Furthermore, Complex III inhibition by Mn/Zn-EBDC has been previously reported in vitro (Zhang et al., 2003). The subsequent increase in GST::GFP expression (Figure 9), with the correlative decrease in hydroxyl radical (Figure 8), provides additional evidence that C. elegans exposed to MZ show increased ROS levels.
While production of ROS and mitochondrial inhibition are recognized mechanisms of cell death in many neurodegenerative diseases (Bonda et al., 2014; Camilleri and Vassallo, 2014; Droge and Schipper, 2007), these are not unique to neurodegeneration. For example, cardiomyopathy (Liu et al., 2014), chronic obstructive pulmonary disease (Domej et al., 2014), and chronic liver disease (Tang et al., 2014) are likely exacerbated (or initiated) by increases in ROS or reactive nitrogen species. Additionally, hydrogen peroxide, which was greatly increased following MZ-treatment, is a well-documented signaling molecule, activating both pro- and anti-survival pathways in cells (Gough and Cotter, 2011; Sies, 2014). Although reports of toxicity resulting from acute MZ exposure of humans generally leads to signs and symptoms associated with the nervous system (Erro et al., 2011; Israeli et al., 1983a, b), others have reported immunomodulatory effects (Corsini et al., 2005; Corsini et al., 2006), neural tube defects (Nordby et al., 2005), and contact dermatitis (Higo et al., 1996; Koch, 1996). In many cases, no mechanism of action is provided. Thus, while our work focuses predominantly on the neurotoxic effects of exposure to MZ, it is likely that these results will provide further insight into the manner in which MZ may affect multiple systems.
Highlights.
C. elegans acutely treated with manzate show reduced ATP levels
The decreased ATP may be attributed to Complex III inhibition
Mitochondrial inhibition is associated with increased hydrogen peroxide levels
Increased glutathione-S-transferase levels correlate with oxidative stress
Mitochondrial inhibition and oxidative stress may be mechanisms of manzate toxicity
Acknowledgments
Funding
This work was supported by the National Institute of Environmental Health Sciences [R15 ES015628-01A1 and ES015628-01A2 to VAF]. Worm strains were provided by the Caenorhabditis Genetics Center, which is funded by the National Institutes of Health Office of Research Infrastructure Programs [P40 OD010440]. The authors would also like to acknowledge Rebekah Frye, Demisha Porter, Cody Rogers, and Cameron Sale for their work associated with the preparation of this manuscript.
Abbreviations
- PD
Parkinson’s disease
- MZ
Manzate
- Mn/Zn-EBDC
Mn/Zn ethylene-bis-dithiocarbamate
- C. elegans
Caenorhabditis elegans
- ROS
Reactive oxygen species
- E. coli
Escherichia coli
- CGC
Caenorhabditis Genetics Center
- GFP
Green fluorescent protein
- NGM
Nematode growth media
- EDTA
Ethylene diamine tetraacetic acid
- EGTA
Ethylene glycol tetraacetic acid
- NBT
Nitroblue tetrazolium
- DAB
3,3′-Diaminobenzidine
- TMRE
Tetramethylrhodamine ethyl ester
- DMSO
Dimethyl sulfoxide
- DHE
Dihydroethidium
- SEM
Standard error of the mean
- ANOVA
One-way analysis of variance
- Δψ
Mitochondrial proton gradient
- ·O2
Superoxide
- H2O2
Hydrogen peroxide
- ·OH
Hydroxyl radical
Footnotes
Publisher's Disclaimer: This is a PDF file of an unedited manuscript that has been accepted for publication. As a service to our customers we are providing this early version of the manuscript. The manuscript will undergo copyediting, typesetting, and review of the resulting proof before it is published in its final citable form. Please note that during the production process errors may be discovered which could affect the content, and all legal disclaimers that apply to the journal pertain.
Contributor Information
Callie E. Todt, Email: ctodt@student.king.edu.
Denise C. Bailey, Email: dbailey@student.king.edu.
Aireal S. Pressley, Email: adpressley@outlook.com.
Sarah E. Orfield, Email: seorfield@student.king.edu.
Rachel D. Denney, Email: radonaldson@student.king.edu.
Isaac B. Snapp, Email: snapp@musc.edu.
Rekek Negga, Email: rnegga@utk.edu.
Andrew C. Bailey, Email: abailey@student.king.edu.
Kara M. Montgomery, Email: kmontgomery@student.king.edu.
Wendy L. Traynor, Email: wltrayno@king.edu.
References
- Billingslea J. United States Environmental Protection Agency, editor. Maneb: Notice of receipt of a request to voluntarily cancel pesticide registrations of certain products. Environmental Protection Agency; 2009. [Google Scholar]
- Bonda DJ, Wang X, Lee HG, Smith MA, Perry G, Zhu X. Neuronal failure in Alzheimer’s disease: A view through the oxidative stress looking-glass. Neurosci Bull. 2014;30(2):243–252. doi: 10.1007/s12264-013-1424-x. [DOI] [PMC free article] [PubMed] [Google Scholar]
- Bonide; Bonide Products, Inc, editor. Mancozeb flowable with zinc concentrate. Bonide Products, Inc; Oriskany, NY: 2010. [Google Scholar]
- Brenner S. The genetics of Caenorhabditis elegans. Genetics. 1974;77:71–94. doi: 10.1093/genetics/77.1.71. [DOI] [PMC free article] [PubMed] [Google Scholar]
- Calviello G, Piccioni E, Boninsegna A, Tedesco B, Maggiano N, Serini S, Wolf FI, Palozza P. DNA damage and apoptosis induction by the pesticide Mancozeb in rat cells: Involvement of the oxidative mechanism. Toxicol Appl Pharmacol. 2006;211(2):87–96. doi: 10.1016/j.taap.2005.06.001. [DOI] [PubMed] [Google Scholar]
- Camilleri A, Vassallo N. The centrality of mitochondria in the pathogenesis and treatment of Parkinson’s disease. CNS Neurosci Ther. 2014;20(7):591–602. doi: 10.1111/cns.12264. [DOI] [PMC free article] [PubMed] [Google Scholar]
- Chen Q, Vazquez EJ, Moghaddas S, Hoppel CL, Lesnefsky EJ. Production of reactive oxygen species by mitochondria: Central role of complex III. J Biol Chem. 2003;278(38):36027–36031. doi: 10.1074/jbc.M304854200. [DOI] [PubMed] [Google Scholar]
- Chen Z, Zhong C. Oxidative stress in Alzheimer’s disease. Neurosci Bull. 2014;30(2):271–281. doi: 10.1007/s12264-013-1423-y. [DOI] [PMC free article] [PubMed] [Google Scholar]
- Colosio C, Barcellini W, Maroni M, Alcini D, Bersani M, Cavallo D, Galli A, Meroni P, Pastorelli R, Rizzardi GP, Soleo L, Foa V. Immunomodulatory effects of occupational exposure to mancozeb. Arch Environ Health. 1996;51(6):445–451. doi: 10.1080/00039896.1996.9936044. [DOI] [PubMed] [Google Scholar]
- Coppede F. Genetics and epigenetics of Parkinson’s disease. Scientific World Journal. 2012;2012:489830. doi: 10.1100/2012/489830. [DOI] [PMC free article] [PubMed] [Google Scholar]
- Cornell University. Pesticide Management Education Program (PMEP) Cornell Univeristy Cooperative Extension; 1987. Mancozeb (Dithane M-45, Manzate 200) - Chemical Profile 4/87. [Google Scholar]
- Corsini E, Birindelli S, Fustinoni S, De Paschale G, Mammone T, Visentin S, Galli CL, Marinovich M, Colosio C. Immunomodulatory effects of the fungicide Mancozeb in agricultural workers. Toxicol Appl Pharmacol. 2005;208(2):178–185. doi: 10.1016/j.taap.2005.02.011. [DOI] [PubMed] [Google Scholar]
- Corsini E, Viviani B, Birindelli S, Gilardi F, Torri A, Codeca I, Lucchi L, Bartesaghi S, Galli CL, Marinovich M, Colosio C. Molecular mechanisms underlying mancozeb-induced inhibition of TNF-alpha production. Toxicol Appl Pharmacol. 2006;212(2):89–98. doi: 10.1016/j.taap.2005.07.002. [DOI] [PubMed] [Google Scholar]
- Costello S, Cockburn M, Bronstein J, Zhang X, Ritz B. Parkinson’s disease and residential exposure to maneb and paraquat from agricultural applications in the Central Valley of California. Am J Epidemiol. 2009;169(8):919–926. doi: 10.1093/aje/kwp006. [DOI] [PMC free article] [PubMed] [Google Scholar]
- Delf C, Allen R, Raine D, Chapmers P, Dalglies L. Mancozeb Update. United Phosphorus Ltd; Warrington, Cheshire, UK: 2012. p. 3. [Google Scholar]
- Domej W, Oettl K, Renner W. Oxidative stress and free radicals in COPD- Implications and relevance for treatment. Internat J COPD. 2014;9:1207–1224. doi: 10.2147/COPD.S51226. [DOI] [PMC free article] [PubMed] [Google Scholar]
- Domico LM, Cooper KR, Bernard LP, Zeevalk GD. Reactive oxygen species generation by the ethylene-bis-dithiocarbamate (EBDC) fungicide mancozeb and its contribution to neuronal toxicity in mesencephalic cells. Neurotoxicology. 2007;28(6):1079–1091. doi: 10.1016/j.neuro.2007.04.008. [DOI] [PMC free article] [PubMed] [Google Scholar]
- Domico LM, Zeevalk GD, Bernard LP, Cooper KR. Acute neurotoxic effects of mancozeb and maneb in mesencephalic neuronal cultures are associated with mitochondrial dysfunction. Neurotoxicology. 2006;27(5):816–825. doi: 10.1016/j.neuro.2006.07.009. [DOI] [PubMed] [Google Scholar]
- Droge W, Schipper HM. Oxidative stress and aberrant signaling in aging and cognitive decline. Aging Cell. 2007;6(3):361–370. doi: 10.1111/j.1474-9726.2007.00294.x. [DOI] [PMC free article] [PubMed] [Google Scholar]
- Drose S. Differential effects of Complex II on mitochondrial ROS production and their relation to cardioprotective pre- and postconditioning. Biochim Biophys Acta. 2013;1827(5):578–587. doi: 10.1016/j.bbabio.2013.01.004. [DOI] [PubMed] [Google Scholar]
- Erro ME, Munoz R, Zandio B, Mayor S. Reversible parkinsonism after accidental oral intake of mancozeb. Mov Disord. 2011;26(3):557–558. doi: 10.1002/mds.23410. [DOI] [PubMed] [Google Scholar]
- Federico A, Cardaioli E, Da Pozzo P, Formichi P, Gallus GN, Radi E. Mitochondria, oxidative stress and neurodegeneration. J Neurol Sci. 2012;322(1–2):254–262. doi: 10.1016/j.jns.2012.05.030. [DOI] [PubMed] [Google Scholar]
- Fitsanakis VA, Amarnath V, Moore JT, Montine KS, Zhang J, Montine TJ. Catalysis of catechol oxidation by metal-dithiocarbamate complexes in pesticides. Free Rad Biol Med. 2002;33(12):1714–1723. doi: 10.1016/s0891-5849(02)01169-3. [DOI] [PubMed] [Google Scholar]
- Gough DR, Cotter TG. Hydrogen peroxide: A Jekyll and Hyde signalling molecule. Cell Death Dis. 2011;2:e213. doi: 10.1038/cddis.2011.96. [DOI] [PMC free article] [PubMed] [Google Scholar]
- Grad LI, Sayles LC, Lemire BD. Isolation and functional analysis of mitochondria from the nematode Caenorhabditis elegans. In: Leister D, Herrmann J, editors. Methods in Molecular Biology: Mitochondria: Practical Protocols. Humana Press Inc; Totowa, NJ: 2007. [DOI] [PubMed] [Google Scholar]
- Harrison Brody A, Chou E, Gray JM, Pokyrwka NJ, Raley-Susman KM. Mancozeb-induced behavioral deficits precede structural neural degeneration. Neurotoxicology. 2013;34:74–81. doi: 10.1016/j.neuro.2012.10.007. [DOI] [PubMed] [Google Scholar]
- Hauser DN, Hastings TG. Mitochondrial dysfunction and oxidative stress in Parkinson’s disease and monogenic parkinsonism. Neurobiol Dis. 2013;51:35–42. doi: 10.1016/j.nbd.2012.10.011. [DOI] [PMC free article] [PubMed] [Google Scholar]
- Higo A, Ohtake N, Saruwatari K, Kanzaki T. Photoallergic contact dermatitis from mancozeb, an agricultural fungicide. Contact Derm. 1996;35(3):183. doi: 10.1111/j.1600-0536.1996.tb02346.x. [DOI] [PubMed] [Google Scholar]
- Iorio R, Castellucci A, Rossi G, Cinque B, Cifone MG, Macchiarelli G, Cecconi S. Mancozeb affects mitochondrial activity, redox status and ATP production in mouse granulosa cells. Toxicol In Vitro. 2015;30(1 Pt B):438–445. doi: 10.1016/j.tiv.2015.09.018. [DOI] [PubMed] [Google Scholar]
- Israeli R, Sculsky M, Tiberin P. Acute central nervous system changes due to intoxication by Manzidan (a combined dithiocarbamate of Maneb and Zineb) Arch Toxicol Suppl. 1983a;6:238–243. doi: 10.1007/978-3-642-69083-9_43. [DOI] [PubMed] [Google Scholar]
- Israeli R, Sculsky M, Tiberin P. Acute intoxication due to exposure to maneb and zineb. A case with behavioral and central nervous system changes. Scand J Work Environ Health. 1983b;9(1):47–51. doi: 10.5271/sjweh.2443. [DOI] [PubMed] [Google Scholar]
- Koch P. Occupational allergic contact dermatitis and airborne contact dermatitis from 5 fungicides in a vineyard worker. Cross-reactions between fungicides of the dithiocarbamate group? Contact Derm. 1996;34(5):324–329. doi: 10.1111/j.1600-0536.1996.tb02216.x. [DOI] [PubMed] [Google Scholar]
- Leiers B, Kampkotter A, Grevelding CG, Link CD, Johnson TE, Henkle-Duhrsen K. A stress-responsive glutathione S-transferase confers resistance to oxidative stress in Caenorhabditis elegans. Free Rad Biol Med. 2003;34(11):1405–1415. doi: 10.1016/s0891-5849(03)00102-3. [DOI] [PubMed] [Google Scholar]
- Lesage S, Brice A. Parkinson’s disease: From monogenic forms to genetic susceptibility factors. Hum Mol Genet. 2009;18(R1):R48–59. doi: 10.1093/hmg/ddp012. [DOI] [PubMed] [Google Scholar]
- Li P, Zhu J, Kong Q, Jiang B, Wan X, Yue J, Li M, Jiang H, Li J, Gao Z. The ethylene-bis-dithiocarbamate fungicide Mancozeb activates voltage-gated KCNQ2 potassium channel. Toxicol Lett. 2013;219(3):211–217. doi: 10.1016/j.toxlet.2013.03.020. [DOI] [PubMed] [Google Scholar]
- Indofil Industries, Limited. [accessed 30 November 2014];Indofil M-45. 2014 < https://indofilcc.com/business-area/agricultural-chemicals/fungicides/indofil-m-45/>.
- Liu Q, Wang S, Cai L. Diabetic cardiomyopathy and its mechanisms: Role of oxidative stress and damage. J Diabetes Invest. 2014;5(6):623–634. doi: 10.1111/jdi.12250. [DOI] [PMC free article] [PubMed] [Google Scholar]
- McLelland GL, Soubannier V, Chen CX, McBride HM, Fon EA. Parkin and PINK1 function in a vesicular trafficking pathway regulating mitochondrial quality control. EMBO J. 2014;33(4):282–295. doi: 10.1002/embj.201385902. [DOI] [PMC free article] [PubMed] [Google Scholar]
- Negga R, Rudd DA, Davis NS, Justice AN, Hatfield HE, Valente AL, Fields AS, Fitsanakis VA. Exposure to Mn/Zn ethylene-bis-dithiocarbamate and glyphosate pesticides leads to neurodegeneration in Caenorhabditis elegans. Neurotoxicology. 2011;32(3):331–341. doi: 10.1016/j.neuro.2011.02.002. [DOI] [PMC free article] [PubMed] [Google Scholar]
- Negga R, Stuart JA, Machen ML, Salva J, Lizek AJ, Richardson SJ, Osborne AS, Mirallas O, McVey KA, Fitsanakis VA. Exposure to glyphosate- and/or Mn/Zn-ethylene-bis-dithiocarbamate-containing pesticides leads to degeneration of gamma-aminobutyric acid and dopamine neurons in Caenorhabditis elegans. Neurotox Res. 2012;21(3):281–290. doi: 10.1007/s12640-011-9274-7. [DOI] [PMC free article] [PubMed] [Google Scholar]
- Nevola J. United States Environmental Protection Agency, editor. Maneb: Tolerance Actions. Office of Pesticide Programs; Washington, DC: 2011. pp. 40811–40814. [Google Scholar]
- Nordby KC, Andersen A, Irgens LM, Kristensen P. Indicators of mancozeb exposure in relation to thyroid cancer and neural tube defects in farmers’ families. Scand J Work Environ Health. 2005;31(2):89–96. doi: 10.5271/sjweh.855. [DOI] [PubMed] [Google Scholar]
- Palomo GM, Manfredi G. Exploring new pathways of neurodegeneration in ALS: The role of mitochondria quality control. Brain Res. 2015;1607:36–46. doi: 10.1016/j.brainres.2014.09.065. [DOI] [PMC free article] [PubMed] [Google Scholar]
- Pfleger J, He M, Abdellatif M. Mitochondrial Complex II is a source of the reserve respiratory capacity that is regulated by metabolic sensors and promotes cell survival. Cell Death Dis. 2015;6:e1835. doi: 10.1038/cddis.2015.202. [DOI] [PMC free article] [PubMed] [Google Scholar]
- Sies H. Role of metabolic H2O2 generation: Redox signaling and oxidative stress. J Biol Chem. 2014;289(13):8735–8741. doi: 10.1074/jbc.R113.544635. [DOI] [PMC free article] [PubMed] [Google Scholar]
- Suraniti E, Ben-Amor S, Landry P, Rigoulet M, Fontaine E, Bottari S, Devin A, Sojic N, Mano N, Arbault S. Electrochemical monitoring of the early events of hydrogen peroxide production by mitochondria. Angewandte Chemie. 2014;53(26):6655–6658. doi: 10.1002/anie.201403096. [DOI] [PubMed] [Google Scholar]
- Tang W, Jiang YF, Ponnusamy M, Diallo M. Role of Nrf2 in chronic liver disease. World J Gastroenter: WJG. 2014;20(36):13079–13087. doi: 10.3748/wjg.v20.i36.13079. [DOI] [PMC free article] [PubMed] [Google Scholar]
- United States Geological Survey; United States Department of the Interior, United States Geological Survey, editor. Pesticide National Synthesis Project: Mancozeb Usage. United States Geological Survey; 2013. [Google Scholar]
- Van Laar VS, Berman SB. The interplay of neuronal mitochondrial dynamics and bioenergetics: implications for Parkinson’s disease. Neurobiol Dis. 2013;51:43–55. doi: 10.1016/j.nbd.2012.05.015. [DOI] [PMC free article] [PubMed] [Google Scholar]
- Wang X, Wang W, Li L, Perry G, Lee HG, Zhu X. Oxidative stress and mitochondrial dysfunction in Alzheimer’s disease. Biochim Biophys Acta. 2013;1842(8):1240–1247. doi: 10.1016/j.bbadis.2013.10.015. [DOI] [PMC free article] [PubMed] [Google Scholar]
- Winterbourn CC. The challenges of using fluorescent probes to detect and quantify specific reactive oxygen species in living cells. Biochimica et Biophysica Acta (BBA) - General Subjects. 2014;1840(2):730–738. doi: 10.1016/j.bbagen.2013.05.004. [DOI] [PubMed] [Google Scholar]
- Zhang J, Fitsanakis VA, Gu G, Jing D, Ao M, Amarnath V, Montine TJ. Manganese ethylene-bis-dithiocarbamate and selective dopaminergic neurodegeneration in rat: a link through mitochondrial dysfunction. J Neurochem. 2003;84:336–346. doi: 10.1046/j.1471-4159.2003.01525.x. [DOI] [PubMed] [Google Scholar]
- Zhu J, Chu CT. Mitochondrial dysfunction in Parkinson’s disease. J Alzheimers Dis. 2010;20(Suppl 2):S325–334. doi: 10.3233/JAD-2010-100363. [DOI] [PubMed] [Google Scholar]
- Zuo L, Motherwell MS. The impact of reactive oxygen species and genetic mitochondrial mutations in Parkinson’s disease. Gene. 2013;532(1):18–23. doi: 10.1016/j.gene.2013.07.085. [DOI] [PubMed] [Google Scholar]


