Abstract
Purpose
To characterize contemporary trends in lymphadenectomy for the treatment of upper tract urothelial carcinoma in a population-based cohort. To determine if number of lymph nodes removed and tumor location are predictors of cancer-specific survival in patients undergoing nephroureterectomy.
Materials and Methods
Individuals with upper tract urothelial carcinoma undergoing nephroureterectomy in the Surveillance, Epidemiology, and End Results program from 2004–2012 were identified. Linear regression was used to assess trends in lymphadenectomy. Patients were stratified based on nodal status, quartiles of nodes removed, and tumor location. Kaplan-Meier analysis, log-rank tests, and cox proportional hazards models were used to compare cancer-specific and overall survival among groups.
Results
In the cohort, 25%(721/2862) of all patients and 27%(566/2079) of grade 3/4 patients had lymphadenectomy. The percentage of patients receiving lymphadenectomy increased from 20%(60/295) in 2004 to 33%(106/320) in 2012 (p=0.02). The highest quartile of lymph nodes removed had improved 5-year cancer specific survival of 78%(95%CI 69–85%) compared to the 2nd quartile (60%, 95%CI 51–67%, p=0.003) and 3rd quartile (60%, 95% CI 51–68%, p=0.002) of nodes removed. This trend held for node negative and node positive patients. In multivariable modeling, a lower number of lymph nodes dissected (HR=0.94, 95% CI 0.91–0.98) and ureteral tumors (HR=1.29, 95%CI 1.07–1.56) were predictors of worse cancer-specific survival.
Conclusions
In upper tract urothelial carcinoma patients undergoing nephroureterectomy, rates of lymphadenectomy have increased from 2004–2012 in the United States. In this contemporary cohort, an increase in the number of nodes removed and renal pelvis tumors are associated with improved cancer-specific survival, which highlights the importance of intentional lymph node dissections with adequate lymph node yield in these patients.
Keywords: Transitional Cell Carcinoma, Lymph Node Dissection, SEER Program, Ureteral Neoplasm, Kidney Neoplasm
1. Introduction
The standard of care for high-risk upper tract urothelial carcinoma (UTUC) is nephroureterectomy with bladder cuff excision. The decision to perform a routine pelvic or retroperitoneal lymph node dissection (LND) is controversial [1]. A number of studies, including population-based data [2–4], demonstrate no difference in cancer-specific survival (CSS) with LND [2–7] and no survival benefit with higher LN counts [8–9]. However, several studies from centers of excellence report an improvement in CSS with LND and higher node counts being associated with better survival [10–15]. Recently, the National Comprehensive Cancer Network (NCCN) changed their guidelines to recommend LND in patients with high-grade UTUC and to consider LND in patients with low-grade disease [16]. However, the extent to which urologists in the United States (U.S.) perform LNDs in patients with UTUC remains unknown.
In addition to the controversy regarding LND, there is disagreement regarding the utility of tumor location (ureteral vs. renal pelvis) as a predictor of CSS [17]. Previous retrospective studies show worse survival with ureteral tumors [18–19], while others report no survival difference based on tumor location [6–7,20–21]. The largest population-based analysis of this topic to date reported worse CSS in renal pelvis tumors, and the authors hypothesized the higher rates of N+ disease and more advanced T stage could explain the worse survival in renal pelvis tumor patients [2]. However, this question has not been addressed in a more contemporary population-based cohort.
This study was designed with three aims to investigate these controversial issues in the treatment of UTUC. First, to investigate contemporary trends in the rates of LND at the time of nephroureterectomy for the treatment of UTUC in the U.S. Second, to determine if an increased number of nodes removed during LND results in improved CSS. Third, to investigate the role of tumor location and laterality as it relates to rates of N+ disease and CSS.
2. Materials and Methods
2.1 Patient Cohort
With IRB approval we identified individuals in the SEER database with renal pelvis (ICD-9 65.9) and ureteral (ICD-9 66.9) malignancies [2]. Of the 15,222 patients with UTUC, 6,397 received nephroureterectomies (code 40). Exclusion criteria included non-urothelial histology (urothelial = code 8120–8130), previous malignancies, lack of histologic confirmation of diagnosis, and unknown LND status. Pathologically metastatic patients were included as their nephroureterectomy was likely conducted with curative intent since nephroureterectomy is only recommended for patients with operable tumors. [16] The final analytic cohort consisted of 2,862 patients. Sociodemographic data (age, sex, race, and SEER registry), year of diagnosis, tumor characteristics (size, grade, stage, location, and laterality), LN data (N stage and number of nodes removed), vital status, and follow-up time were obtained. Deaths associated with cause of death codes 29010–29040 were considered cancer-specific deaths, while deaths associated with all other codes were considered other cause mortality.
2.2 Tumor Grade Variable
In regards to tumor grade, the SEER program used a different system than the more commonly used 2004 World Health Organization/International Society of Urological Pathology system (WHO/ISUP). However, a recent study of the 2010 SEER data showed 60.4% and 38.1% of WHO/ISUP low-grade tumors tend to be classified as grades 1/2 or unknown respectively, and 80.0% of WHO/ISUP high-grade tumors tend to be classified as grade 3/4 [22]. This suggests grades 1/2 tend to represent low-grade tumors and grades 3/4 tend to represent high-grade tumors.
2.3 Statistical Analysis
Patients were stratified into two groups based upon whether they received a LND. Patients were identified as having a LND if a pathologist examined ≥1 LN in the surgical specimen understanding that this may not represent a purposeful or template-based LND. [23] Baseline characteristic comparisons were made between the two groups using appropriate statistical comparisons tests.
We then calculated the proportion of patients with LND in each calendar year and linear regression was used to evaluate the temporal trend among all patients and also among the subset of patients with grade 3/4 (high-grade) disease. Since the trends were very similar, we decided to use all patients in the rest of the analysis. Univariable and multivariable logistic regression was performed to determine clinical predictors (age, race, sex, tumor grade, tumor size, date of diagnosis, tumor location and laterality) of receiving a LND. Pathologic tumor grade and size were used as surrogates for clinical tumor grade and size as previous studies have demonstrated high correlation between the clinical and pathologic values for these variables. [24–25] Only variables that were significant (p<0.05) in the univariable analysis were included in the multivariable analysis along with tumor location and date of diagnosis, the variables of interest in this study.
Next, univariable and multivariable cox proportional hazards modeling was performed to determine predictors of OS and CSS. Variables that were significant in the univariable analysis were included with the multivariable analysis along with tumor location and number of nodes, the variables of interest in this study.
The patient population was then stratified into node negative (N0), node positive (N+), and nodes not examined (NX) groups. CSS Kaplan-Meier (KM) curves were created and log-rank tests were performed to assess for a difference in CSS. If a difference was found, pairwise comparisons were performed.
Next, the individuals that received a LND were further stratified into quartiles (25–50th percentile, 50–75th percentile, and 75–100th percentile) based on the number of LNs removed. Similar CSS KM curve and log-rank test methodology was used to evaluate the following subgroups: N0 patients, N+ patients, renal pelvis tumor patients, and ureteral tumor patients. A pairwise comparison of 25–50th and 75–100th percentile groups was made for all subgroups regardless of significance of global log-rank comparison test. All analyses were conducted using STATA version 12 (StataCorp, College Station, Texas). All reported p-values were 2 sided and a p-value<0.05 was considered statistically significant for all tests.
3. Results
Of the 2,862 individuals in the cohort, 721(25%) had a LND and 2141(75%) did not have a LND at the time of nephroureterectomy. Similarly, among 2,079 individuals with grade 3/4 disease 27%[566/2079] had LND at the time of nephroureterectomy.
3.1 Patient Demographics and Tumor Characteristics
The baseline characteristics stratified by receipt of a LND are listed in Table 1. Individuals with LND were younger (p<0.001), had higher grade disease (p<0.001), had higher T stage (p<0.001) and M stage disease (p<0.001), larger tumors (p<0.001), more likely to have left-sided tumors (p=0.007), and had a more recent diagnosis date (p<0.001) than patients without a LND.
Table 1.
Demographics and tumor characteristics in patients who underwent and did not undergo a lymph node dissection (LND).
| No LN Dissection (n=2141) |
LN Dissection (n=721) |
p-value | Total (n=2862) |
|
|---|---|---|---|---|
| Age (SD) | 71.2 (11.0) | 69.1 (11.0) | p<0.001 | 70.7 (11.1) |
| Sex | ||||
| - Male | 1185 (55.3%) | 367 (54.8%) | p=0.8 | 1581 (55.2%) |
| - Female | 956 (44.7%) | 303 (45.2%) | 1281 (44.8%) | |
| Race | ||||
| - Caucasian | 1895 (88.5%) | 616 (85.4%) | p=0.2 | 2511 (87.7%) |
| - African American | 80 (3.7%) | 37 (5.1%) | 117 (4.1%) | |
| - Other | 162 (7.6%) | 67 (9.3%) | 229 (8.0%) | |
| - Unknown | 4 (0.2%) | 1 (0.1%) | 5 (0.2%) | |
| SEER Registry | ||||
| - San Francisco-Oakland | 95 (4.4%) | 32 (4.4%) | p=0.2 | 127 (4.4%) |
| - Connecticut | 141 (6.6%) | 37 (5.1%) | 178 (6.2%) | |
| - Metropolitan Detroit | 141 (6.6%) | 35 (4.9%) | 176 (6.2%) | |
| - Hawaii | 55 (2.6%) | 22 (3.1%) | 77 (2.7%) | |
| - Iowa | 121 (5.7%) | 35 (4.9%) | 156 (5.5%) | |
| - New Mexico | 29 (1.4%) | 15 (2.1%) | 44 (1.5%) | |
| - Seattle (Puget Sound) | 105 (4.9%) | 48 (6.7%) | 153 (5.4%) | |
| - Utah | 33 (1.5%) | 6 (0.8%) | 39 (1.4%) | |
| - Metropolitan Atlanta | 51 (2.4%) | 16 (2.2%) | 67 (2.3%) | |
| - Alaska | - (<1%)* | - (<1%)* | - (<1%)* | |
| - San Jose-Monterey | 50 (2.3%) | 22 (3.1%) | 72 (2.5%) | |
| - Los Angeles | 144 (6.7%) | 60 (8.3%) | 204 (7.1%) | |
| - Rural Georgia | - (<1%)* | - (<1%)* | - (<1%)* | |
| - Greater California | 438 (20.5%) | 152 (21.1%) | 590 (20.6%) | |
| - Kentucky | 169 (7.9%) | 49 (6.8%) | 218 (7.6%) | |
| - Louisiana | 136 (6.4%) | 36 (5.0%) | 172 (6.0%) | |
| - New Jersey | 260 (12.1%) | 107 (14.8%) | 367 (12.8%) | |
| - Greater Georgia | 166 (7.8%) | 48 (6.7%) | 214 (7.5%) | |
| Grade | ||||
| - Grade 1 | 119 (5.6%) | 25 (3.5%) | p<0.001 | 144 (5.0%) |
| - Grade 2 | 384 (17.9%) | 72 (10.0%) | 456 (15.9%) | |
| - Grade 3 | 597 (27.9%) | 210 (29.1%) | 807 (28.2%) | |
| - Grade 4 | 916 (42.8%) | 356 (49.4%) | 1272 (44.4%) | |
| - Unknown | 125 (5.8%) | 58 (8.0%) | 183 (6.4%) | |
| pT stage | ||||
| - T1 | 781 (36.5%) | 180 (25.0%) | p<0.001 | 961 (33.6%) |
| - T2 | 430 (20.1%) | 129 (17.9%) | 559 (19.5%) | |
| - T3 | 809 (37.8%) | 333 (46.2%) | 1142 (39.9%) | |
| - T4 | 109 (5.1%) | 77 (10.7%) | 186 (6.5%) | |
| - TX | 12 (0.6%) | 2 (0.3%) | 14 (0.5%) | |
| pN Stage | ||||
| - N0 | 0 (0.0%) | 466 (64.6%) | p<0.001 | 466 (16.3%) |
| - N1 | 0 (0.0%) | 155 (21.5%) | 155 (5.4%) | |
| - N2/3 | 0 (0.0%) | 100 (13.9%) | 100 (3.5%) | |
| - Nx | 2141 (100.0%) | 0 (0.0%) | 2141 (74.8%) | |
| pM Stage | ||||
| - M0 | 2059 (96.2%) | 660 (91.5%) | p<0.001 | 2719 (95.0%) |
| - M1 | 50 (2.3%) | 51 (7.1%) | 101 (3.5%) | |
| - Mx | 32 (1.5%) | 10 (1.4%) | 42 (1.5%) | |
| Tumor Size (SD) | 38 mm (23) | 47 mm (33) | p<0.001 | 40 mm (26) |
| Tumor Location | ||||
| - Renal Pelvis | 1429 (66.7%) | 483 (67.0%) | p=0.9 | 1912 (66.8%) |
| - Ureter | 712 (33.3%) | 238 (33.0%) | 950 (33.2%) | |
| Tumor Laterality | ||||
| - Right | 1074 (50.2%) | 316 (43.8%) | p=0.007 | 1390 (48.6%) |
| - Left | 1064 (49.7%) | 405 (56.2%) | 1469 (51.3%) | |
| - Unknown | 3 (0.1%) | 0 | 3 (0.1%) | |
| Median Year of Diagnosis (IQR) | ||||
| 2008 (2006– 2010) |
2009 (2006– 2011) |
p<0.001 | 2008 (2006– 2010) |
|
|
Mean Number of Nodes Removed (SD) |
0 (0) | 4.7 (7.0) | p<0.001 | 1.0 (3.8) |
|
Median Number of Nodes Removed (IQR) |
0 (0–0) | 2 (1–5) | p<0.001 | 0 (0–0) |
Exact number of patients is not reported to maintain patient confidentiality.
3.2 Trends in Lymph Node Dissection
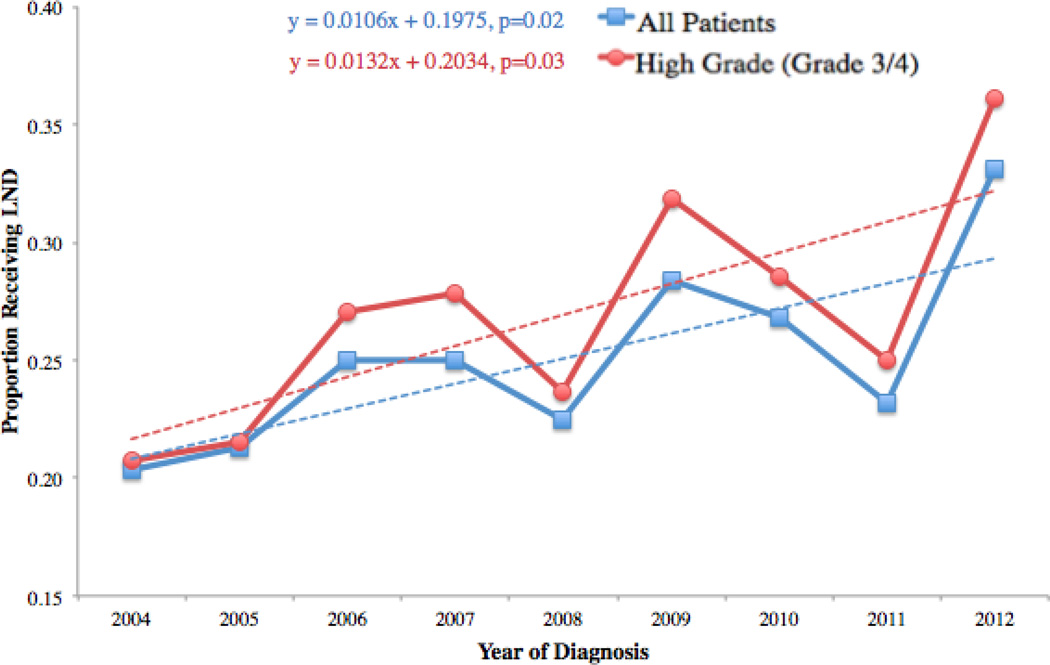
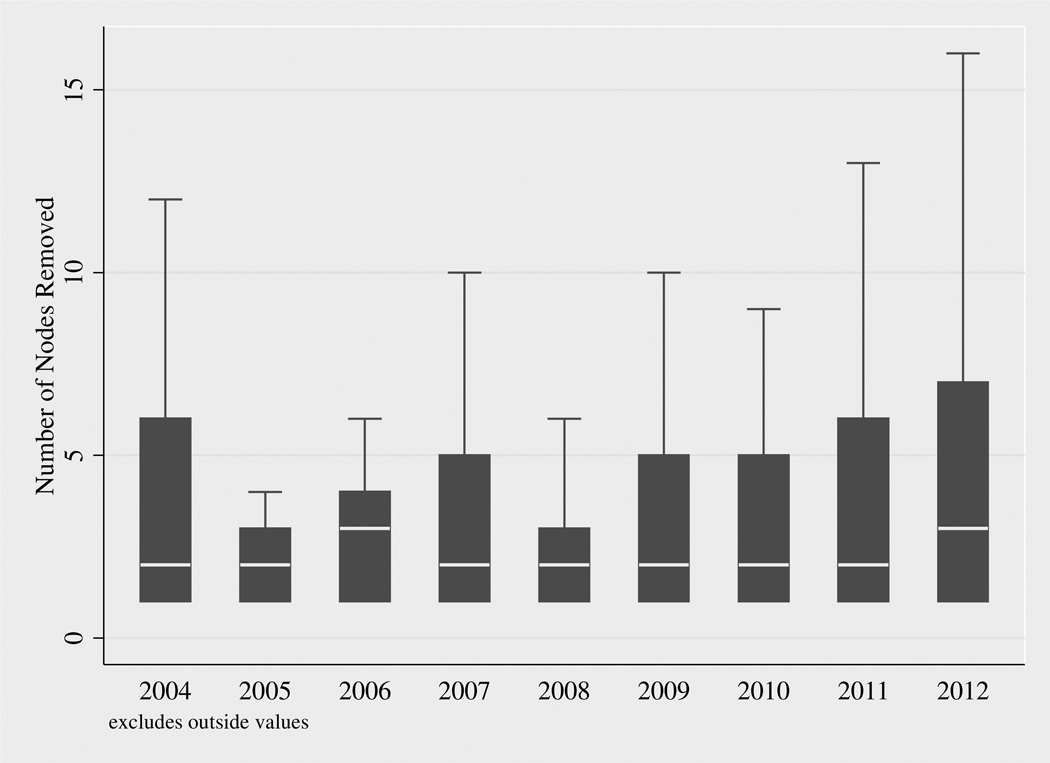
The proportion of patients that received a LND increased as the date of surgery increased (Figure 1) from 20%(60/295) in 2004 to 33%(106/320) in 2012 for all patients and 21%(40/193) in 2004 and 36%(82/227) in grade 3/4 (high-grade) patients. Univariable linear regression showed that each year more recent than 2004 resulted in a 1.1% increase (p=0.02) in the likelihood of receiving a LND among all patients and a 1.3% (p=0.03) increase in the likelihood of LND in high-grade patients. Box plots for the number of lymph nodes removed by year of diagnosis show very little change in the number of LNs removed over time (Figure 2).
Figure 1.
Trend in LND from 2004-rates of LND for all patients and 1.3% increase per year in rates of LND for grade 3/4 patients from 2004 to 2012.
Figure 2.
Box plots of number of LNs removed by year of diagnosis. These plots exclude outliers.
Univariable logistic regression showed clinical predictors of receiving a LND were younger age at surgery (odds ratio [OR]=0.98, 95% confidence interval [95%CI] 0.98–0.99), grade 3 (OR=1.67, 95%CI 1.06–2.65) or grade 4 (OR=1.85, 95%CI 1.18–2.90) disease, larger tumors (OR=1.01, 95%CI 1.01–1.02), more recent date of diagnosis (OR=1.06, 95%CI 1.02–1.09) and left-sided tumors (OR=1.29, 95%CI 1.10–1.53). The multivariable logistic regression model is shown in Table 2. Of note, age, tumor size, tumor grade, and left-sided tumor laterality were predictive of LND. The odds of receiving a LND were higher in more contemporary years, but this did not meet levels of traditional significance. Tumor location was not a predictor of receiving a LND.
Table 2.
Multivariable logistic regression for clinical predictors of receiving LND.
| Odds Ratio (95% CI) | p-value | |
|---|---|---|
| Age at Diagnosis (per year) | 0.98 (0.97–0.99) | p<0.001 |
| Tumor Grade | ||
| - Grade 1 | Reference | |
| - Grade 2 | 0.92 (0.54–1.59) | p=0.8 |
| - Grade 3 | 1.87 (1.13–3.07) | p=0.01 |
| - Grade 4 | 1.99 (1.22–3.23) | p=0.006 |
| - Unknown | 2.26 (1.25–4.08) | p=0.007 |
| Tumor size (per mm) | 1.01 (1.01–1.02) | p<0.001 |
| Date of Diagnosis (per year) | 1.03 (0.99–1.07) | p=0.1 |
| Tumor location | ||
| - Renal Pelvis | Reference | |
| - Ureter | 1.11 (0.91–1.35) | p=0.3 |
| Tumor Laterality | ||
| - Right | Reference | |
| - Left | 1.36 (1.13–1.65) | p=0.001 |
3.3 Predictors of Overall Survival and Cancer Specific Survival
Multivariable cox proportional hazards models for predictors of both OS and CSS are listed in Table 3. Of note, ureteral tumor location was a predictor of both worse OS (hazard ratio [HR]=1.18, 95%CI 1.03–1.35) and worse CSS (HR=1.29, 95%CI 1.07–1.56) compared to renal pelvis tumor location. Additionally, an increase in the number of nodes removed was a predictor of improved CSS (HR=0.94, 95%CI 0.91–0.98).
Table 3.
Multivariable cox proportional hazards model for OS and CSS.
| HR OS (95% CI) | HR CSS (95% CI) | |||
|---|---|---|---|---|
| Age | 1.04 (1.04–1.05) | p<0.001 | 1.03 (1.02–1.04) | p<0.001 |
| Sex | ||||
| - Male | N/A | Reference | ||
| - Female | 1.05 (0.87–1.26) | p=0.6 | ||
| Tumor size | 1.003 (1.002–1.005) | p<0.001 | 1.004 (1.001–1.01) | p=0.003 |
| Tumor Grade | ||||
| - Grade 1 | Reference | Reference | ||
| - Grade 2 | 1.43 (0.93–2.20) | p=0.1 | 2.53 (0.91–6.07) | p=0.054 |
| - Grade 3 | 2.01 (1.33–3.03) | p=0.001 | 5.12 (2.03–12.49) | p<0.001 |
| - Grade 4 | 2.26 (1.51–3.40) | p<0.001 | 5.74 (2.32–14.18) | p<0.001 |
| - Unknown | 2.01 (1.22–3.32) | p=0.006 | 5.13 (2.11–15.46) | p=0.001 |
| pT stage | ||||
| - T1 | Reference | Reference | ||
| - T2 | 1.44 (1.17–1.77) | p=0.001 | 1.64 (1.17–2.24) | p=0.003 |
| - T3 | 2.20 (1.85–2.63) | p<0.001 | 3.08 (2.37–4.09) | p<0.001 |
| - T4 | 4.13 (3.19–5.34) | p<0.001 | 6.16 (4.37–9.21) | p<0.001 |
| - Unknown | 3.88 (0.95–15.87) | p=0.06 | 7.82 (1.09–60.34) | p=0.04 |
| pN stage | ||||
| - N0 | Reference | Reference | ||
| - N1 | 2.01 (1.48–2.72) | p<0.001 | 2.33 (1.50–3.28) | p<0.001 |
| - N2/3 | 1.94 (1.34–2.81) | p<0.001 | 1.83 (1.04–3.15) | p=0.01 |
| - Nx | 1.12 (0.91–1.39) | p=0.3 | 0.97 (0.78–1.42) | p=0.8 |
| pM stage | ||||
| - M0 | Reference | Reference | ||
| - M1 | 3.20 (2.42–4.23) | p<0.001 | 3.64 (2.59–5.12) | p<0.001 |
| - Mx | 1.90 (1.16–3.13) | p=0.01 | 2.53 (1.39–4.61) | p=0.002 |
| Tumor location | ||||
| - Renal Pelvis | Reference | Reference | ||
| - Ureter | 1.18 (1.03–1.35) | p=0.02 | 1.29 (1.07–1.56) | p=0.008 |
| Number of Nodes Removed | 0.99 (0.97–1.02) | p=0.5 | 0.94 (0.91–0.98) | p=0.003 |
3.4 Nodal Status and Oncologic Outcomes
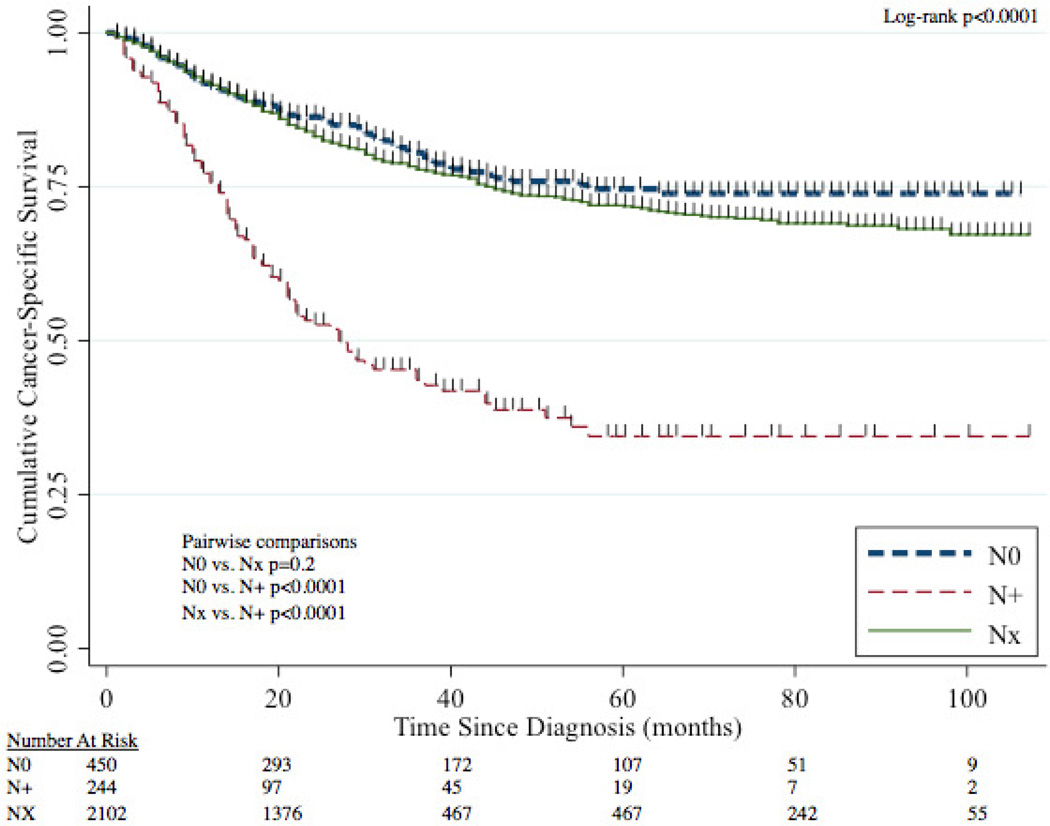
The median follow-up time for patients was 28 months (IQR 11–53 months). The 5-year CSS for N0, NX, and N+ disease was 75% (95%CI 69–79%), 72% (95%CI 69–74%), and 34% (95%CI 26–43%) respectively (Figure 3). Patients with N+ disease had worse CSS than both N0 patients (p<0.0001) and NX patients (p<0.0001) while CSS between N0 and NX patients was statistically similar (p=0.2).
Figure 3.
CSS stratified by nodal status (N0, N+, NX).
3.5 Number of Nodes, Tumor Location, and Oncologic Outcomes
For patients with LND, the median number of nodes removed was 2 (IQR 1–5 LNs). The overall rate of N+ disease was 35%(255/721). Patients with renal pelvis tumors were more likely to have N+ disease compared to patients with ureteral tumors (38%[184/483] vs. 30%[71/238], p=0.03). However, there was no difference in rates of N+ disease between right-sided vs. left-sided tumors (37%[116/316] vs. 34%[139/405], p=0.5). The likelihood of N+ disease in patients with 1, 2–4, or 5 nodes removed was 26%(62/236), 34%(75/222), and 36%(63/175) with no difference (p=0.08) between the groups.
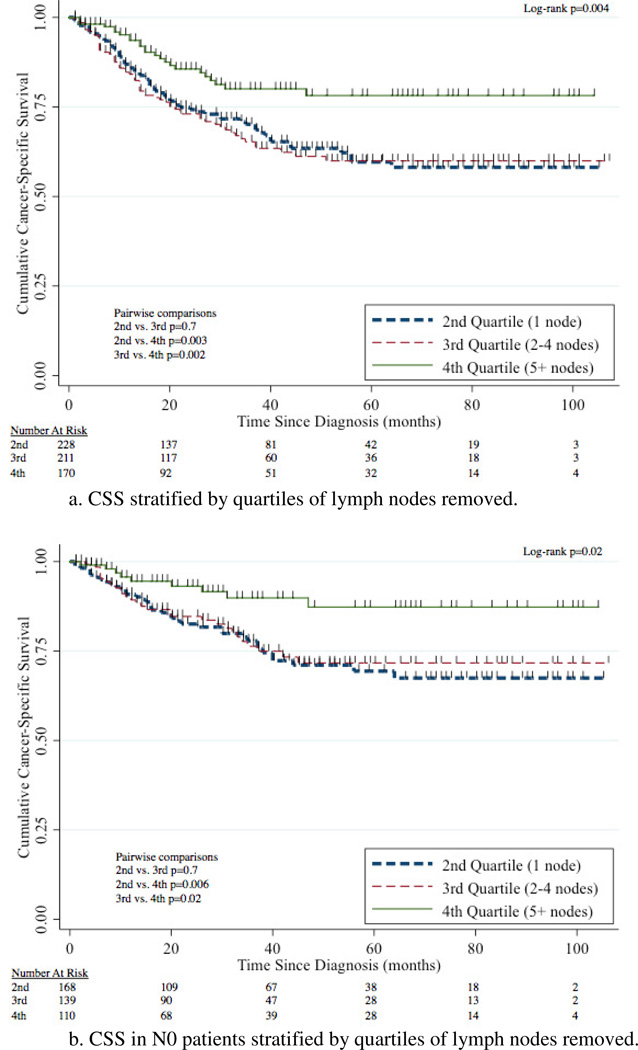
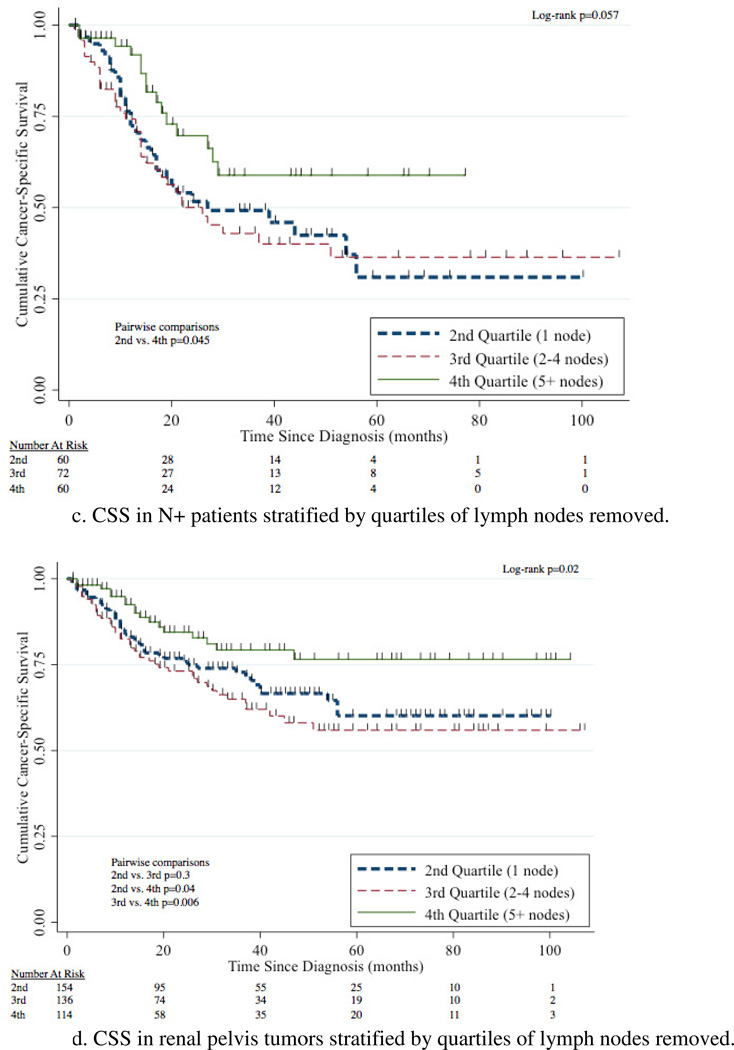
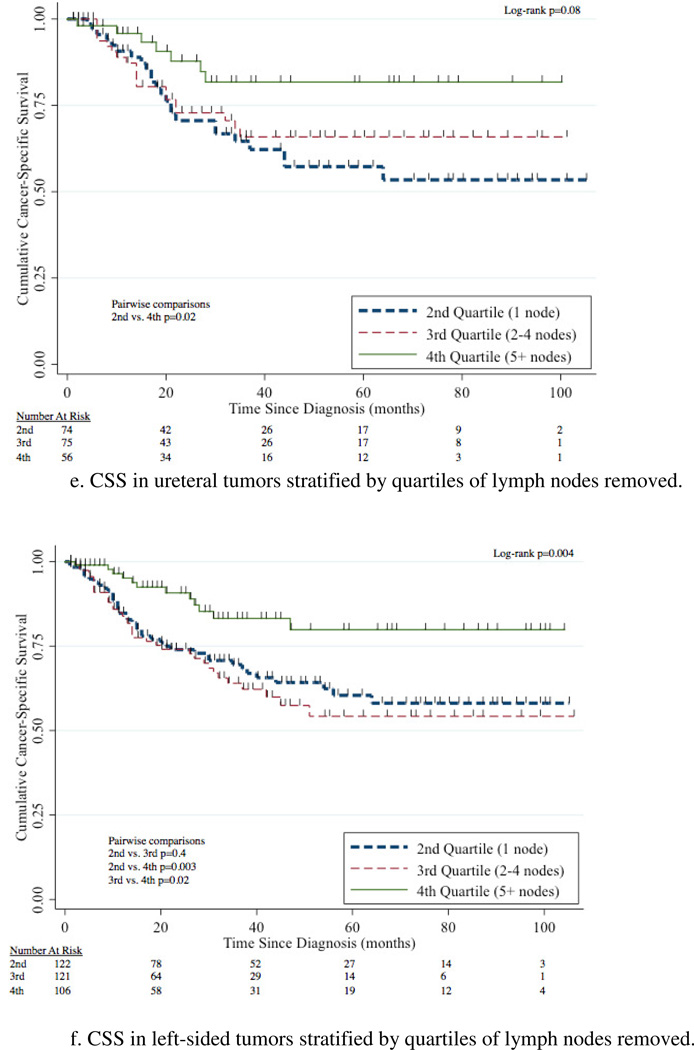
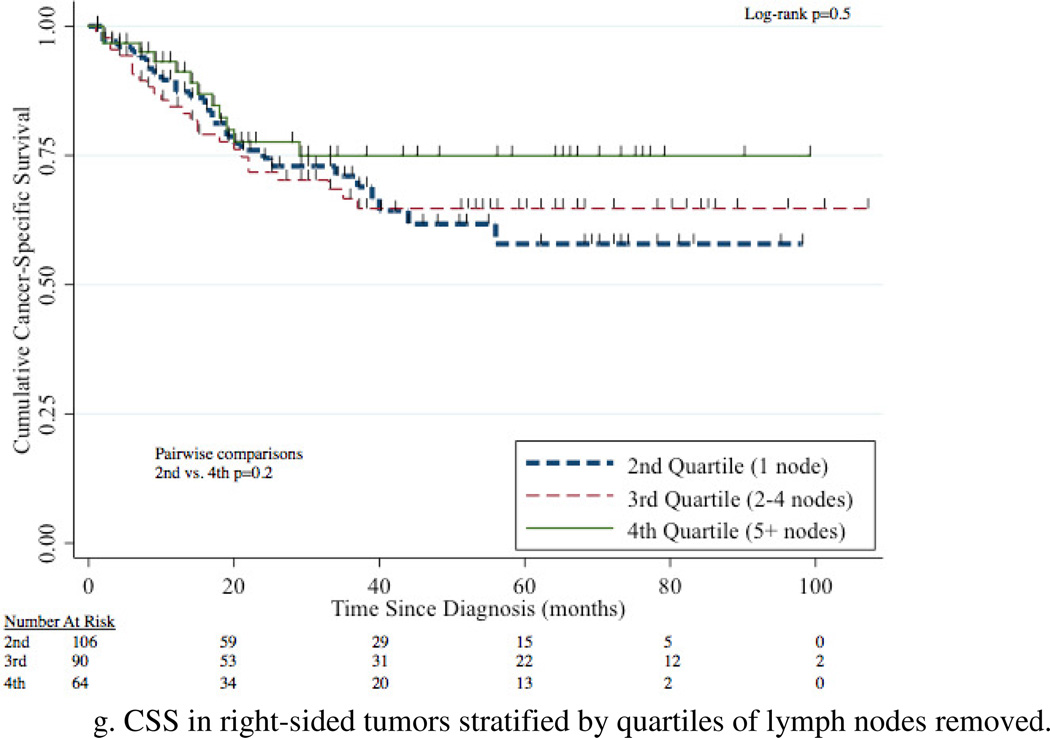
The 5-year CSS for 1 node, 2–4 nodes, and 5+ nodes removed was 60% (95%CI 51–67%), 60% (95%CI 51–68%), and 78% (95%CI 69–85%) respectively (Figure 4a). Removal of 5+ nodes resulted in improved CSS compared to 1 node (p=0.003) and 2–4 nodes (p=0.002). CSS was comparable between the group with 1 node and 2–4 nodes removed (p=0.7). A survival benefit for patients with 5+ LNs removed compared to 1 LN removed was evident in patients with N0, N+, renal pelvis, ureteral, and left-sided tumors with this comparison not meeting traditional levels of significance for right-sided tumors (p=0.2) (Figure 4b–g).
Figure 4.
4. Discussion
This is the most recent population-based analysis of trends in LND for the treatment of UTUC, building on strong evidence supporting the use of LND in recent years. In the U.S., there was a significant increase in LND rates at the time of nephroureterectomy for UTUC from 2004–2012 with younger patients and patients with high-grade, left-sided tumors, and large tumors more likely to undergo LND. To our knowledge, this is the first population-based study to show an increased LN count leading to improved survival for both N+ and N0 patients. Moreover, after controlling for several known predictors of CSS, ureteral tumors are associated with worse CSS.
There are several possible factors contributing to the increased LND rate from 2004–2012. These include the increasing evidence in the literature that LND improves survival [10–15], the addition of LND to NCCN guideline recommendations [16], and the increased rates of robotic-assisted nephroureterectomy in the United States [26] since studies have shown LND is performed more frequently and with higher node counts with the robot-assisted approach compared to the laparoscopic approach [27]. Additionally, the rate of LND is likely driven by the rate of high-grade disease. However, LND likely remains underutilized given the low median node count (2) in both all patients and grade 3/4 (high-grade) patients and low overall LND rate in all patients (25%[721/2862]) and grade 3/4 patients (27%[566/2079]).
In this study, CSS improved as the number of LNs removed increased. After adjustment there was a 6% decrease in the risk of cancer-specific mortality for each additional LN removed. Due to limitations of SEER, it is impossible to know who underwent a purposeful LND and what templates, if any, were used. However, the above data strongly supports an increasing LN yield (and likely LND) portends a survival advantage. This is consistent with other studies [11,15,28] and speaks to both a therapeutic and staging benefit of LND [5].
Moreover, we report the survival benefit associated with an increased LN count occurred in both N+ and N0 disease subgroups. Previous population-based studies [2–3,6,20] in UTUC patients have not investigated this topic. The survival improvement in the N+ patients supports the role of a therapeutic benefit with LND while the survival improvement in N0 patients likely indicates a staging benefit, as misclassification is less likely to occur in patients with more extensive LND.
Additionally, we report ureteral tumors portend a worse CSS than renal pelvis tumors. Previous population-based and multi-center studies on this topic found no difference in survival based on tumor location [2,6,20,29]. However, these studies were conducted in older study periods, and we believe our study is more representative of contemporary treatment patterns. There are also several smaller, contemporary studies that support worse CSS with ureteral tumors [18–19]. While previous work has suggested the rates of N+ may differ based on tumor location [2], the rates of N+ disease were not higher for ureteral tumors to help explain their worse CSS. Anatomic studies from centers of excellence suggest the extent of dissection necessary for ureteral tumors is not well-established [12,30–32]. These previous studies combined with the benefit of increasing LN count described in this study all suggest inadequacies in LND for patients with ureteral tumors may explain their inferior CSS. However, it is possible the effect of tumor location in this study could be due to confounding or mediation due to patient selection for LND or residual confounding from unmeasured variables. Other potential hypotheses to support worse CSS in ureteral tumors include that the ureter provides less of an oncologic boundary to lymphovascular spaces, ureteral tumors have more aggressive inherent tumor biology, and the relative ease of endoscopic management of ureteral tumors results in their treatment with nephroureterectomy at a later stage than renal pelvis tumors. However, the higher rate of N+ disease in renal pelvis tumors in this study does not support these claims.
The limitations of this study include that it is retrospective by design. Additionally, the SEER database does not contain information about previous endoscopic management, neoadjuvant chemotherapy, or adjuvant therapies. While the use of NAC and adjuvant chemotherapy can influence survival, it is likely to only reduce the magnitude of survival difference between patients with N0 and N+ disease. The overall utilization of chemotherapy has been shown to be quite low in the SEER-Medicare population so the effect of this limitation is likely lower than expected [33]. Moreover, the database does not contain information about comorbidities. However, using CSS allows for deaths that would be attributed to comorbidities to be censored from the analysis increasing the robustness of our findings. Additionally, as previously mentioned the tumor grade in SEER is not the same as the WHO/ISUP tumor grade, but the two variables tend to correlate [22]. Also previously mentioned, pathologic tumor grade and size were used as surrogates of clinical tumor grade and size as previous studies have demonstrated high correlation for the pathologic and clinical estimates of tumor grade and size. [24–25] Another limitation is lack of data on the location of the LNs sampled. Therefore, we were unable to control for or analyze the importance of the location of the LND performed. Additionally, there is no centralized process for the pathologic determination of LN counts so the accuracy cannot be assessed, and it is possible there were changes over the study period in how the nodes were examined by the pathologists that could lead to secular changes in lymph node counts. However, several peer-reviewed studies conducted with the SEER database have used the LN count variable in their primary analysis and drawn strong conclusions from their results [34]. Moreover, the SEER database does not capture the surgical volume of centers or training level of surgeons, which could impact whether a LND is performed and the number of LNs removed. Additionally, some may consider the use of data from 2004–2012 to not represent a contemporary cohort. However, this time lag is an inherent limitation of all population-based database studies, and the results presented here represent a contemporary update from previous studies using the SEER database.
5. Conclusions
Rates of LND at the time of nephroureterectomy for UTUC have significantly increased from 2004–2012. Moreover, an increase in the number of LNs removed portends a survival advantage for patients in this study irrespective of nodal status. These findings highlight the importance of intentional lymph node dissections with an adequate lymph node yield in UTUC patients undergoing nephroureterectomy as ≥5 LNs was associated with the greatest survival advantage. Additionally, ureteral tumor location is a prognostic indicators of worse survival, and these survival differences cannot be attributed to differences in the rates of N+ disease. Further studies are needed to determine if disease biology, lymphadenectomy template, or other factors explain the observed inferior CSS.
HIGHLIGHTS.
Rates of lymphadenectomy have increased from 2004–2012 in UTUC patients
Increased lymph node yield is associated with improved CSS
Ureteral tumor location is associated with worse OS and CSS
Intentional LND with adequate lymph node yield is important for UTUC patients undergoing nephroureterectomy
Future studies are needed to understand the mechanism of inferior OS and CSS of ureteral tumors
Acknowledgments
Funding: None
Footnotes
Publisher's Disclaimer: This is a PDF file of an unedited manuscript that has been accepted for publication. As a service to our customers we are providing this early version of the manuscript. The manuscript will undergo copyediting, typesetting, and review of the resulting proof before it is published in its final citable form. Please note that during the production process errors may be discovered which could affect the content, and all legal disclaimers that apply to the journal pertain.
Conflict of Interest: Nothing to disclose
References
- 1.Roscigno M, Brausi M, Heidenreich A, et al. Lymphadenectomy at the time of nephroureterectomy for upper tract urothelial cancer. Eur Urol. 2011;60(4):776–783. doi: 10.1016/j.eururo.2011.07.009. [DOI] [PubMed] [Google Scholar]
- 2.Isbarn H, Jeldres C, Shariat SF, et al. Location of the primary tumor is not an independent predictor of cancer specific mortality in patients with upper urinary tract urothelial carcinoma. J Urol. 2009;182(5):2177–2181. doi: 10.1016/j.juro.2009.07.035. [DOI] [PubMed] [Google Scholar]
- 3.Burger M, Shariat SF, Fritsche HM, et al. No overt influence of lymphadenectomy on cancer-specific survival in organ-confined versus locally advanced upper urinary tract urothelial carcinoma undergoing radical nephroureterectomy: A retrospective international, multi-institutional study. World J Urol. 2011;29(4):465–472. doi: 10.1007/s00345-011-0705-0. [DOI] [PubMed] [Google Scholar]
- 4.Miyake H, Hara I, Gohji K, Arakawa S, Kamidono S. The significance of lymphadenectomy in transitional cell carcinoma of the upper urinary tract. Br J Urol. 1998;82(4):494–498. doi: 10.1046/j.1464-410x.1998.00800.x. [DOI] [PubMed] [Google Scholar]
- 5.Lughezzani G, Jeldres C, Isbarn H, et al. A critical appraisal of the value of lymph node dissection at nephroureterectomy for upper tract urothelial carcinoma. Urology. 2010;75(1):118–124. doi: 10.1016/j.urology.2009.07.1296. [DOI] [PubMed] [Google Scholar]
- 6.Lughezzani G, Sun M, Perrotte P, et al. Gender-related differences in patients with stage I to III upper tract urothelial carcinoma: Results from the surveillance, epidemiology, and end results database. Urology. 2010;75(2):321–327. doi: 10.1016/j.urology.2009.09.048. [DOI] [PubMed] [Google Scholar]
- 7.Favaretto RL, Shariat SF, Chade DC, et al. The effect of tumor location on prognosis in patients treated with radical nephroureterectomy at memorial sloan-kettering cancer center. Eur Urol. 2010;58(4):574–580. doi: 10.1016/j.eururo.2010.07.003. [DOI] [PMC free article] [PubMed] [Google Scholar]
- 8.Abe T, Shinohara N, Harabayashi T, et al. The role of lymph-node dissection in the treatment of upper urinary tract cancer: A multi-institutional study. BJU Int. 2008;102(5):576–580. doi: 10.1111/j.1464-410X.2008.07673.x. [DOI] [PubMed] [Google Scholar]
- 9.Bolenz C, Shariat SF, Fernandez MI, et al. Risk stratification of patients with nodal involvement in upper tract urothelial carcinoma: Value of lymph-node density. BJU Int. 2009;103(3):302–306. doi: 10.1111/j.1464-410X.2008.07988.x. [DOI] [PubMed] [Google Scholar]
- 10.Brausi MA, Gavioli M, De Luca G, et al. Retroperitoneal lymph node dissection (RPLD) in conjunction with nephroureterectomy in the treatment of infiltrative transitional cell carcinoma (TCC) of the upper urinary tract: Impact on survival. Eur Urol. 2007;52(5):1414–1418. doi: 10.1016/j.eururo.2007.04.070. [DOI] [PubMed] [Google Scholar]
- 11.Roscigno M, Cozzarini C, Bertini R, et al. Prognostic value of lymph node dissection in patients with muscle-invasive transitional cell carcinoma of the upper urinary tract. Eur Urol. 2008;53(4):794–802. doi: 10.1016/j.eururo.2008.01.008. [DOI] [PubMed] [Google Scholar]
- 12.Kondo T, Nakazawa H, Ito F, Hashimoto Y, Toma H, Tanabe K. Impact of the extent of regional lymphadenectomy on the survival of patients with urothelial carcinoma of the upper urinary tract. J Urol. 2007;178(4 Pt 1):1212–1217. doi: 10.1016/j.juro.2007.05.158. discussion 1217. [DOI] [PubMed] [Google Scholar]
- 13.Rink M, Ehdaie B, Cha EK, et al. Stage-specific impact of tumor location on oncologic outcomes in patients with upper and lower tract urothelial carcinoma following radical surgery. Eur Urol. 2012;62(4):677–684. doi: 10.1016/j.eururo.2012.02.018. [DOI] [PubMed] [Google Scholar]
- 14.Xylinas E, Rink M, Margulis V, et al. Prediction of true nodal status in patients with pathological lymph node negative upper tract urothelial carcinoma at radical nephroureterectomy. J Urol. 2013;189(2):468–473. doi: 10.1016/j.juro.2012.09.036. [DOI] [PubMed] [Google Scholar]
- 15.Roscigno M, Shariat SF, Margulis V, et al. The extent of lymphadenectomy seems to be associated with better survival in patients with nonmetastatic upper-tract urothelial carcinoma: How many lymph nodes should be removed? Eur Urol. 2009;56(3):512–518. doi: 10.1016/j.eururo.2009.06.004. [DOI] [PubMed] [Google Scholar]
- 16.National Comprehensive Cancer Network Bladder Cancer Panel. [Accessed 12/10, 2015];NCCN clinical practice guidelines in Oncology Bladder cancer version 2. 2015 http://www.nccn.org/professionals/physician_gls/PDF/bladder.pdf. Updated 2015.
- 17.Lughezzani G, Burger M, Margulis V, et al. Prognostic factors in upper urinary tract urothelial carcinomas: A comprehensive review of the current literature. Eur Urol. 2012;62(1):100–114. doi: 10.1016/j.eururo.2012.02.030. [DOI] [PubMed] [Google Scholar]
- 18.Akdogan B, Dogan HS, Eskicorapci SY, Sahin A, Erkan I, Ozen H. Prognostic significance of bladder tumor history and tumor location in upper tract transitional cell carcinoma. J Urol. 2006;176(1):48–52. doi: 10.1016/S0022-5347(06)00511-8. [DOI] [PubMed] [Google Scholar]
- 19.Park S, Hong B, Kim CS, Ahn H. The impact of tumor location on prognosis of transitional cell carcinoma of the upper urinary tract. J Urol. 2004;171(2 Pt 1):621–625. doi: 10.1097/01.ju.0000107767.56680.f7. [DOI] [PubMed] [Google Scholar]
- 20.Lughezzani G, Jeldres C, Isbarn H, et al. Nephroureterectomy and segmental ureterectomy in the treatment of invasive upper tract urothelial carcinoma: A population-based study of 2299 patients. Eur J Cancer. 2009;45(18):3291–3297. doi: 10.1016/j.ejca.2009.06.016. [DOI] [PubMed] [Google Scholar]
- 21.Lee HY, Li CC, Huang CN, et al. Prognostic significance of lymphovascular invasion in upper urinary tract urothelial carcinoma is influenced by tumor location. Ann Surg Oncol. 2015;22(4):1392–1400. doi: 10.1245/s10434-014-4103-x. [DOI] [PubMed] [Google Scholar]
- 22.Charlton ME, Adamo MP, Sun L, Deorah S. Bladder cancer collaborative stage variables and their data quality, usage, and clinical implications: A review of SEER data, 2004–2010. Cancer. 2014;120(Suppl 23):3815–3825. doi: 10.1002/cncr.29047. [DOI] [PMC free article] [PubMed] [Google Scholar]
- 23.Abdollah F, Sun M, Schmitges J, et al. Stage-specific impact of pelvic lymph node dissection on survival in patients with non-metastatic bladder cancer treated with radical cystectomy. BJU Int. 2012;109(8):1147–1154. doi: 10.1111/j.1464-410X.2011.10482.x. [DOI] [PubMed] [Google Scholar]
- 24.Brown GA, Matin SF, Busby JE, et al. Ability of clinical grade to predict final pathologic stage in upper urinary tract transitional cell carcinoma: Implications for therapy. Urology. 2007;70(2):252–256. doi: 10.1016/j.urology.2007.03.051. [DOI] [PMC free article] [PubMed] [Google Scholar]
- 25.Valignat C, Marechal JM, Rouviere O, et al. Contribution of computed tomography in the staging of upper urinary tract urothelial tumors. importance of the tumor diameter measurement. Prog Urol. 1997;7(2):217–224. [PubMed] [Google Scholar]
- 26.Tinay I, Gelpi-Hammerschmidt F, Leow JJ, et al. Trends in utilization, perioperative outcomes and costs for nephroureterectomies in the management of upper tract urothelial carcinoma (UTUC): A 10-year population-based analysis. BJU Int. 2015 doi: 10.1111/bju.13375. [DOI] [PubMed] [Google Scholar]
- 27.Pearce SM, Pariser JJ, Patel SG, Steinberg GD, Shalhav AL, Smith ND. The effect of surgical approach on performance of lymphadenectomy and perioperative morbidity for radical nephroureterectomy. Urol Oncol. 2015 doi: 10.1016/j.urolonc.2015.09.008. [DOI] [PubMed] [Google Scholar]
- 28.Kondo T, Hashimoto Y, Kobayashi H, et al. Template-based lymphadenectomy in urothelial carcinoma of the upper urinary tract: Impact on patient survival. Int J Urol. 2010;17(10):848–854. doi: 10.1111/j.1442-2042.2010.02610.x. [DOI] [PubMed] [Google Scholar]
- 29.Margulis V, Shariat SF, Matin SF, et al. Outcomes of radical nephroureterectomy: A series from the upper tract urothelial carcinoma collaboration. Cancer. 2009;115(6):1224–1233. doi: 10.1002/cncr.24135. [DOI] [PubMed] [Google Scholar]
- 30.Kondo T, Nakazawa H, Ito F, Hashimoto Y, Toma H, Tanabe K. Primary site and incidence of lymph node metastases in urothelial carcinoma of upper urinary tract. Urology. 2007;69(2):265–269. doi: 10.1016/j.urology.2006.10.014. [DOI] [PubMed] [Google Scholar]
- 31.Kondo T, Hara I, Takagi T, et al. Template-based lymphadenectomy in urothelial carcinoma of the renal pelvis: A prospective study. Int J Urol. 2014;21(5):453–459. doi: 10.1111/iju.12417. [DOI] [PubMed] [Google Scholar]
- 32.Fajkovic H, Cha EK, Xylinas E, et al. Disease-free survival as a surrogate for overall survival in upper tract urothelial carcinoma. World J Urol. 2013;31(1):5–11. doi: 10.1007/s00345-012-0939-5. [DOI] [PubMed] [Google Scholar]
- 33.Morgan TM, Barocas DA, Penson DF, et al. Lymph node yield at radical cystectomy predicts mortality in node-negative and not node-positive patients. Urology. 2012;80(3):632–640. doi: 10.1016/j.urology.2012.03.070. [DOI] [PubMed] [Google Scholar]
- 34.Smith DD, Schwarz RR, Schwarz RE. Impact of total lymph node count on staging and survival after gastrectomy for gastric cancer: Data from a large US-population database. J Clin Oncol. 2005;23(28):7114–7124. doi: 10.1200/JCO.2005.14.621. [DOI] [PubMed] [Google Scholar]


