

Abstract
Objective. To investigate whether calcium-sensing receptor (CaSR) plays a role in calcium-oxalate-induced renal injury. Materials and Methods. HK-2 cells and rats were treated with calcium oxalate (CaOx) crystals with or without pretreatment with the CaSR-specific agonist gadolinium chloride (GdCl3) or the CaSR-specific antagonist NPS2390. Changes in oxidative stress (OS) in HK-2 cells and rat kidneys were assessed. In addition, CaSR, extracellular signal-regulated protein kinase (ERK), c-Jun N-terminal protein kinase (JNK), and p38 expression was determined. Further, crystal adhesion assay was performed in vitro, and the serum urea and creatinine levels and crystal deposition in the kidneys were also examined. Results. CaOx increased CaSR, ERK, JNK, and p38 protein expression and OS in vitro and in vivo. These deleterious changes were further enhanced upon pretreatment with the CaSR agonist GdCl3 but were attenuated by the specific CaSR inhibitor NPS2390 compared with CaOx treatment alone. Pretreatment with GdCl3 further increased in vitro and in vivo crystal adhesion and renal hypofunction. In contrast, pretreatment with NPS2390 decreased in vitro and in vivo crystal adhesion and renal hypofunction. Conclusions. CaOx-induced renal injury is related to CaSR-mediated OS and increased mitogen-activated protein kinase (MAPK) signaling, which subsequently leads to CaOx crystal adhesion.
1. Introduction
Urolithiasis is the third most common disease of the urinary tract, and it respects no geographical, racial, or cultural boundaries. Further, it is associated with a high recurrence rate [1]. Stones composed of calcium oxalate (CaOx), either alone or mixed with calcium phosphate, are hitherto the most common uroliths, accounting for more than 80% of stones [2]. Although currently available stone removal techniques, such as extracorporeal shock wave lithotripsy (ESWL), ureteroscopy (URS), and percutaneous nephrolithotomy (PNL), are considered effective, they are costly. Thus, these techniques are an option for only a limited number of patients [3]. Additionally, compelling data suggest that these techniques have some serious side effects [3]. Despite the substantial progress of studies of the biological and physical manifestations of urolithiasis, the mechanism underlying CaOx stone formation remains unclear. In our previous study, we found that apocynin, “a selective NADPH oxidase inhibitor,” reduces crystal deposition by modulating oxidative stress (OS) and thereby decreasing urolithiasis-related protein expression [4].
Calcium-sensing receptor (CaSR), a member of the G-protein-coupled receptor (GPCRs) superfamily, plays significant roles in cell hormone secretion, inflammation, apoptosis, and differentiation [5–7]. CaSR is organized into three major structural domains: a large amino-terminal extracellular domain, the typical seven transmembrane domains, and a cytoplasmic carboxy terminus [8]. It is modulated by not only Ca2+ but also a large number of ions/molecules, including many cations (e.g., Gd3+ and Mg2+), polyamines, and some antibiotics [9]. In different populations, a polymorphism in the CaSR gene leading to the Arg990Gly mutation has been reported to be associated with hypercalciuria and nephrolithiasis [10].
CaOx increases OS, which regulates crystal formation, growth, and retention through the timely production of crystallization modulators [11]. OS upregulates the expression of various factors, including bikunin, osteopontin (OPN), and the Tamm-Horsfall protein, and activates the p38 mitogen-activated protein kinase (MAPK) pathway. MAPKs, an important group of serine and threonine signaling kinases, consist of the following three family members: (1) c-Jun N-terminal kinase (JNK) MAPK, (2) p38 MAPK, and (3) ERK MAPK. Koul et al. [12] have reported that the p38 MAPK signaling pathway is activated by calcium oxalate monohydrate (COM) crystals and that this pathway may transduce critical signals for DNA synthesis in renal epithelial cells [12].
CaOx-induced OS, which causes further injury to renal cells, is considered a risk factor for crystallization and crystal deposition in the kidneys because it promotes crystal nucleation, aggregation, and retention and stone development [13, 14]. Wang et al. [15] have reported that lipopolysaccharide-induced cardiomyocyte injury is related to CaSR-mediated OS and increases in the tumor necrosis factor-α (TNF-α) and interleukin-6 (IL-6) levels. It remains unknown whether CaSR plays a role in CaOx-induced injury in cells and in animal models of urolithiasis.
Therefore, the present study was designed to examine the possible effects of CaSR in a model of CaOx-induced nephrolithiasis and to provide direct physiological and biochemical evidence of whether CaSR is involved in this process.
2. Materials and Methods
2.1. Materials
Quinoxaline-2-carboxylic acid adamantan-1-ylamide (NPS2390, CAS number 226878-01-9) was purchased from Tocris Bioscience (USA). GdCl3 (product number 43977-0) was purchased from Sigma-Aldrich (St. Louis, MO, USA). Anti-phospho-p38 (ab45381), anti-phospho-JNK (ab4821), anti-phospho-ERK (ab21396), and anti-CaSR (ab79038) antibodies were purchased from Abcam (USA). Glyceraldehyde-3-phosphate dehydrogenase (GAPDH) was purchased from Sigma-Aldrich (St. Louis, MO, USA).
2.2. Preparation of COM Crystals
COM crystals were prepared as previously described [16]. Briefly, equal volumes of 10 mM sodium oxalate and 10 mM CaCl2 were mixed at room temperature. COM crystals formed immediately, and the suspension was equilibrated for 3 days at 4°C. The crystals were then washed with deionized water and dried at 60°C. The crystals were confirmed to be COM by Fourier transform infrared spectroscopy. A stock solution of COM (5 mg/mL) was prepared in sterile phosphate-buffered saline (PBS). The COM crystal solution was distributed homogeneously across the monolayer, where it settled on top of the cells under the force of gravity (μg/cm2 of cells). In addition, in our experiment, when the COM stock solution was added to the cells, PBS was also added so that the volumes were the same for all groups.
2.3. Cell Culture and Treatment
HK-2 cells were purchased from the National Platform of Experimental Cell Resources for Science (Beijing, China). Human kidney epithelial cells (HK-2) were maintained in Dulbecco's modified Eagle's medium (DMEM) supplemented with 10% fetal bovine serum (FBS) and 1% antibiotics. The cultures were maintained at 37°C in a 5% CO2/95% O2 humidified atmosphere. COM was prepared using the above-described method. HK-2 cells were stimulated with COM at different doses (0, 33.5, 67, 134, or 268 μg/cm2 of cells) for different periods of time (3 to 48 h) to determine changes in CaSR expression in vitro. Then, CaSR protein expression levels were measured by western blotting. HK-2 cells were pretreated with the CaSR activator GdCl3 (300 μM) for 30 min or with the CaSR inhibitor NPS2390 (10 μM) for 60 min and were then exposed to COM (67 μg/cm2 of cells) for 6 h. The medium was removed and saved, and the cells were washed three times with serum-free DMEM and harvested for further analysis. Then, the cells were collected, and the levels of superoxide dismutase (SOD), malondialdehyde (MDA), CaSR, and MAPK were determined. The medium was removed and saved for measurement of the 8-isoprostane (8-IP) level.
2.4. COM Crystal Adhesion Assay
COM crystal adhesion assay was performed using a previously described method [17]. Three days after HK-2 cells were seeded and cultured, they were randomly divided into the following four groups: (1) control group: HK-2 cells were continuously cultured at 37°C for 6 h in DMEM; (2) COM group: HK-2 cells were incubated with COM (67 μg/cm2 of cells) at 37°C for 6 h; (3) COM+GdCl3 group: HK-2 cells were pretreated with the CaSR activator GdCl3 (300 μM) for 30 min, and then COM crystals were added to the growth medium (67 μg crystals/cm2 of cells) at 37°C for 6 h; and (4) COM+NPS2390 group: HK-2 cells were pretreated with the CaSR inhibitor NPS2390 (10 μM) for 60 min, and then COM crystals were added to the growth medium (67 μg crystals/cm2 of cells) at 37°C for 6 h.
Next, the unbound crystals were removed, and the cells were washed three times with PBS. The remaining crystals adhered on the cell surface were counted in 15 randomized high-power fields (HPFs) under a phase contrast microscope (Olympus CKX41, Olympus Co. Ltd., Tokyo, Japan). This experiment was performed in triplicate for all conditions.
2.5. Experimental Animals and Animal Treatments
Sprague-Dawley (SD) rats (180 to 200 g) from the Animal Experiment Center of Lanzhou University were maintained under standard laboratory conditions (25 ± 2°C at 40 to 60% relative humidity with a 12-hour light-dark cycle). All of the procedures and experimental protocols were approved by the Institutional Animal Care and Use Committee of Lanzhou University. Forty male SD rats were divided into 4 equal groups. The control group was fed a standard diet and served as the intact control group. The ethylene glycol (EG) group was fed a standard commercial diet with 1% EG for 28 days to induce urolithiasis. The EG+GdCl3 group received EG and was injected with 8.67 mg/kg/day GdCl3 for 4 weeks. The EG+NPS-2390 group received EG and was injected with 0.20 g/kg NPS-2390 for 4 weeks [8]. After 4 weeks, the rats were euthanized, and the left kidneys were fixed with formalin for hematoxylin and eosin (H&E) staining. The right kidneys were maintained in a −80°C freezer for western blotting.
2.6. Biochemical Examination
The serum creatinine and blood urea nitrogen levels were determined using an automatic clinical chemistry analyzer (Hitachi 7600, Tokyo, Japan).
2.7. OS Studies
Cells were lysed using a cell lysis buffer at room temperature, and, after approximately 20 min, lysates were collected for measurement of the SOD and MDA levels. Nine volumes of cold phosphate buffer (pH 7.4) were mixed with 0.1 g kidney tissues, and the tissues were then homogenized. Next, the homogenates were centrifuged (16,000 ×g at 4°C for 5 min) to obtain supernatants. Both the supernatants and cell lysates were used for measurement of the SOD and MDA levels using two kits (Jiancheng Bioengineering, Nanjing, China). In addition, the urine and media were collected for measurement of the 8-IP levels using an enzyme-linked immunosorbent assay kit, according to the manufacturer's instructions (Quantikine Assay, R&D Systems, USA).
2.8. Kidney Crystal Deposition
Paraffin-embedded kidney sections (5 μm) were stained with H&E. The number of crystal depositions in the renal tubules was determined by assessing 10 randomly selected fields per kidney. Crystal deposition scoring included the following scores: (1) no deposition = 0 points; (2) deposition in the papillary tip = 1 point; (2) deposition in the corticomedullary junction = 2 points; and (3) deposition in the cortex = 3 points. If crystal depositions were observed at multiple sites, the points were combined for a total score per kidney.
2.9. Pathological Examination
The pathological changes were scored according to the area of renal injury as follows: (1) invisible lesions = 0 points; (2) tubule interstitial inflammatory infiltration with a lesion area of <20% and mild dilation of tubules = 1 point; (3) tubule interstitial inflammatory infiltration with a lesion area of <40% and obvious dilation of tubules = 2 points; and (4) tubule interstitial inflammatory infiltration with a lesion area of >40% and severe dilation of tubules = 3 points.
2.10. Western Blotting Analysis
A total of 0.1 g renal tissue in 1 mL lysis buffer mixed with 10 μL phenylmethanesulfonyl fluoride (PMSF, 100 mM) and NaF (100 mM) was homogenized. Then, the homogenates were centrifuged (12,000 ×g for 5 min) at 4°C, and the supernatants were collected. After being washed twice with ice-cold PBS, the cells were incubated with protein lysates containing PMSF and NaF for 30 min. Then, the cells were collected, mechanically disrupted, and centrifuged at 12,000 rpm for 15 min at 4°C to isolate the nuclei. A BCA protein assay kit was used to determine the protein concentrations. Equivalent amounts of protein were mixed with SDS-PAGE sample loading buffer. The mixture was heated at 100°C for 5 min. Then, the samples were run via sodium dodecyl sulfate-polyacrylamide gel electrophoresis (SDS-PAGE) using a 10% acrylamide resolving gel, and the separated proteins were transferred to polyvinylidene fluoride (PVDF) membranes. The membranes were blocked with 5% skim milk powder at room temperature for 2 h. Then, they were incubated with a phospho-JNK, phospho-p38, or phospho-ERK antibody at 4°C overnight. Subsequently, they were washed three times in TBST for 10 min, incubated with the respective antibody labeled with horseradish peroxidase (1 : 5000) for 2 h, and washed again with TBST as described above. Finally, the proteins were detected by enhanced chemiluminescence.
2.11. Statistical Analysis
The data are presented as the mean ± standard error. Student's t-test for comparisons between two groups and one-way analysis of variance (ANOVA) for comparisons between three or more groups were used to detect significant differences. A P value of <0.05 was considered statistically significant.
3. Results
CaSR protein expression in HK-2 cells exposed to varying COM doses (0, 33.5, 67, 134, or 268 μg/cm2 of cells) for varying amounts of time (3 to 48 h) was determined by western blotting.
The response was both concentration- and time-dependent (Figures 1(a) and 1(b)). Figure 1(a) indicates that CaSR protein expression in HK-2 cells was the highest following exposure to 134 μg COM crystals/cm2 of cells. Figure 1(b) indicates that CaSR protein expression was the highest following exposure to 67 μg crystals/cm2 of cells for 6 h.
Figure 1.

COM affects CaSR protein expression in HK-2 cells. (a) Cells were induced by COM (0, 33.5, 67, 134, or 268 μg/cm2 of cells) for 6 h, and then CaSR protein expression was examined by western blotting. (b) Cells were treated with COM (67 μg/cm2 of cells) for 0, 3, 6, 24, and 48 h, and then CaSR protein expression was examined by western blotting. The data are presented as the mean ± standard error of the mean (SEM) (n = 5).
3.1. Effects of CaSR on P-ERK1/2, P-JNK, and P-p38 Protein Expression in HK-2 Cells Exposed to COM
To determine whether CaSR is involved in the mitogen-activated protein kinase signaling pathway, ERK1/2, JNK, and p38 expression was analyzed by western blotting. The results showed that the total ERK1/2, JNK, and p38 expression levels were similar among the different groups. Following exposure of the cells to COM, CaSR, P-p38, P-ERK1/2, and P-JNK expression was upregulated (Figure 2) (P < 0.05), and this effect was further enhanced by GdCl3 and reduced by NPS-2390 (P < 0.05) (Figures 2(a), 2(b), 2(c), and 2(d)).
Figure 2.

CaSR and MAPK expression in HK-2 cells in the different groups, as determined by western blotting. (1) Control group: HK-2 cells were continuously cultured at 37°C for 6 h in DMEM. (2) COM group: HK-2 cells were incubated with COM (67 μg/cm2 of cells) at 37°C for 6 h. (3) COM+GdCl3 group: HK-2 cells were pretreated with the CaSR activator GdCl3 (300 μM) for 30 min, and then COM crystals were added to the growth medium (67 μg crystals/cm2 of cells) at 37°C for 6 h. (4) COM+NPS2390 group: HK-2 cells were pretreated with the CaSR inhibitor NPS2390 (10 μM) for 60 min, and then COM crystals were added to the growth medium (67 μg crystals/cm2 of cells) at 37°C for 6 h. The data are expressed as the mean ± SEM. ∗ P < 0.05 compared with the control group and # P < 0.05 compared with the COM group (n = 5).
3.2. Effects of CaSR on COM Adherence to Cells in Crystal Adhesion Assay
We also evaluated the functional significance of the increase in CaSR expression induced by COM. We hypothesized that high CaSR expression could enhance COM crystal adhesion to the cell surface, thus playing a significant role in this phenomenon. Our hypothesis was addressed by performing COM crystal adhesion assay. The results demonstrated that GdCl3 significantly increased the number of adherent COM crystals (Figure 3) (P < 0.05). Moreover, neutralization of CaSR expression by NPS-2390 resulted in a dramatic reduction in the number of adherent COM crystals (P < 0.05).
Figure 3.
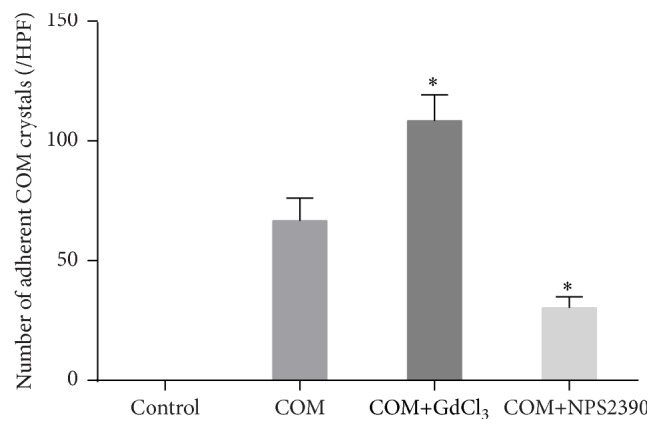
COM crystal adhesion assay. (1) Control group: HK-2 cells were continuously cultured at 37°C for 6 h in DMEM. (2) COM group: HK-2 cells were incubated with COM (67 μg/cm2 of cells) at 37°C for 6 h. (3) COM+GdCl3 group: HK-2 cells were pretreated with the CaSR activator GdCl3 (300 μM) for 30 min, and then COM crystals were added to the growth medium (67 μg crystals/cm2 of cells) at 37°C for 6 h. (4) COM+NPS2390 group: HK-2 cells were pretreated with the CaSR inhibitor NPS2390 (10 μM) for 60 min, and then COM crystals were added to the growth medium (67 μg crystals/cm2 of cells) at 37°C for 6 h. After removing the unbound crystals, the remaining crystals adhered on the cell surface were counted in 15 randomized high-power fields (HPFs) under a phase contrast microscope (Olympus CKX41). Each bar was generated from 3 independent experiments. ∗ P < 0.05 compared with the COM group.
3.3. Changes in SOD, MDA, and 8-IP Levels in the Four Groups of HK-2 Cells
The MDA and 8-IP levels were increased and the SOD level was decreased in COM-treated HK-2 cells compared with untreated cells (P < 0.05) (Figures 4(a), 4(b), and 4(c)). OS was further increased after treatment with GdCl3. However, when CaSR expression was decreased by NPS-2390, SOD activity was restored, and the MDA and 8-IP levels were reduced compared with those in the COM-treated cells (Figures 4(a), 4(b), and 4(c)) (P < 0.05).
Figure 4.

Levels of SOD activity and MDA in cells and of 8-IP in culture medium in the different groups. ∗ P < 0.05 compared with the control group and # P < 0.05 compared with the COM group (n = 10).
3.4. Serum Urea, Serum Creatinine, and OS in Rats
As shown in Table 1, increases in the serum urea and serum creatinine levels were observed in the EG group compared with the control group, and treatment with NPS2390 improved renal function to approximately normal levels. However, treatment with GdCl3 further decreased renal function compared with that in the EG group (P < 0.05).
Table 1.
Renal function and OS parameters in all groups ().
| Group | Serum BUN (mmol/L) | Serum Cr (μmol/L) | MDA (nmol/mg protein) | SOD (μ/mg protein) | 8-IP (pg/mL) |
|---|---|---|---|---|---|
| Control | 8.45 ± 1.01 | 6.75 ± 0.84 | 1.18 ± 0.34 | 323.56 ± 35.93 | 2.96 ± 0.31 |
| EG | 10.62 ± 1.31 | 8.87 ± 0.89 | 1.99 ± 0.18∗ | 213.11 ± 15.37∗ | 8.11 ± 1.04∗ |
| EG+GdCl3 | 15.54 ± 1.85∗# | 17.16 ± 1.38∗# | 3.56 ± 0.57∗# | 138.26 ± 11.36∗# | 17.87 ± 1.96∗# |
| EG+NPS2390 | 8.76 ± 0.52 | 7.74 ± 1.21 | 1.24 ± 0.11# | 296.89 ± 31.94# | 3.01 ± 0.63# |
∗ P < 0.05 compared with the control group and # P < 0.05 compared with the EG group (n = 10).
The MDA and 8-IP levels were significantly elevated in the EG group, while SOD activity was decreased, indicating that CaOx induced OS. In addition, the MDA and 8-IP levels were decreased and SOD activity was restored in the EG+NPS2390 group compared with the EG group (P < 0.05). However, the levels of these OS indicators were significantly elevated in the EG+GdCl3 group compared with the EG group (P < 0.05).
3.5. CaOx Crystal Deposition and Histological Examination
The H&E-stained kidney sections were observed using an optical microscope (Figures 5(a), 5(b), 5(c), and 5(d)). CaOx crystals (black arrow) were noted in all parts of the kidney in the EG group (Figure 5(b)), especially in the renal cortex. Few crystals were observed in the EG+NPS2390 group compared with the EG group (P < 0.05) (Figure 5(e)). The scoring of crystal deposition revealed a significantly increased number of deposits in the EG+GdCl3 group compared with the EG group (Figure 5(e)). Histological examination revealed that the EG group exhibited severe tubule dilation and inflammatory infiltration (yellow arrow) (Figure 5(b)). The pathological score of the EG+NPS2390 group was significantly reduced compared with that of the EG group (P < 0.05) (Figure 5(e)); however, the pathological score of the EG+GdCl3 group was increased (P < 0.05) (Figure 5(e)).
Figure 5.

Representative microscopic photographs showing crystal deposits and pathological changes in rat kidneys. (a) The control group rats were fed a standard diet and served as the intact control group. (b) The EG group rats were fed a standard commercial diet with 1% ethylene glycol for 28 days to induce nephrolithiasis. (c) The EG+GdCl3 group rats received EG and were injected with 8.67 mg/kg/day GdCl3 for 4 weeks. (d) The EG+NPS2390 group rats received EG and were injected with 0.20 g/kg NPS2390 for 4 weeks. (e) Scores for crystal deposition and pathological alterations. The columns and bars represent the mean ± SEM (∗ P < 0.05 compared with the EG group, magnification: ×100, n = 10).
3.6. Western Blot Analysis of CaSR in the Kidneys
CaSR expression was observed in all of the groups (Figure 6(a)). However, its expression was weak in the control group. In contrast, western blot analysis revealed significant upregulation of CaSR expression in the EG group (Figure 6(a)). In addition, its expression was increased in the EG+GdCl3 group compared with the EG group (P < 0.05) (Figure 6(a)) and was reduced in the EG+NPS2390 group (P < 0.05) (Figure 6(a)).
Figure 6.

Detection of CaSR and MAPK protein expression in rat kidneys in the different groups. Western blot analysis of CaSR (a) expression in rat kidneys. Western blot analysis of phosphorylated p38 (b), JNK (c), and ERK1/2 (d) expression and of total p38, JNK, and ERK1/2 expression in rat kidneys. The data are expressed as the mean ± SEM. ∗ P < 0.05 compared with the control group and # P < 0.05 compared with the EG group (n = 5).
3.7. Effects of CaSR on ERK1/2, JNK, and p38 Protein Expression in Nephrolithiasis Rats
The results showed that the total ERK1/2, JNK, and p38 protein levels were similar among the different groups. Following treatment of the rats with EG, P-ERK1/2, P-p38, and P-JNK expression was upregulated (P < 0.05). In addition, when the high CaSR expression in the EG group was silenced by NPS2390, P-ERK1/2, P-p38, and P-JNK expression was decreased (P < 0.05) (Figures 6(b), 6(c), and 6(d)). Moreover, when the already high CaSR expression in the EG group was further enhanced by GdCl3 treatment, P-ERK1/2, P-p38, and P-JNK expression was also increased (P < 0.05) (Figures 6(b), 6(c), and 6(d)).
4. Discussion
CaSR is expressed in renal tissues. Increasing evidence indicates that CaSR may play a role in the formation of kidney stones. However, its role in CaOx-induced renal dysfunction has yet to be fully elucidated. CaOx-induced renal injury causes structural changes to the kidney; in addition to decreased renal function, changes in renal injury signaling pathways, renal protein levels, apoptosis, and fibrosis have been reported [18, 19]. Studies have also demonstrated that renal epithelial cells respond to increased CaOx crystal formation by producing macromolecular proteins, such as p38, OPN, hyaluronic acid, a-1-microglobulin, Tamm-Horsfall protein, and prothrombin fragment-1, which subsequently affect the crystal deposition process [12, 20].
CaSR, the encoding gene of which is a candidate gene for nephrolithiasis, may underlie the predisposition of some individuals to calcium nephrolithiasis [21]. Studies have demonstrated that injury to the rat myocardium induced by lipopolysaccharide is mediated by CaSR [15]. However, little is known about the role of CaSR in the formation of CaOx nephrolithiasis. In the present study, we used NPS2390 (a specific CaSR antagonist) and GdCl3 (a specific CaSR activator) to evaluate the involvement of CaSR in CaOx nephrolithiasis and to explore the possible underlying mechanism.
The results showed that EG administration for 28 days led to an increase in CaSR protein expression in the kidneys of the lithic model rats. These data strongly indicate that CaSR is involved in nephrolithiasis formation. The results of the experiment using HK-2 cells further confirmed this phenomenon. COM treatment resulted in a time- and concentration-dependent increase in CaSR expression in HK-2 cells. Although many cations (e.g., Gd3+ and Mg2+), polyamines, and some antibiotics activate CaSR expression [9], we found that CaOx crystals also induced its expression in renal epithelial cells in both the in vitro experiments and animal models in the present study. In contrast with many cations (e.g., Gd3+ and Mg2+), COM is an insoluble crystal and cannot penetrate cells. Thus, we suggest that COM may activate CaSR through its large amino terminus in the extracellular domain. However, further experiments are needed to verify this hypothesis.
High OS, activation of MAPK signaling pathways, renal dysfunction, and massive CaOx deposition were also observed in HK-2 cells and renal tubules compared with those in the control groups. Furthermore, these changes were enhanced or weakened by a CaSR agonist or its antagonist, respectively, suggesting that CaSR activation regulates these indexes.
MAPKs [22, 23], an important group of serine and threonine signaling kinases, consist of the following three family members: (1) JNK MAPK, (2) p38 MAPK, and (3) ERK MAPK [24]. A recent study has demonstrated that CaSR upregulates the p38 MAPK pathway in H9c2 cardiomyoblast cells [25]. Additionally, Koul et al. [12] have reported that the p38 and JNK signal transduction pathways are activated by COM crystals in renal epithelial cells [12]. We used a CaSR antagonist and activator to evaluate the relationship between MAPK and CaSR in the formation of nephrolithiasis. We found that COM increased the P-38, P-ERK, and P-JNK levels, consistent with the results of previous studies [12, 18, 19]. These increases could be enhanced by GdCl3 or reduced by NPS2390 compared with the COM group, suggesting that CaSR mediates the COM-induced activation of the MAPK signaling pathway in HK-2 cells. Clearly, the activation of MAPK is involved in many complex processes, including cell death inhibition and the production of inflammatory cytokines following cellular stress [26]. JNK mediates various cellular responses, including programmed cell death (apoptosis), epithelial sheet movement, and planar polarity [27]. Additionally, cellular death may lead to adherence of an increased number of crystals to the surfaces of HK-2 cells, as well as increased crystal formation. Studies have also suggested that p38 MAPK activation by OS, pathogens, and proinflammatory cytokines downregulates tight junctions in many cell types [28–30]. The downregulation of tight junctions, which have a role in epithelial barrier function, may lead to increased crystal retention.
The COM-induced generation of OS may be the initial trigger of a vicious cycle of kidney stone formation [31, 32]. An excessive amount of crystals can trigger the production of reactive oxygen species (ROS) in kidney tissues. ROS production leads to renal epithelial injury and apoptosis, which provide sites for crystal attachment and the eventual retention of crystals within the kidneys [33, 34]. Furthermore, cell degradation following renal epithelial injury results in the generation of numerous membranous vesicles, which are effective crystal nucleators, the enhancement of crystal nucleation at low supersaturation, and the promotion of crystal-cell interactions [35]. In our previous study, we have shown that melamine-related nephrolithiasis results in increased OS in vitro and in vivo. In addition, we have demonstrated that prophylactic apocynin (a selective NADPH oxidase inhibitor) treatment reduces renal melamine-related crystal deposition, potentially by modulating OS and thereby decreasing P-p38 and osteopontin expression. Thus, NADPH oxidase appears to be a particularly significant enzyme among the enzymatic systems involved in melamine-induced OS production [4]. In the present study, we found that OS was significantly increased by exposure to COM crystals. This increased OS could be enhanced by the CaSR agonist GdCl3 or attenuated by the CaSR inhibitor NPS2390, suggesting that CaSR mediates COM-induced OS. With regard to kidney stone formation in rats, crystals might cause renal injury and dysfunction. Pathological changes in the kidneys cause crystal retention. Lethal epithelial cell injury promotes crystal nucleation, aggregation, and retention. Sublethal injury or cell dysfunction may result in the generation of ineffective crystallization modulators and localized areas of supersaturation in the interstitium. Therefore, the increased CaOx-induced OS observed in the EG+GdCl3 group compared with the EG group could lead to increased crystal retention and dysfunction. Alternatively, the decreased OS detected in the EG+NPS2390 group might inhibit the vicious cycle of kidney stone formation.
The present study provides direct evidence that CaSR is present in HK-2 cells and rat kidneys. Notably, CaSR upregulation might increase intracellular MAPK signaling and induce OS, potentially leading to crystal retention and ultimately damage to renal function. These findings may provide an explanation for the role of CaSR in COM-induced renal injury.
5. Conclusion
In summary, activation of CaSR might lead to crystal retention and renal dysfunction by activation of MAPK pathways, as well as the production of excessive OS. These findings may be used to identify potential therapeutic and pharmacological targets.
Acknowledgments
This study was supported by the Gansu Province Outstanding Youth Science Fund Project (Grant no. 1111RJDA0001).
Abbreviations
- CaSR:
Calcium-sensing receptor
- CaOx:
Calcium oxalate
- EG:
Ethylene glycol
- OS:
Oxidative stress
- SD:
Sprague-Dawley
- SOD:
Superoxide dismutase
- ROS:
Reactive oxygen species
- MDA:
Malondialdehyde
- MAPK:
Mitogen-activated protein kinase
- ERK:
Extracellular signal-regulated protein kinase
- JNK:
c-Jun N-terminal protein kinase
- OPN:
Osteopontin
- ESWL:
Extracorporeal shock wave lithotripsy
- URS:
Ureteroscopy
- PNL:
Percutaneous nephrolithotomy
- PBS:
Phosphate-buffered saline
- BUN:
Blood urea nitrogen
- Cr:
Serum creatinine
- GAPDH:
Glyceraldehyde-3-phosphate dehydrogenase
- SEM:
Standard error of the mean
- FBS:
Fetal bovine serum
- DMEM:
Dulbecco's modified Eagle's medium.
Competing Interests
The authors declare that they have no competing interests.
References
- 1.Bashir S., Gilani A. H., Siddiqui A. A., et al. Berberis vulgaris root bark extract prevents hyperoxaluria induced urolithiasis in rats. Phytotherapy Research. 2010;24(8):1250–1255. doi: 10.1002/ptr.3196. [DOI] [PubMed] [Google Scholar]
- 2.Tiselius H.-G. Epidemiology and medical management of stone disease. BJU International. 2003;91(8):758–767. doi: 10.1046/j.1464-410X.2003.04208.x. [DOI] [PubMed] [Google Scholar]
- 3.Srisubat A., Potisat S., Lojanapiwat B., Setthawong V., Laopaiboon M. Extracorporeal shock wave lithotripsy (ESWL) versus percutaneous nephrolithotomy (PCNL) or retrograde intrarenal surgery (RIRS) for kidney stones. The Cochrane Database of Systematic Reviews. 2014;11 doi: 10.1002/14651858.cd007044.pub3.CD007044 [DOI] [PubMed] [Google Scholar]
- 4.Li X., Lu J., Shang P., Bao J., Yue Z. The selective NADPH oxidase inhibitor apocynin has potential prophylactic effects on melamine-related nephrolithiasis in vitro and in vivo. Molecular and Cellular Biochemistry. 2015;399(1-2):167–178. doi: 10.1007/s11010-014-2243-8. [DOI] [PubMed] [Google Scholar]
- 5.Tu C.-L., Chang W., Xie Z., Bikle D. D. Inactivation of the calcium sensing receptor inhibits E-cadherin-mediated cell-cell adhesion and calcium-induced differentiation in human epidermal keratinocytes. The Journal of Biological Chemistry. 2008;283(6):3519–3528. doi: 10.1074/jbc.m708318200. [DOI] [PubMed] [Google Scholar]
- 6.Molostvov G., Fletcher S., Bland R., Zehnder D. Extracellular calcium-sensing receptor mediated signalling is involved in human vascular smooth muscle cell proliferation and apoptosis. Cellular Physiology and Biochemistry. 2008;22(5-6):413–422. doi: 10.1159/000185484. [DOI] [PubMed] [Google Scholar]
- 7.Kantham L., Quinn S. J., Egbuna O. I., et al. The calcium-sensing receptor (CaSR) defends against hypercalcemia independently of its regulation of parathyroid hormone secretion. American Journal of Physiology—Endocrinology and Metabolism. 2009;297(4):E915–E923. doi: 10.1152/ajpendo.00315.2009. [DOI] [PMC free article] [PubMed] [Google Scholar]
- 8.Qi H., Cao Y., Huang W., et al. Crucial role of calcium-sensing receptor activation in cardiac injury of diabetic rats. PLoS ONE. 2013;8(5) doi: 10.1371/journal.pone.0065147.e65147 [DOI] [PMC free article] [PubMed] [Google Scholar]
- 9.Smajilovic S., Tfelt-Hansen J. Novel role of the calcium-sensing receptor in blood pressure modulation. Hypertension. 2008;52(6):994–1000. doi: 10.1161/HYPERTENSIONAHA.108.117689. [DOI] [PubMed] [Google Scholar]
- 10.Vezzoli G., Terranegra A., Soldati L. Calcium-sensing receptor gene polymorphisms in patients with calcium nephrolithiasis. Current Opinion in Nephrology and Hypertension. 2012;21(4):355–361. doi: 10.1097/MNH.0b013e3283542290. [DOI] [PubMed] [Google Scholar]
- 11.Khan S. R. Reactive oxygen species, inflammation and calcium oxalate nephrolithiasis. Translational Andrology and Urology. 2014;3(3):256–276. doi: 10.3978/j.issn.2223-4683.2014.06.04. [DOI] [PMC free article] [PubMed] [Google Scholar]
- 12.Koul H. K., Menon M., Chaturvedi L. S., et al. COM crystals activate the p38 mitogen-activated protein kinase signal transduction pathway in renal epithelial cells. The Journal of Biological Chemistry. 2002;277(39):36845–36852. doi: 10.1074/jbc.m200832200. [DOI] [PubMed] [Google Scholar]
- 13.Aihara K., Byer K. J., Khan S. R. Calcium phosphate-induced renal epithelial injury and stone formation: involvement of reactive oxygen species. Kidney International. 2003;64(4):1283–1291. doi: 10.1046/j.1523-1755.2003.00226.x. [DOI] [PubMed] [Google Scholar]
- 14.Byer K., Khan S. R. Citrate provides protection against oxalate and calcium oxalate crystal induced oxidative damage to renal epithelium. Journal of Urology. 2005;173(2):640–646. doi: 10.1097/01.ju.0000143190.49888.c7. [DOI] [PubMed] [Google Scholar]
- 15.Wang H.-Y., Liu X.-Y., Han G., et al. LPS induces cardiomyocyte injury through calcium-sensing receptor. Molecular and Cellular Biochemistry. 2013;379(1-2):153–159. doi: 10.1007/s11010-013-1637-3. [DOI] [PMC free article] [PubMed] [Google Scholar]
- 16.Chen S., Gao X., Sun Y., Xu C., Wang L., Zhou T. Analysis of HK-2 cells exposed to oxalate and calcium oxalate crystals: proteomic insights into the molecular mechanisms of renal injury and stone formation. Urological Research. 2010;38(1):7–15. doi: 10.1007/s00240-009-0226-0. [DOI] [PubMed] [Google Scholar]
- 17.Kanlaya R., Fong-Ngern K., Thongboonkerd V. Cellular adaptive response of distal renal tubular cells to high-oxalate environment highlights surface alpha-enolase as the enhancer of calcium oxalate monohydrate crystal adhesion. Journal of Proteomics. 2013;80:55–65. doi: 10.1016/j.jprot.2013.01.001. [DOI] [PubMed] [Google Scholar]
- 18.Chaturvedi L. S., Koul S., Sekhon A., Bhandari A., Menon M., Koul H. K. Oxalate selectively activates p38 mitogen-activated protein kinase and c-Jun N-terminal kinase signal transduction pathways in renal epithelial cells. Journal of Biological Chemistry. 2002;277(15):13321–13330. doi: 10.1074/jbc.M108203200. [DOI] [PubMed] [Google Scholar]
- 19.Khan S. R. Crystal-induced inflammation of the kidneys: results from human studies, animal models, and tissue-culture studies. Clinical and Experimental Nephrology. 2004;8(2):75–88. doi: 10.1007/s10157-004-0292-0. [DOI] [PubMed] [Google Scholar]
- 20.Aggarwal K. P., Narula S., Kakkar M., Tandon C. Nephrolithiasis: molecular mechanism of renal stone formation and the critical role played by modulators. BioMed Research International. 2013;2013:21. doi: 10.1155/2013/292953.292953 [DOI] [PMC free article] [PubMed] [Google Scholar] [Retracted]
- 21.Vezzoli G., Terranegra A., Arcidiacono T., Soldati L. Genetics and calcium nephrolithiasis. Kidney International. 2011;80(6):587–593. doi: 10.1038/ki.2010.430. [DOI] [PubMed] [Google Scholar]
- 22.Gao J., Li J., Ma L. Regulation of EGF-induced ERK/MAPK activation and EGFR internalization by G protein-coupled receptor kinase 2. Acta Biochimica et Biophysica Sinica. 2005;37(8):525–531. doi: 10.1111/j.1745-7270.2005.00076.x. [DOI] [PubMed] [Google Scholar]
- 23.Gripentrog J. M., Miettinen H. M. Activation and nuclear translocation of ERK1/2 by the formyl peptide receptor is regulated by G protein and is not dependent on β-arrestin translocation or receptor endocytosis. Cellular Signalling. 2005;17(10):1300–1311. doi: 10.1016/j.cellsig.2005.01.006. [DOI] [PubMed] [Google Scholar]
- 24.Kyriakis J. M., Avruch J. Mammalian mitogen-activated protein kinase signal transduction pathways activated by stress and inflammation. Physiological Reviews. 2001;81(2):807–869. doi: 10.1152/physrev.2001.81.2.807. [DOI] [PubMed] [Google Scholar]
- 25.Chi J., Zhu Y., Fu Y., et al. Cyclosporin A induces apoptosis in H9c2 cardiomyoblast cells through calcium-sensing receptor-mediated activation of the ERK MAPK and p38 MAPK pathways. Molecular and Cellular Biochemistry. 2012;367(1-2):227–236. doi: 10.1007/s11010-012-1336-5. [DOI] [PubMed] [Google Scholar]
- 26.Nebreda A. R., Porras A. p38 MAP kinases: beyond the stress response. Trends in Biochemical Sciences. 2000;25(6):257–260. doi: 10.1016/s0968-0004(00)01595-4. [DOI] [PubMed] [Google Scholar]
- 27.Tournier C., Hess P., Yang D. D., et al. Requirement of JNK for stress-induced activation of the cytochrome c-mediated death pathway. Science. 2000;288(5467):870–874. doi: 10.1126/science.288.5467.870. [DOI] [PubMed] [Google Scholar]
- 28.Lui W.-Y., Wong C.-H., Mruk D. D., Cheng C. Y. TGF-β3 regulates the blood-testis barrier dynamics via the p38 mitogen activated protein (MAP) kinase pathway: an in vivo study. Endocrinology. 2003;144(4):1139–1142. doi: 10.1210/en.2002-0211. [DOI] [PubMed] [Google Scholar]
- 29.Xia W., Mruk D. D., Lee W. M., Cheng C. Y. Differential interactions between transforming growth factor-β3/ TβR1, TAB1, and CD2AP disrupt blood-testis barrier and Sertoli-germ cell adhesion. The Journal of Biological Chemistry. 2006;281(24):16799–16813. doi: 10.1074/jbc.m601618200. [DOI] [PubMed] [Google Scholar]
- 30.Singh A. K., Jiang Y., Gupta S. Effects of chronic alcohol drinking on receptor-binding, internalization, and degradation of human immunodeficiency virus 1 envelope protein gp120 in hepatocytes. Alcohol. 2007;41(8):591–606. doi: 10.1016/j.alcohol.2007.08.003. [DOI] [PubMed] [Google Scholar]
- 31.Schepers M. S. J., van Ballegooijen E. S., Bangma C. H., Verkoelen C. F. Oxalate is toxic to renal tubular cells only at supraphysiologic concentrations. Kidney International. 2005;68(4):1660–1669. doi: 10.1111/j.1523-1755.2005.00576.x. [DOI] [PubMed] [Google Scholar]
- 32.Khan S. R. Renal tubular damage/dysfunction: key to the formation of kidney stones. Urological Research. 2006;34(2):86–91. doi: 10.1007/s00240-005-0016-2. [DOI] [PubMed] [Google Scholar]
- 33.Khan S. R. Crystal/cell interaction and nephrolithiasis. Archivio Italiano di Urologia e Andrologia. 2011;83(1):1–5. [PubMed] [Google Scholar]
- 34.Khan S. R. Reactive oxygen species as the molecular modulators of calcium oxalate kidney stone formation: evidence from clinical and experimental investigations. The Journal of Urology. 2013;189(3):803–811. doi: 10.1016/j.juro.2012.05.078. [DOI] [PMC free article] [PubMed] [Google Scholar]
- 35.Fasano J. M., Khan S. R. Intratubular crystallization of calcium oxalate in the presence of membrane vesicles: an in vitro study. Kidney International. 2001;59(1):169–178. doi: 10.1046/j.1523-1755.2001.00477.x. [DOI] [PubMed] [Google Scholar]