Abstract
Objective:
To assess the relative cerebral blood volume (rCBV) and apparent diffusion coefficient (ADC) derived, respectively, from perfusion and diffusion pre-operative MRI of intracranial ependymomas and their predictive and prognostic values.
Methods:
Pre-operative MRI and clinical data for intracranial ependymomas diagnosed between January 2000 and December 2013 were retrospectively retrieved from a web-based national database. MRI data included diffusion (62 patients) and perfusion (20 patients) MRI. Patient age, histopathological diagnosis, tumour location, ADC, relative ADC (rADC) and rCBV were considered as potential factors in a survival analysis. Survival rates were estimated using the Kaplan–Meier method. Univariate analyses were performed using the log-rank test to compare groups. We also performed a multivariate analysis, applying the Cox proportional hazards model.
Results:
ADC and rADC values within hypointense regions differed significantly between grades II and III (p = 0.01). The 75th percentile of ADC within hypointense regions and the 25th percentile of rCBV within non-enhancing lesions were prognostic of disease-free survival (p = 0.004, p = 0.05). A significant correlation was found between the 75th percentile of rCBV and the 25th percentile of rADC (p = 0.01) in enhancing regions of grade-III tumours.
Conclusion:
Pre-operative rADC and rCBV could be used as prognostic factors for clinical outcome and to predict histological grade in paediatric ependymomas.
Advances in knowledge:
Prognostic value of diffusion and perfusion MRI in paediatric ependymoma was found and may play a role in the prognostic classification of patients in order to design more tailored treatment strategies.
INTRODUCTION
Ependymomas are the third most common brain tumours in children. 70% of them are infratentorial and 30% are supratentorial. The World Health Organization divides ependymomas into four types: subependymomas and myxopapillary ependymomas (grade I), ependymomas (grade II) and anaplastic ependymomas (grade III).
The first step in ependymoma treatment is a gross total resection. Chemotherapy may be used to delay radiation in infants and very young children.
Global overall survival rate is 50–80% at 5 years;1 therefore, in addition to the recent progresses in molecular analysis of tumours, a better knowledge of advanced imaging features of these tumours could be helpful in a diagnostic and therapeutic setting for improving surgery and radiotherapy.
MRI is the most important imaging modality used for the assessment of ependymomas.2,3 The MRI protocol includes sagittal and axial T1 weighted imaging (T1WI), axial T2, fluid-attenuated inversion recovery (FLAIR) and axial and coronal T1 post weighted imaging (WI). Axial diffusion WI (DWI) and perfusion WI (PWI) by dynamic susceptibility contrast (DSC) or arterial spin labelling, and proton MR spectroscopy are performed when the neoplastic nature of a lesion is uncertain. In T1WI, the solid portions are isointense to hypointense relative to the white matter (WM).4 Low-signal intensity relative to grey matter on T2 WI and FLAIR may represent calcifications or haemorrhage.2 Restricted diffusion may be seen especially in anaplastic tumours, and PWI usually shows elevated cerebral blood volume (CBV).2
DWI is a technique that provides information on tissue cellularity and local tissue architecture. Apparent diffusion coefficient (ADC) has been shown to be an important index of tumour grade and a prognostic factor for treatment outcome in brain tumours.5 The diffusivity of water molecules is restricted in environments of high cellularity (i.e. ADC values are lower in high-grade and more aggressive tumours).
Perfusion-weighted MRI is a bolus-tracking technique that provides insight into the underlying pathophysiology of cerebral microcirculation. The PWI signal is converted into a contrast medium concentration–time curve on a voxel-by-voxel basis. Parametric maps as CBV can be derived and used to extract information about the microvasculature and angiogenesis. Increased CBV should correlate with more aggressive tumours,6 allowing tumours to be graded prior to histopathology and guiding biopsy towards the most aggressive parts.
In this study, we investigated DWI and PWI parameter values within contrast-enhancing lesions (CELs) and non-enhancing lesions (NELs) in paediatric ependymomas. We undertook both a visual and a detailed quantitative analysis of parameters values. The objective was to assess whether these values can be used as prognostic factors for clinical outcome and to predict the histopathological grade.
METHODS AND MATERIALS
Patients and imaging
206 patients with diagnosed intracranial ependymomas between 2000 and 2013 were included in a large retrospective French study approved by the national French ethics committee and National Commission for Data Protection and Liberties. Inclusion criteria included the presence of histologically proven, localized, intracranial ependymoma, age at diagnosis ≤25 years, and adjuvant radiotherapy treatment.
We retrieved patients' clinical and imaging data and carefully reviewed all the pathological reports. Tumour grade was determined using the standard World Health Organization criteria; in case the presence or absence of anaplasia was not clearly stated, central review was performed. A total of 115 patients underwent MRI including T1, T1 post and T2/FLAIR. Of them, 62 patients underwent DWI, 20 underwent DSC-PWI and 19 underwent both. None of these patients had previously received radiation or chemotherapy. Tables 1 and 2 summarize the characteristics of the patients who underwent diffusion and/or perfusion MRI. MRI was performed on different scanners (GE, Philips, Siemens, 1.5 T or 3 T).
Table 1.
Characteristics of patients who underwent diffusion MRI
| Patient characteristics | Number of patients (n = 62) |
|---|---|
| Sex | |
| Male | 36 (58.1%) |
| Female | 26 (41.9%) |
| Age (years) | |
| Median | 3.5 (1.0–22.0) |
| Location | |
| Infratentorial | 41 (66.1%) |
| Supratentorial | 21 (33.9%) |
| Grade | |
| II | 18 (29.0%) |
| III | 44 (71.0%) |
| Tumour size | |
| Grade II | |
| Median (cm3) | 38.29 (1.6–173.4) |
| Grade III | |
| Median (cm3) | 57.374 (1.53–285.2) |
| Initial CE lesion volume | |
| Grade-II lesions with CE | 14 |
| Median (cm3) | 12.20 (0–31.67) |
| Grade-III lesions with CE | 42 |
| Median (cm3) | 14.91 (0–71.45) |
| Initial NE lesion volume | |
| Grade-II lesions with NE | 17 |
| Median (cm3) | 20.83 (0–141.72) |
| Grade-III lesions with NE | 44 |
| Median (cm3) | 38.38 (3.83–262.53) |
| Extent of resection | |
| Gross Total Resection | 51 (82.3%) |
| Sub Total Resection | 11 (17.7%) |
| Chemotherapy | |
| Yes | 16 (25%) |
| No | 46 (74%) |
| Dose (Gy) | 59.4 (50.4–59.4) |
| Number of treatment centres | 12 |
CE, contrast-enhancing; NE, non-enhancing.
Table 2.
Characteristics of patients who underwent perfusion MRI
| Patient characteristics | Number of patients (n = 20) |
|---|---|
| Sex | |
| Male | 10 (50.00%) |
| Female | 10 (50.00%) |
| Age (years) | |
| Median | 4.0 (1.0–17.0) |
| Location | |
| Infratentorial | 13 (65.0%) |
| Supratentorial | 7 (35.0%) |
| Grade | |
| II | 4 (20.0%) |
| III | 16 (80.0%) |
| Tumour size | |
| Grade II | |
| Median (cm3) | 44.45 (36.15–173.39) |
| Grade III | |
| Median (cm3) | 53.962 (14.03–978.95) |
| Initial CE lesion volume | |
| Grade-II lesions with CE | 3 |
| Median (cm3) | 12.06 (0–31.67) |
| Grade-III lesions with CE | 15 |
| Median (cm3) | 12.97 (0–65.53) |
| Initial NE lesion volume | |
| Grade-II lesions with NE | 4 |
| Median (cm3) | 34.57 (31.79–141.72) |
| Grade-III lesions with NE | 16 |
| Median (cm3) | 35.99 (6.49–74.48) |
| Extent of resection | |
| GTR | 15 (75%) |
| STR | 5 (25%) |
| Chemotherapy | |
| Yes | 3 (%) |
| No | 17 (%) |
| Dose (Gy) | 59.4 (50.4–59.4) |
| Number of treatment centres | 7 |
CE, contrast-enhancing; NE, non-enhancing.
Data processing
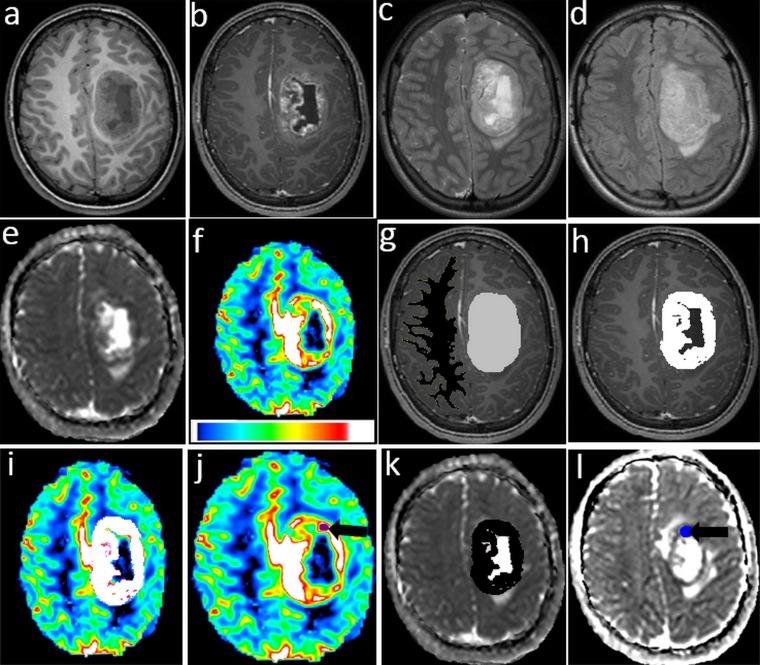
Three-dimensional regions of interest (3D ROIs) corresponding to the entire tumour (ET), CEL and NEL regions were delineated by an experienced radiation oncologist (AD) and double-checked by a neuroradiologist (AS). Pseudocystic regions were excluded from the CEL and NEL. 3–5 regions of interest (ROIs; 40–50 mm2) were also drawn within hypointense-appearing regions on the ADC map and hyperintense-appearing regions on the relative CBV (rCBV) map. Hypointense-appearing regions on the ADC map were defined by regions of signal hyperintensity on diffusion-weighted MRI corresponding to those of signal hypointensity on the ADC map. 3D ROIs, as large as possible, were drawn within supratentorial normal-appearing WM (NAWM) in the contralateral hemisphere on the T1 post WI (Figure 1).
Figure 1.
(a) Pre-gadolinium axial T1 weighted imaging (T1WI), (b) post-gadolinium axial T1WI, (c) Axial T2 weighted imaging, (d) axial fluid-attenuated inversion recovery images, (e) apparent diffusion coefficient (ADC) map, (f) relative cerebral blood volume (rCBV) map, (g) three-dimensional region of interest (3D ROI) of tumour in light grey colour and three-dimensional contralateral region of interest (ROI) in black colour, (h) 3D ROI of contrast enhancement lesion (CEL) component in white colour, (i) 3D ROI CEL mapped to rCBV map in white colour, (j) ROI in hyperintense region on rCBV map (black arrow), (k) CEL mapped to ADC map in black colour and (l) ROI in hypointense regions on ADC map (black arrow).
CBV maps were generated from PWI using Olea Sphere® v. 2.3 software (Olea Medical, La Ciotat, France) with an oscillation-index singular value decomposition routine and T1 weighted leakage effects correction.7,8 The ADC maps were calculated from the DWI data on a voxel-by-voxel basis using the same software.
All the imaging data (T2/FLAIR, ADC and CBV) were rigidly co-registered to the T1 post WI using mutual information as an objective function and simplex as an optimizer.9 All automatic co-registrations were visually verified and validated.
The co-registration and ROI delineation were performed using Sisyphe (Toulouse, France), an inhouse neuroimaging software toolbox.
Parametric maps, together with the corresponding T1 and T2/FLAIR resampled images, were entered into Sisyphe and the ROIs were superimposed on them (Figure 1). Visual corrections were made to the original ROIs to compensate for any image distortion and to eliminate regions that included visible macroscopic blood vessels. The mean, median, 25th and 75th percentiles of the signal intensities of ADC, rCBV from within the ET, CEL, NEL and NAWM were recorded for subsequent analysis. The rCBV and rADC values for tumour ROIs were obtained by dividing the signal intensity values by the CBV and ADC signal intensities obtained from NAWM ROIs.
Statistical analysis
Data were summarized by frequency and percentage for categorical variables and by median and range or mean and standard deviation for continuous variables. Differences between groups were assessed using the Kruskal–Wallis test for continuous variables, the χ2 test or Fisher's exact test for qualitative variables and the Wilcoxon test for paired quantitative data. Correlations between continuous variables were assessed using Spearman's rank correlation coefficient.
A receiver operating characteristic curve analysis was performed to establish cut-off values for some continuous parameters to discriminate between grades. An optimum threshold value was defined to maximize the Youden's index. Internal validation was performed using a bootstrap resampling method.
The end point of the study was disease-free survival (DFS). All survival times were calculated from the date of the initial radiotherapy. DFS was estimated by the Kaplan–Meier method with a 95% confidence interval and using the following first event definition: any relapse or death. Living patients without relapse were censored at the date of their last follow-up. Univariate analysis was used to identify prognostic factors for DFS. The log-rank test was used for categorical variables, and the Cox proportional hazards model was used for continuous ones. We looked for an optimum cut-off using the minimum p-value approach with bootstrap internal validation for some continuous DSC and DWI parameters. To identify variables significantly associated with outcome, a multivariate analyses using the Cox proportional hazards model for DFS and logistic regression for grade were performed. Owing to the exploratory nature of the analysis, no adjustment for multiple testing was used.
All reported p-values were two-sided. For all statistical tests, differences were deemed to be significant at p ≤ 0.05. Statistical analysis was performed using Stata® v. 13 software (StataCorp, College Station, TX).
RESULTS
Perfusion-weighted imaging
Visual and quantitative analyses
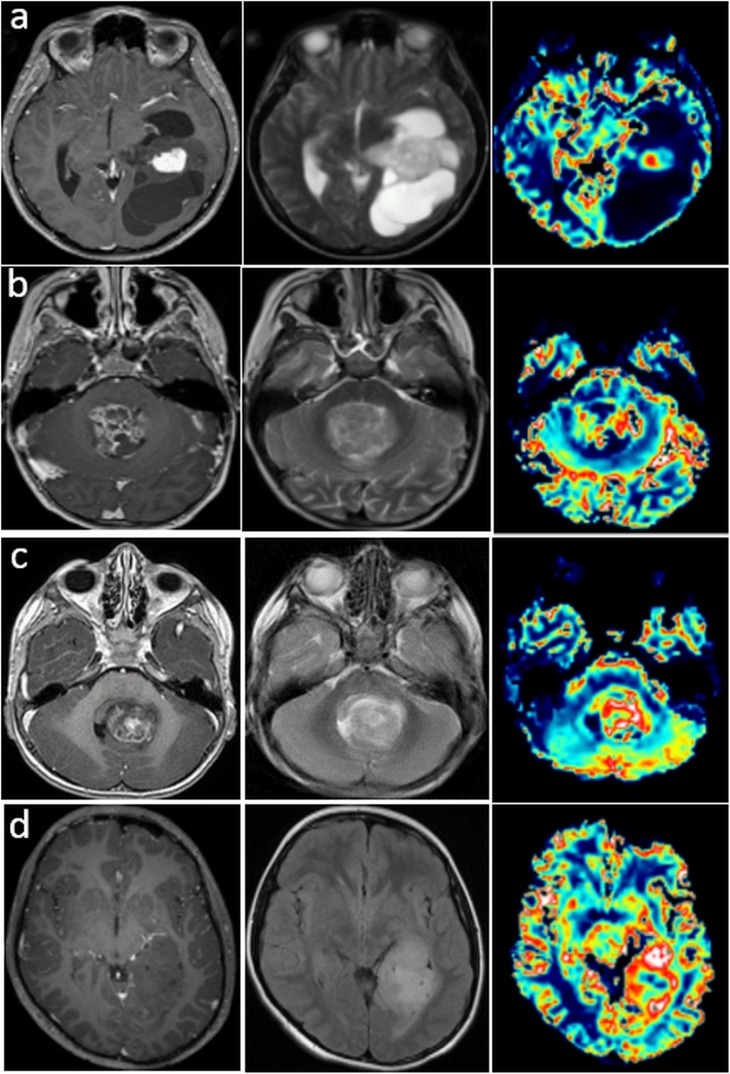
We analyzed CEL and NEL volumes according to grade. Although there was considerable variability in volumes between patients within each grade, there was a trend towards greater CEL and an increase in NEL volume for grade III. Differences in the visual appearance of anatomical lesions are provided in Figure 2.
Figure 2.
Post-contrast T1 weighted imaging (PC T1WI), T2 weighted imaging (T2WI) and relative cerebral blood volume (rCBV) maps for two patients with grade-II ependymomas in a supra- (a) or infratentorial (b) location. Note the high rCBV in enhanced regions of the lesions and the low rCBV in the cystic regions. PC T1WI, T2WI and rCBV maps for a patient (c) with an enhancing grade-III ependymoma, and a patient (d) with a non-enhancing grade-III ependymoma. Note the heterogeneous high rCBV in the region corresponding to the anatomical lesion.
Mean rCBV values were elevated in both grades II and III: 1.43 ± 0.52 for grade II and 1.11 ± 0.45 for grade III in the CEL regions, and 1.08 ± 0.30 for grade II and 1.03 ± 0.52 for grade III in the NEL regions. As there were 18 grade-III patients and 2 grade-II patients, the difference between grades II and III was not statistically investigated. We then focused in grade-III tumours: mean rCBV (p = 0.015) and median rCBV (p = 0.027) were significantly different in the NEL and CEL regions.
Survival analysis
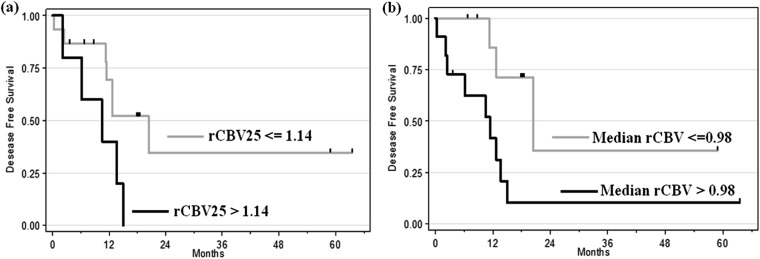
By the end of this study, of the 20 patients who had undergone PWI, 12 (60%) patients relapsed and 16 (80%) are still alive, with a median follow-up of 24.2 months (95% CI 17.0, 32.7). The univariate survival analysis showed that median rCBV in ET had a significant impact on DFS (p = 0.048; hazard ratio = 2.87; 95% CI 1.01, 8.20) and the 25th percentile of rCBV in NEL tended toward being a prognostic factor (p = 0.076; hazard ratio = 2.44; 95% CI 0.91–6.51). Two cut-offs were identified for these two parameters using the minimum p-value approach: 0.98 (95% CI 0.76, 1.65) for median rCBV in ET and 1.14 for the 25th percentile of rCBV in NEL.
Patients with a median rCBV <0.98 in ET had a median DFS of 20.4 months, whereas patients with an rCBV >0.98 had a median DFS of 11.4 months, irrespective of the histopathological grade (p = 0.02; Figure 3).
Figure 3.
Kaplan–Meier curve for disease-free survival. (a) Difference between low 25th percentile of relative cerebral blood volume (rCBV) in non-enhancing lesion (≤1.14 vs >1.14; p = 0.05). (b) Significant difference for median rCBV in the entire tumour (≤0.98 vs >0.98; p = 0.02).
Patients with a 25th percentile of rCBV <1.14 in NEL had a median DFS of 20.4 months, whereas patients with an rCBV >1.14 had a median DFS of 10.5 months, irrespective of the histopathological grade (p = 0.05, Figure 3).
The small size of the cohort prevented us from conducting multivariate analysis.
Diffusion-weighted imaging
Visual and quantitative analyses
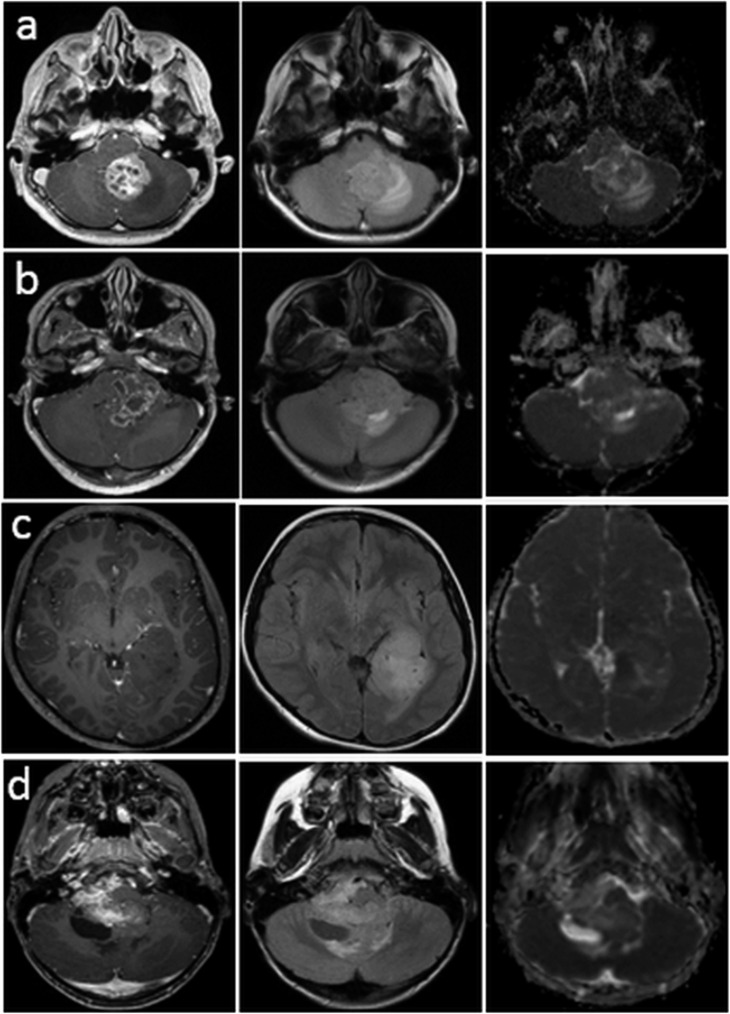
Figure 4a shows two patients with grade-II ependymomas. The first is heterogeneously hyperintense on the T1WI and hyperintense in the oedema component on the FLAIR images, and is hypointense in the rest of the tumour. The second (Figure 4b) is hypointense on the T1WI and hypointense on the FLAIR and ADC images. Figure 4c,d shows similar heterogeneity in CEL and NEL patterns, which are heterogeneous for grade III, where ADC appears to be elevated in regions within and/or outside the enhancement.
Figure 4.
Post-contrast T1 weighted imaging (PC T1WI), fluid-attenuated inversion recovery (FLAIR) and apparent diffusion coefficient (ADC) maps for two patients with grade-II ependymomas. ADC intensity is elevated relative to normal brain tissue in the contrast-enhanced lesional regions for the first one (a) and low in the second one (b). PC T1WI, FLAIR and ADC maps for a patient (c) with a non-enhancing lesion (grade III) and a patient (d) with an enhancing lesion (grade III). The ADC is elevated relative to normal brain tissue in the contrast-enhanced lesional regions in the second patient.
Mean ADC values were 1140.26 ± 292.9 µm2 s−1 for grade II (n = 18) and 1018.65 ± 279.78 µm2 s−1 for grade III ( n = 44 ) in the CEL regions, and 1221 ± 337.66 µm2 s−1 for grade II and 1636.47 ± 234.63 µm2 s−1 for grade III in the NEL regions. They were significantly different for both CEL and NEL vs NAWM (ps < 0.001). The ADC restriction was more important in grade-III patients, indeed, the 75th percentile of ADC and rADC within the hypointense regions were lower in the grade-III group than in the grade-II group (median ADC = 675 vs 791.0 µm2 s−1, p = 0.01) with an area under the curve of 0.70 (95% CI 0.557, 0.840) and (median rADC = 0.873 vs 0.914, p = 0.06) with an area under the curve of 0.66 (95% CI 0.502, 0.808).
Receiver operating characteristic analysis for the 75th percentile of rADC in hypointense regions yielded a cut-off value of 1 [95% CI (0.68, 1.17)]. This parameter was predictive grade III with a sensitivity of 90.9% and a specificity of 38.9%. The positive-predictive value was 78.4% and the negative-predictive value 63.6%. A multivariate analysis including this cut-off value, age and location of tumour showed that only the 75th percentile of rADC was significant [p = 0.01, 95% CI (1.34, 23.54)].
Survival analysis
By the end of this study, of the 62 patients who had undergone DWI, 23 (37.1%) of them had relapsed and 54 (87.1%) are still alive and, with a median follow-up of 22.1 months [95% CI (18.2, 30.5)].
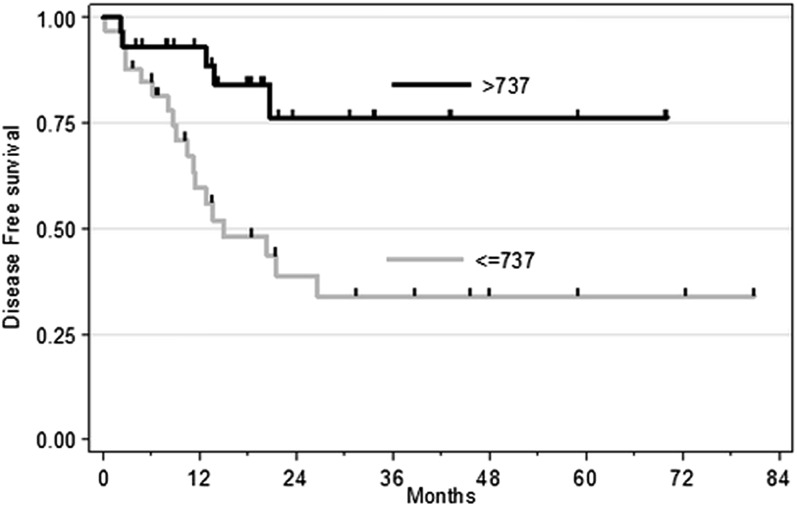
The minimum p-value approach identified a cut-off value of 737 µm2 S−1 [95% CI (470, 852)] for the 75th percentile of ADC in hypointense regions. The results of the univariate analysis including the 75th percentile of ADC in hypointense regions dichotomized at this threshold are summarized in Figure 5. They showed that tumour grade (p = 0.007) and the 75th percentile of ADC in hypointense regions (p = 0.004) had a significant prognostic impact on DFS and were still statistically significant in the multivariate analysis (p = 0.043 and p = 0.042, respectively).
Figure 5.
Kaplan–Meier curves for disease-free survival according to hypointense apparent diffusion coefficient (75th percentile) groups (≤737 × 10−6 vs >737 × 10−6 mm2 s−1; p = 0.004).
Correlations between perfusion and diffusion MR parameters in patients
Analysis of the 16 patients with grade-III ependymomas for whom both perfusion and diffusion MRI data were available showed that there was a negative correlation between the 25th percentile of rADC and the 75th percentile of rCBV in CEL (r = −0.64, p = 0.01).
DISCUSSION
To our knowledge, the present study involved the collection and analysis of the largest functional imaging series of paediatric ependymomas so far, as 62 of the patients underwent DWI, 20 underwent PWI and 19 underwent both.
We found that grade-II lesions had different, less diffuse regions of enhancement than grade-III lesions, which can be very heterogeneous and tended to have much larger NEL and CEL volumes. Oedema was more frequent in supratentorial vs infratentorial ependymomas while another feature of the supratentorial tumours was a higher frequency of large, clearly identifiable cystic regions within the lesions.
Our results for rCBV showed highly variable microvasculature in grade III. Few studies have reported rCBV values10 for ependymomas and comparison is not easy owing to their small sample sizes. However, grade-III ependymomas are reported to be characterized by hypercellularity and endothelial proliferation,11 which should result in increased rCBV. One study11 reported that ependymomas have variable regional rCBV values but did not provide any quantitative data.
Several studies have suggested a threshold for rCBV that could help to establish the histopathological grade of adult gliomas and predict outcome,6,12 but to date, no studies have been published on ependymomas. In the present study, the low number of grade-II patients compared with grade-III patients prevented us from investigating the difference between these grades, therefore we ran separate analyses of the differences between CEL and NEL. These revealed evidence for increased rCBV in CEL regions for both grade-II and grade-III lesions. Although the rCBV values were higher for CEL than for NEL, they were very variable and did not differ significantly from NAWM. Nevertheless, the median rCBV values in ET and the 25th percentile of the rCBV value in NEL were shown to be prognostic factors for DFS in grade III in the univariate analysis.
ADC values in this study were consistent with values reported in previous studies.13,14,15,16 Several of these studies used DWI to distinguish between different types of paediatric posterior fossa tumours, but there were many limitations14–18. To our knowledge, the present study is the first to have specifically sought to grade ependymomas in children.
Our results suggest that ADC values could be used to distinguish tumours from normal tissue and, moreover, to predict their histopathological grade. The 75th percentile of rADC within the hypointense regions was a significant parameter in stratifying grades II and III, but was not found to be a prognostic factor in the multivariate survival analysis. We found that the 75th percentile of ADC for hypointense regions could be used as a prognostic factor for clinical outcome. ADC values decrease when cellularity increases, indicating that the tumour is more aggressive and resistant to treatment, and that the survival outcome will therefore be poor. Our results support the findings of other studies that have shown that ADC values for paediatric brain tumours are inversely correlated with tumour cellularity.19 The correlation of ADC with survival has also been reported for some types of adult tumours.5
Finally, we found a correlation between the 25th percentile of rADC and the 75th percentile of rCBV within CEL in grade-III ependymomas. Analysis of correlations between parameters for grade III suggested that high vascularity (high rCBV) was correlated with increased cellularity (low rADC) in these lesions.
The main limitation of the present study was its retrospective design and more specifically the heterogeneity of MRI parameters according to treatment centre. Gathering data from multiple centres provides a means of increasing patient numbers and the amount of available data and ensures a sufficiently powered analysis. However, data obtained from different scanners with different acquisition parameters and field strengths can be a source of limitation in retrospective or longitudinal studies.20 We tried to minimize the effect on results by normalizing the values of ADC and CBV to the values for the contralateral regions. All our significant results on survival and grading were correlated with rADC and rCBV, except for one survival result linked to an absolute value of ADC that should be viewed with caution. Although MRI data may be predictive of tumour grade, histological diagnosis is still required; therefore, these findings do not make changes in the clinical work-up, but our study brings additional information on advanced MRI, with a large series of patients for diffusion and perfusion MRI, as there is a lack of data published in this kind of tumour.
In the present study, we chose to use rigid, rather than non-rigid, registration. However, we checked each time whether the registration was correct, to avoid errors in values.
Our study had several strengths. First, the inclusion of a large number of patients allowed for a more reliable statistical analysis than in the few studies that had previously characterized diffusion and perfusion in paediatric ependymoma, which relied on small sample sizes. Second, the study was performed on pre-operative data, and there was therefore no influence of surgery or therapy on the perfusion and diffusion values. Third, the DSC data were post-processed using a semi-adaptive deconvolution method (oscillation-index singular value decomposition). This enabled correction for bolus dispersion effects and for leakage with K2 maps, which give accurate estimates of blood volume. Finally, the extraction of several parameters from different 3D ROIs rather than two-dimensional ROIs, allowed for greater exploration of the tumour components, and this is as a robust method which takes into account all the tumour volume combining visual analysis and quantification.
CONCLUSION
The value of rCBV and ADC in paediatric ependymomas may be prognostic factors for clinical outcome and rADC provided information that could be related to histopathology. Because of their prognostic value, imaging parameters could, in the future, play a role in the prognostic classification of patients in order to design more tailored treatment strategies.
Our results pave the way to the use of diffusion and perfusion MRI in the diagnosis and monitoring of ependymomas. The inclusion of this type of imaging in prospective clinical studies is therefore of the utmost importance.
FUNDING
This study was supported by a grant from the Rotary Foundation.
Contributor Information
Fatima Tensaouti, Email: tensaouti.f@chu-toulouse.fr.
Anne Ducassou, Email: Ducassou.Anne@iuct-oncopole.fr.
Léonor Chaltiel, Email: Chaltiel.Leonor@iuct-oncopole.fr.
Annick Sevely, Email: sevely.a@chu-toulouse.fr.
Stéphanie Bolle, Email: Stephanie.BOLLE@gustaveroussy.fr.
Xavier Muracciole, Email: Xavier.MURACCIOLE@ap-hm.fr.
Claire Alapetite, Email: claire.alapetite@curie.fr.
Stéphane Supiot, Email: Stephane.Supiot@ico.unicancer.fr.
Aymeri Huchet, Email: aymeri.huchet@chu-bordeaux.fr.
Valérie Bernier, Email: v.bernier@nancy.unicancer.fr.
Line Claude, Email: line.claude@lyon.unicancer.fr.
Anne-Isabelle Bertozzi-Salamon, Email: bertozzi.ai@chu-toulouse.fr.
Samuel Liceaga, Email: samuel.liceaga@gmail.com.
Jean Albert Lotterie, Email: lotterie.ja@chu-toulouse.fr.
Patrice Péran, Email: patrice.peran@inserm.fr.
Pierre Payoux, Email: payoux.p@chu-toulouse.fr.
Anne Laprie, Email: laprie.anne@iuct-oncopole.fr.
REFERENCES
- 1.Mizumoto M, Oshiro Y, Takizawa D, Fukushima T, Fukushima H, Yamamoto T, et al. Proton beam therapy for pediatric ependymoma. Pediatr Int 2015; 57: 567–71. doi: 10.1111/ped.12624 [DOI] [PubMed] [Google Scholar]
- 2.Yuh EL, Barkovich AJ, Gupta N. Imaging of ependymomas: MRI and CT. Childs Nerv Syst 2009; 25: 1203–13. doi: 10.1007/s00381-009-0878-7 [DOI] [PMC free article] [PubMed] [Google Scholar]
- 3.Brody AS, Frush DP, Huda W, Brent RL; American Academy of Pediatrics Section on Radiology. Radiation risk to children from computed tomography. Pediatrics 2007; 120: 677–82. doi: 10.1542/peds.2007-1910 [DOI] [PubMed] [Google Scholar]
- 4.Smith AB, Smirniotopoulos JG, Horkanyne-Szakaly I. From the radiologic pathology archives: intraventricular neoplasms: radiologic-pathologic correlation. Radiographics 2013; 33: 21–43. doi: 10.1148/rg.331125192 [DOI] [PubMed] [Google Scholar]
- 5.Murakami R, Sugahara T, Nakamura H, Hirai T, Kitajima M, Hayashida Y, et al. Malignant supratentorial astrocytoma treated with postoperative radiation therapy: prognostic value of pretreatment quantitative diffusion-weighted MR imaging. Radiology 2007; 243: 493–9. doi: 10.1148/radiol.2432060450 [DOI] [PubMed] [Google Scholar]
- 6.Law M, Young RJ, Babb JS, Peccerelli N, Chheang S, Gruber ML, et al. Gliomas: predicting time to progression or survival with cerebral blood volume measurements at dynamic susceptibility-weighted contrast-enhanced perfusion MR imaging. Radiology 2008; 247: 490–8. doi: 10.1148/radiol.2472070898 [DOI] [PMC free article] [PubMed] [Google Scholar]
- 7.Wu O, Østergaard L, Weisskoff RM, Benner T, Rosen BR, Sorensen AG. Tracer arrival timing-insensitive technique for estimating flow in MR perfusion-weighted imaging using singular value decomposition with a block-circulant deconvolution matrix. Magn Reson Med 2003; 50: 164–74. doi: 10.1002/mrm.10522 [DOI] [PubMed] [Google Scholar]
- 8.Mouridsen K, Christensen S, Gyldensted L, Østergaard L. Automatic selection of arterial input function using cluster analysis. Magn Reson Med 2006; 55: 524–31. doi: 10.1002/mrm.20759 [DOI] [PubMed] [Google Scholar]
- 9.Meyer CR, Boes JL, Kim B, Bland PH, Zasadny KR, Kison PV, et al. Demonstration of accuracy and clinical versatility of mutual information for automatic multimodality image fusion using affine and thin-plate spline warped geometric deformations. Med Image Anal 1997; 1: 195–206. doi: 10.1016/S1361-8415(97)85010-4 [DOI] [PubMed] [Google Scholar]
- 10.Holveck A, Grand S, Boini S, Kirchin M, Le Bas JF, Dietemann JL, et al. Dynamic susceptibility contrast-enhanced MRI evaluation of cerebral intraventricular tumors: preliminary results. J Neuroradiol 2010; 37: 269–75. doi: 10.1016/j.neurad.2009.11.001 [DOI] [PubMed] [Google Scholar]
- 11.Panigrahy A, Blüml S. Neuroimaging of pediatric brain tumors: from basic to advanced magnetic resonance imaging (MRI). J Child Neurol 2009; 24: 1343–65. doi: 10.1177/0883073809342129 [DOI] [PubMed] [Google Scholar]
- 12.Çoban G, Mohan S, Kural F, Wang S, O'Rourke DM, Poptani H. Prognostic value of dynamic susceptibility contrast-enhanced and diffusion-weighted MR imaging in patients with glioblastomas. AJNR Am J Neuroradiol 2015; 36: 1247–52. doi: 10.3174/ajnr.A4284 [DOI] [PMC free article] [PubMed] [Google Scholar]
- 13.Maier SE, Sun Y, Mulkern RV. Diffusion imaging of brain tumors. NMR Biomed 2010; 23: 849–64. doi: 10.1002/nbm.1544 [DOI] [PMC free article] [PubMed] [Google Scholar]
- 14.Gimi B, Cederberg K, Derinkuyu B, Gargan L, Koral KM, Bowers DC, et al. Utility of apparent diffusion coefficient ratios in distinguishing common pediatric cerebellar tumors. Acad Radiol 2012; 19: 794–800. doi: 10.1016/j.acra.2012.03.004 [DOI] [PubMed] [Google Scholar]
- 15.Kan P, Liu JK, Hedlund G, Brockmeyer DL, Walker ML, Kestle JRW. The role of diffusion-weighted magnetic resonance imaging in pediatric brain tumors. Childs Nerv Syst 2006; 22(11): 1435–9. doi: 10.1007/s00381-006-0229-x [DOI] [PubMed] [Google Scholar]
- 16.Rumboldt Z, Camacho DLA, Lake D, Welsh CT, Castillo M. Apparent diffusion coefficients for differentiation of cerebellar tumors in children. Am J Neuroradiol 2006; 27(6): 1362–9. doi: 10.1016/S0513-5117(08)70144-3 [DOI] [PMC free article] [PubMed] [Google Scholar]
- 17.Gutierrez DR, Awwad A, Meijer L, et al. Metrics and textural features of MRI diffusion to improve classification of pediatric posterior fossa tumors. Am J Neuroradiol 2014; 35(5): 1009–15. doi: 10.3174/ajnr.A3784 [DOI] [PMC free article] [PubMed] [Google Scholar]
- 18.Jaremko JL, Jans LBO, Coleman LT, Ditchfield MR. Value and limitations of Diffusion-Weighted Imaging in Grading and Diagnosis of Pediatric Posterior Fossa Tumors. Am J Neuroradiol 2010; 31(9): 1613–6. doi: 10.3174/ajnr.A2155 [DOI] [PMC free article] [PubMed] [Google Scholar]
- 19.Gauvain KM, McKinstry RC, Mukherjee P, et al. Evaluating pediatric brain tumor cellularity with diffusion-tensor imaging. Am J Roentgenol 2001; 177(2): 449–54. doi: 10.2214/ajr.177.2.1770449 [DOI] [PubMed] [Google Scholar]
- 20.Sasaki M, Yamada K, Watanabe Y, et al. Variability in absolute apparent diffusion coefficient values across different platforms may be substantial: a multivendor, multi-institutional comparison study. Radiology 2008; 249(2): 624–30. doi: 10.1148/radiol.2492071681 [DOI] [PubMed] [Google Scholar]


