Abstract
Objective:
To evaluate the correlation between apparent diffusion coefficient (ADC) values and histopathological features in a cohort of patients with suspected malignant pleural disease.
Methods:
We evaluated 56 consecutive patients undergoing a chest MRI examination for clinical suspicion of malignant pleural disease; all patients underwent thoracoscopic biopsy for histological assessment. All MRI examinations were performed with a 1.5-T scanner using a dedicated protocol, including a respiratory-triggered diffusion-weighted sequence with three b-values (0, 100 and 750). The ADC values were calculated, and a statistical analysis was performed.
Results:
The average ADC value in non-neoplastic pleural disease (NNPD) resulted in 1.84 ± 0.37 × 10⁻³ mm2 s−1, whereas we obtained an average value of 0.96 ± 0.19 × 10⁻³ mm2 s−1 in epitheliod, of 0.76 ± 0.33 × 10⁻³ mm2 s−1 in biphasic and of 0.67 ± 0.2 × 10⁻³ mm2 s−1 in sarcomatoid pleural mesotheliomas. Histology revealed the presence of malignant pleural mesothelioma (MPM) in 44 patients, chronic pleuritis in 8 patients and atypical mesothelial hyperplasia in 4 patients. Statistical analysis showed a significant difference between NNPD and MPM (p < 0.001) and between epithelioid and sarcomatoid MPM subtypes (p = 0.0004), whereas biphasic MPMs showed a wide range of overlapping with the other groups.
Conclusion:
We observed a statistically significant difference between NNPD, epitheliod and sarcomatoid subtypes of MPM regarding ADC values.
Advances in knowledge:
Our study confirmed previous data regarding distribution of ADC values in pleural disease using a respiratory-triggered diffusion-weighted technique that allowed us to minimize motion artefacts and to reduct acquisition time.
INTRODUCTION
Primary malignant pleural mesothelioma (MPM) accounts for only 10% of pleural malignancies, whereas in 90% of cases, malignant pleural tumours represent a secondary involvement caused by metastatic disease or lymphoma.1 MPM is characterized by a very poor prognosis, with a survival rate after diagnosis ranging between 4 and 18 months.2 Imaging plays a central role in diagnosis and staging of MPM, nevertheless the characterization of pleural lesions still represents a challenge for radiologists. The first-line examinations for detection of MPMs are represented by CT and imaging-guided biopsy, but recently, other imaging modalities such as MRI and whole-body positron emission tomography (PET)/CT with fluorine-18 fludeoxyglucose (18F-FDG) have achieved a high grade of accuracy in staging and in characterization of the disease, providing important information about the extension and the margins of these lesions.3 CT is widely used as the primary imaging modality for the diagnosis, staging and monitoring of therapeutic response in MPM. Typical findings include circumferential pleural thickening with multiple nodules, pleural effusion, involvement of the interlobar fissures, volume reduction of the chest with mediastinal shift and invasion of surrounding structures.4,5 However, CT tends to underestimate early chest invasion, direct mediastinal invasion and peritoneal involvement and has well-known limitations in the evaluation of lymph node metastases.4 18F-FDG PET/CT is currently considered the gold standard imaging technique for staging of MPM, combining anatomical and metabolic information, with reported sensitivity, specificity and accuracy in stage IV disease of 67%, 93% and 83%, respectively;6 however, PET/CT is not fully tumour specific because it is not particularly accurate in the recognition of lymph nodal MPM metastasis and 18F-FDG uptake can occur in inflammatory lesions too, making evaluation of MPM challenging. To achieve more accurate diagnostic and staging strategies, MRI is recently reaching an important role in diagnosis of MPM, especially by means of diffusion-weighted imaging (DWI) and dynamic contrast-enhanced (DCE) sequences; MRI provides additional functional information.7 Little attention has been paid in literature on the use of diffusion-weighted MRI in pleural disease, although it was recently been suggested that DWI sequences could help in the differential diagnosis of epithelioid MPM and sarcomatoid MPM.8 Currently, the role of DWI in the management of patients with MPM is still under investigation, and a recent article by Coolen et al9 showed the possibility to obtain a visual assessment by using pleural pointillism at DWI, lending an even more innovative dimension to MR evaluation of MPM. The purpose of our study was to investigate the correlation between apparent diffusion coefficient (ADC) values and histopathological features in a cohort of patients with suspected malignant pleural disease.
METHODS AND MATERIALS
Inclusion of patients
Between May 2011 and January 2016, we retrospectively included 56 consecutive patients (mean age 69.4 ± 8.3 years; age range 45–83 years, 4 females and 52 males) with clinical suspicion of malignant pleural disease due to positive plain film radiographies, contrast-enhanced CT examinations or serum/pleural effusion biomarkers. All patients underwent thoracic MRI examination and histological assessment leading to histological diagnosis. However, because this was a retrospective study and we regularly use MRI in the evaluation of patients with suspected malignant pleural disease, it was granted an exemption by the local ethics committee.
Chest MRI protocol
All MRI examinations were performed with a 1.5-T whole-body system (Achieva®; Philips Healthcare, Best, Netherlands) with the manufacturer's 16-channel phased-array torso coil (Sense XL Torso; Philips Healthcare) for signal reception. The MRI protocol consisted of precontrast multiplanar fast field echo (FFE) T1 weighted, turbo spin echo single shot T2 weighted and sensitivity encoding balanced turbo field echo two-dimensional sequences, an axial DWI sequence, followed by multiplanar FFE three-dimensional T1 weighted sequences with fat suppression (THRIVE) acquired before and after injection of Gd-BOPTA (MultiHance®; Bracco, San Donato Milanese, Italy). Specific protocol parameters are summarized in Table 1. DWI was performed using a respiratory triggering technique with individualized scan time, tailored on single patient's respiratory pattern to reduce scan duration and motion artefacts of the thoracic wall and to optimize the signal-to-noise ratio (SNR) and contrast-to-noise ratio of ADC map. Regarding the dynamic THRIVE sequence, images were acquired before and after the injection of Gd-BOPTA at 0, 30, 90 and 180 s on the axial plane.
Table 1.
MRI protocol for the evaluation of pleural disease
| Sequence | Acquisition time (min) | Number of slices | FOV (RL × AP × CC) | Slice thickness (mm)/intersection gap (mm) | Matrix | TR (ms) | TE (ms) | FA | b-values (s mm−2) |
|---|---|---|---|---|---|---|---|---|---|
| FFE T1 | 0 : 34 (2 BH) | 52 | 370 × 276 × 311 | 5/0.5 | 252 × 149 | shortest | 4.6 | 80° | – |
| TSE T2 | 0 : 18 | 52 | 370 × 276 × 311 | 5/0.5 | 252 × 150 | 345 | 80 | – | – |
| BTFE 2D | 0 : 17 | 40 | 370 × 276 × 311 | 6/0.6 | 256 × 204 | shortest | shortest | – | – |
| THRIVE | 3 : 22 | Variable | 370 × 276 × 311 | 2 × 2 × 2.5a | 184 × 136 | shortest | 65 | 10° | – |
| DWIb (4 scan time/resp) | 1 : 45 | 43 | 370 × 275 × 300 | 6/0.6 | 124 × 90 | 4159 | 65 | – | 0, 100, 750 |
| DWIb (2 scan time/resp) | 2 : 06 | ||||||||
| DWIb (1 scan time/resp) | 3 : 09 |
2D, two-dimensional; AP, anteroposterior; BH, breath-hold; BTFE, balanced turbo field echo; CC, craniocaudal; DWI, diffusion-weighted imaging; FA, flip angle; FFE, fast field echo; FOV, field of view; resp, respiratory pattern; RL, right–left; T1, T1 weighted; T2, T2 weighted; TE, echo time; TR, repetition time; TSE, turbo spin echo.
Voxel size (AP × RL × FH).
Only one of the DWI sequences was performed depending on the respiratory pattern of the patient.
Image analysis
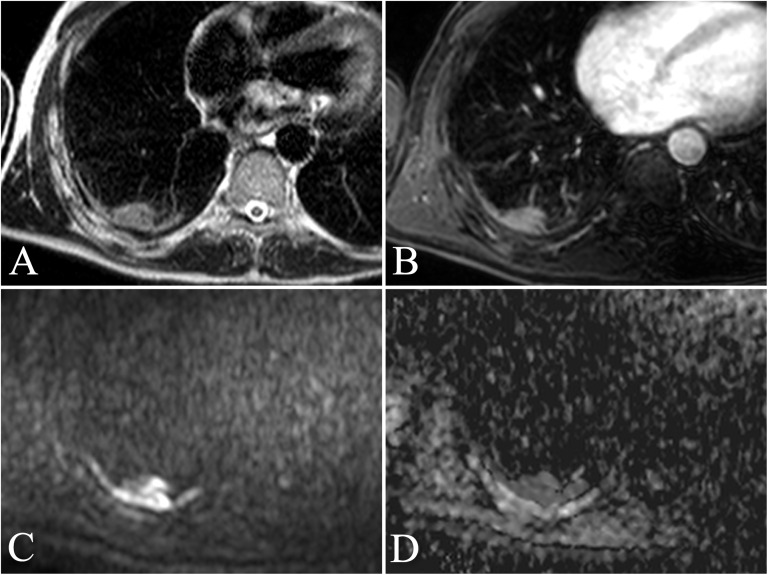
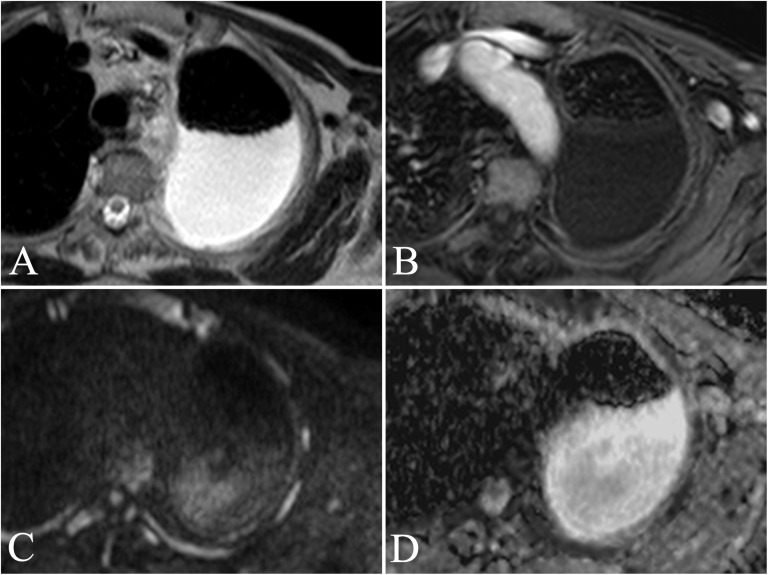
MRI examination was evaluated in consensus by two expert thoracic radiologists (AV, 10 years of MR experience and FC, 12 years of MR experience), blinded to all information regarding imaging results from other modalities and to histological results. DW images were evaluated by drawing freehand regions of interest in lesions on the images acquired by using a b-value of 750 s mm−2, and the ADC was then calculated considering the averaged signal intensities of the other b-values. When measuring pleural thickness at particularly thin interfaces (i.e. in chronic pleuritis or atypical mesothelial hyperplasia), the region of maximum thickness was identified on the morphological sequences and a correlation point on the ADC MAP was then located to avoid biases in the assessment of the ADC value (Figure 1). The ADC measurement in patients without nodular thickening was performed on the parietal side of the pleura not nearby a loculated effusion to avoid the corpuscolated part affecting the measurement (Figure 2). All MR calculations were performed using a dedicated software (IntelliSpace 6.0; Philips Healthcare).
Figure 1.
A 67-year-old male with a personal history of asbestos exposure and persistent right thoracic pain. Transverse turbo spin echo single-shot T2 weighted image (a) showing a focal pleural thickening at the posterior wall of the right inferior lobe with the associated area of round atelectasia. The finding is confirmed with transverse contrast-enhanced fast field echo three-dimensional T1 weighted sequence with fat suppression (THRIVE) acquired after administration of Gd-BOPTA (MultiHance®; Bracco, San Donato Milanese, Italy) (b), showing slight enhancement of the thickening. Respiratory-triggered diffusion-weighted MR image (b = 750 s mm−2) (c) and apparent diffusion coefficient (ADC) map (d) show no restriction of the diffusivity. The ADC value was calculated as 1.69 × 10⁻³ mm2 s−1. Histological diagnosis resulted consistent with chronic pleuritis.
Figure 2.
An 83-year-old male with persistent left posterior thoracic pain. Transverse turbo spin echo single-shot T2 weighted image (a) showing a large pleural effusion with posterior distribution at the left hemithorax. Transverse contrast-enhanced fast field echo three-dimensional T1 weighted sequence with fat suppression (THRIVE) acquired after administration of Gd-BOPTA (MultiHance®; Bracco, San Donato Milanese, Italy) (b) shows the presence of slight enhancement of an anterior pleural thickening, barely appreciable on morphologic sequences. Respiratory-triggered diffusion-weighted MR image (b = 750 s mm−2) (c) and apparent diffusion coefficient (ADC) map (d) allowed calculation of an ADC value of 2.03 × 10⁻³ mm2 s−1. ADC measurement was performed far from the loculated effusion to avoid the corpuscolated part that could condition the measurement. Histological assessment showed a diagnosis of atypical mesothelial hyperplasia.
Medical thoracoscopy
Medical thoracoscopy was performed in a fully equipped operating theater, under conscious sedation (intravenous administration of Propofol). In each patient, a minimum of 10 parietal pleural biopsies were taken.10 Histological specimens, obtained by medical thoracoscopy, were assessed by standard protocols used in our pathology department (ASL 5 “Spezzino”, Sarzana (SP), Italy).11
Statistical analysis
The ADC values obtained were compared with regard to the malignant nature of the lesions and to different histological subtypes. The data were analyzed by Student's t-test to compare the ADC values. A value of p < 0.05 was considered statistically significant.
RESULTS
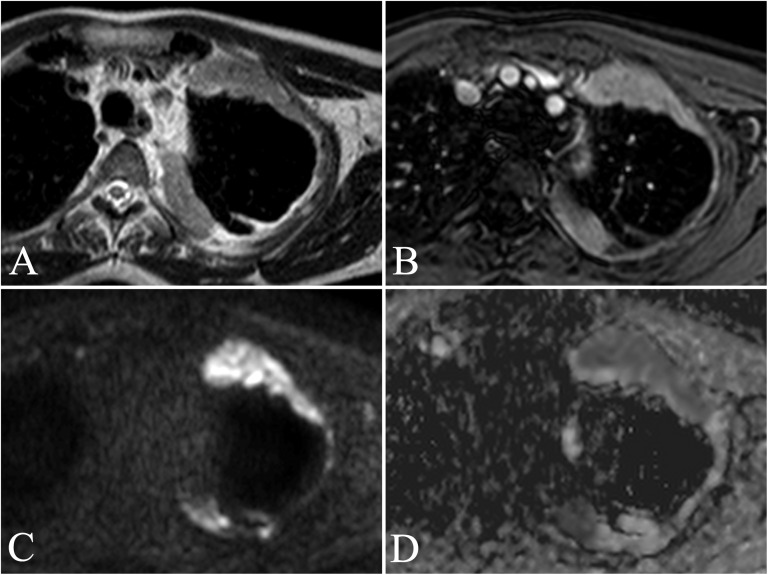
All 56 patients underwent thoracoscopic biopsy with histological evaluation of the lesions, and the ADC was calculated in all patients. The mean time interval between MRI and histological evaluation was 23.8 ± 19.7 days. 12 of 56 patients with a clinical and CT suspicion of MPM turned out to be histologically not MPM and were classified as non-neoplastic pleural disease (NNPD). The diagnosis in these cases included eight chronic pleuritis and four cases of atypical mesothelial hyperplasia. The remaining 44 patients showed a histological diagnosis of MPM, including 31 epithelioid (Figure 3), 4 biphasic and 9 sarcomatoid MPMs.
Figure 3.
A 62-year-old male with a personal history of asbestos exposure and persistent left anterior thoracic pain. Transverse turbo spin echo single-shot T2 weighted (a) and contrast-enhanced fast field echo three-dimensional T1 weighted images with fat suppression (THRIVE) (b) show apical anterior and posterior marginal costal and mediastinal pleural thickenings involving the left hemithorax, with marked enhancement after administration of Gd-BOPTA (MultiHance®; Bracco, San Donato Milanese, Italy). Respiratory-triggered diffusion-weighted MR image (b = 750 s mm−2) (c) confirms the presence of elevated diffusion restriction of the focal pleural thickenings, showing low signal intensity on the apparent diffusion coefficient (ADC) map (d). The ADC value was calculated as 0.85 × 10⁻³ mm2 s−1. Histological diagnosis results were consistent with epithelioid malignant pleural mesothelioma.
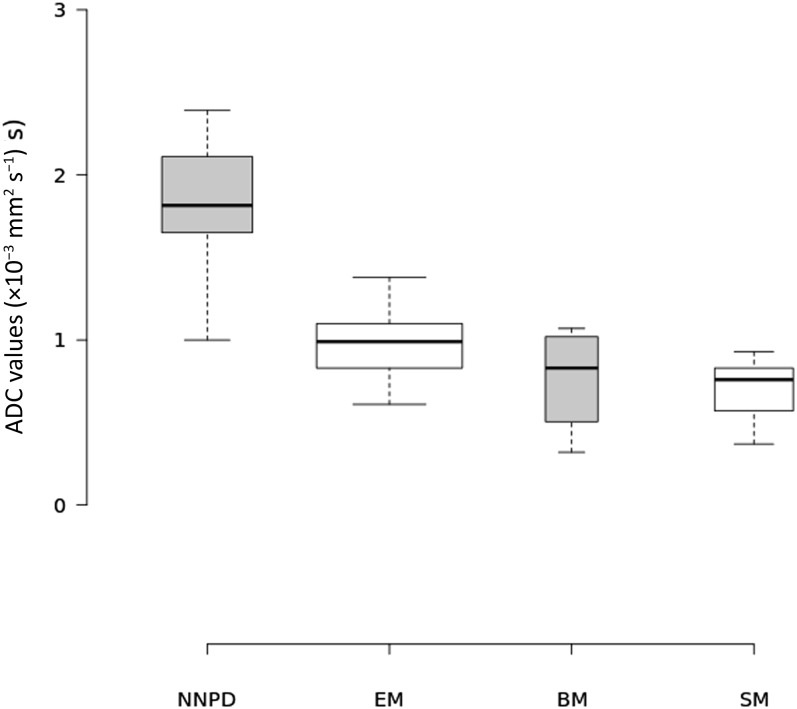
The average ADC value of NNPD was 1.84 ± 0.37 [standard deviation (SD)] × 10−3 mm2 s−1; the average ADC value in each histological subtype of MPM was 0.96 ± 0.19 (SD) × 10−3 mm2 s−1 for epithelioid, 0.76 ± 0.33 × 10⁻³ mm2 s−1 for biphasic and 0.67 ± 0.2 × 10⁻³ mm2 s−1 for sarcomatoid tumours. The distribution of ADC values by histological subtype is shown in Figure 4. Statistical analysis showed that the ADC of NNPD was significantly than that of malignant pleural disease (p < 0.0001); regarding the histological subtypes, the ADC of the epithelioid subtype was significantly higher with respect to sarcomatoid subtype (p = 0.0004). On the other hand, there was no statistically significant difference between the ADC values of biphasic and epithelioid subtypes (p = 0.0883) and between biphasic and sarcomatoid MPM (p = 0.5559). The ADC values of biphasic MPM showed a wide range of overlap with those of other subtypes, ranging from 0.32 to 1.07 × 10⁻³ mm2 s−1. With an optimal ADC cutoff value of 1.5 × 10⁻³ mm2 s−1, diagnostic performance resulted as follows: sensitivity of 100%, specificity of 91.67%, accuracy of 98.21%, positive-predictive value of 97.78% (95% CI = 88.433–99.606%) and negative-predictive value of 100% (95% CI = 74.116–100%).
Figure 4.
Boxplot showing the distribution of apparent diffusion coefficient (ADC) values of non-neoplastic pleural disease (NNPD) and of malignant pleural mesothelioma (MPM) divided by histological subtypes. Average ADC values were as follows: epithelioid, 0.96 ± 0.19 (SD) × 10−3 mm2 s−1; biphasic, 0.76 ± 0.33 × 10⁻³ mm2 s−1; and sarcomatoid, 0.67 ± 0.2 × 10⁻³ mm2 s−1. Centre lines show the medians; box limits indicate the 25th and 75th percentiles as determined by the R software; whiskers extend 1.5 times the interquartile range from the 25th and 75th percentiles, outliers are represented by dots; width of the boxes is proportional to the square root of the sample size. n = 12 (NNPD), 31 [epithelioid mesothelioma (EM)], 4 [biphasic mesothelioma (BM)], 9 [sarcomatoid mesothelioma (SM)].
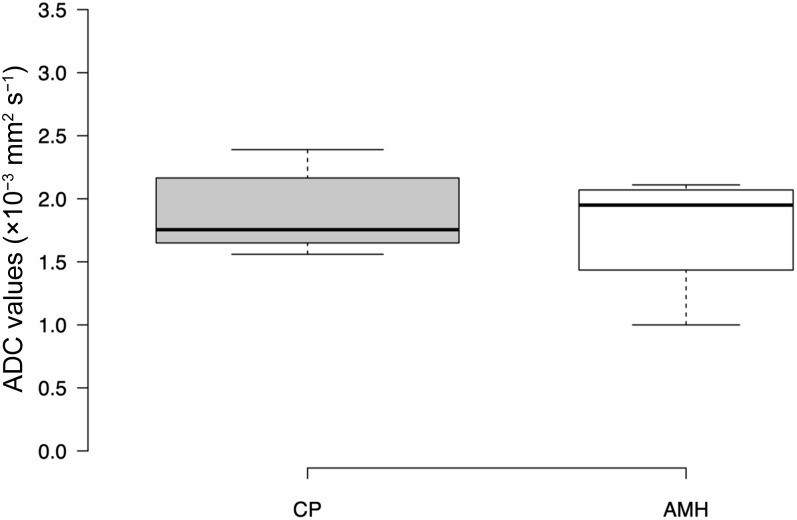
Regarding patients with NNPD, 8 patients had chronic pleuritis, whereas 4 patients had atypical mesothelial hyperplasia; the average ADC value was 1.88 ± 0.3 (SD) × 10−3 mm2 s−1 for chronic pleuritis and 1.75 ± 0.5 × 10⁻³ mm2 s−1 for atypical mesothelial hyperplasia, with a not statistically significant difference between these two groups (p = 0.5797), as shown in Figure 5.
Figure 5.
Boxplot showing the distribution of apparent diffusion coefficient (ADC) values of chronic pleuritis and atypical mesothelial hyperplasia. Average ADC values were as follows: chronic pleuritis (CP), 1.88 ± 0.3 [standard deviation (SD)] × 10−3 mm2 s−1; atypical mesothelial hyperplasia (AMH), 1.75 ± 0.5 × 10⁻³ mm2 s−1. Centre lines show the medians; box limits indicate the 25th and 75th percentiles as determined by R software; whiskers extend 1.5 times the interquartile range from the 25th and 75th percentiles, outliers are represented by dots; width of the boxes is proportional to the square root of the sample size. n = 8 (CP) and 4 (AMH).
DISCUSSION
In the past decade, diffusion-weighted MRI emerged as a reliable diagnostic tool in the oncological setting, thanks to its ability to detect differences in water molecule diffusivity within different tissues; tumours with high cellularity and enlarged extracellular space due to modifications of the normal histological structure show a restriction of water molecule motion that can be visualized as a low ADC value on DWI sequences.12
Differential diagnosis between benign and malignant pleural disease and between different histological subtypes of malignant pleural MPM is usually carried out by medical thoracoscopy with targeted biopsies; this method, although characterized by a diagnostic accuracy >95%, is an invasive procedure subject to risk of tumour seeding,13 and the pursuit of less invasive techniques is still ongoing.
Sarcomatoid and epithelioid MPMs present different histological features, with the first ones characterized by a stranded pattern and by more extensive necrosis and cellular oedema, thus leading to restriction of water diffusion. These factors can explain the lower mean value of ADC in sarcomatoid than in epithelioid MPMs, and our results are in line with the literature.8 The overlap in the ADC distribution of epithelioid and sarcomatoid subtypes was quite higher with respect to the results obtained by Gill et al,8 and we believe that further studies will be required to establish a reliable cutoff ADC threshold. The wide range of ADC values of biphasic MPM confirmed the tendency to variation of this subtype with the location of the region of interest and with the dominant histological pattern, with sarcomatoid-dominant biphasic MPM showing lower ADC values with respect to epithelioid-dominant biphasic MPM.14
Morphological sequences such as single-shot turbo spin echo T2 weighted and post-contrast T1 weighted THRIVE allowed to differentiate calcified pleural plaques and to obtain a more reliable measurement of ADC values in patients with minimal pleural thickness (i.e. NNPD): the correlation system of tracking point turned out to be a very useful tool to improve the accuracy of ADC measurement. In fact, thanks to these features, we were able to confirm a statistically significant difference in ADC values between malignant and NNPD, as previously reported by Coolen et al.15
Since the main challenges in performing DWI to the thoracic region are represented by respiratory motion and by susceptibility artefacts, the innovative aspect of our work consisted in the application of a respiratory-triggered sequence, whereas previous studies utilized free breathing or breath-hold techniques.8,9,15 In the free breathing DWI technique, multiple averages (often >4) are used to obtain an optimal SNR. The ADC values can be calculated because the thoracic wall movements are slow, regular and extensive, and they can be considered as a coherent motion. This type of DWI acquisition technique has the advantage of high SNR while the disadvantages include a long acquisition time and the presence of the blurring effect on images that prevents the assessment of ADC values in small lesions. The respiratory-triggered DWI shares all the advantages of the free breathing technique and enables to assess a more accurate measurement of ADC value also in small lesions due to minimal thoracic respiratory wall motion artefact.16 The disadvantage of long acquisition time can be reduced using high value of parallel imaging. In our protocol, the DWI signal acquisition was selected on the basis of the duration time of expiratory phase of the single patient (1, 2, 4 s) to reduce as much as possible the slice misalignment (Table 1). Other studies such as that by Gill et al8 obtained similar results using a free breathing technique with an acquisition time of 6 min 5 s. The reduction time achieved with our protocol should be considered an advantage especially in those patients who have low respiratory capability. Furthermore, the reduction of thoracic wall motion due to the triggering technique improved the SNR on ADC map and the higher contrast-to-noise ratio allowed a more accurate measurement of ADC values, especially in cases of suspected chronic pleuritis or atypical mesothelial hyperplasia, where a clear pleural thickening was not appreciable. Furthermore, the lower distribution of ADC values in the evaluation of the different histological subtypes of MPM with respect to the study by Gill et al8 could be partially explained by the use of a different DWI technique.
The main limitation to our study was represented by the inclusion of only patients with suspected malignant pleural disease. In addition, the number of patients with NNPD was relatively smaller than that of patients with MPMs. Image analysis was performed in consensus by two experienced radiologists, so we were not able to assess observer variability regarding ADC measurements; nevertheless, we believe that our findings may be of great relevance for the evaluation of pleural disease. Finally, the location of ROIs on ADC maps could not be matched with the biopsy targets in all patients, even though the multidisciplinary reading of the images, involving both the radiologist and the pneumologist who performed the biopsy, was very helpful to minimize the mismatch during the biopsy procedure.
In conclusion, our study confirmed a statistically significant difference of ADC values between NNPD and MPM and between two different histological subtypes of MPM, with lower values corresponding to sarcomatoid tumours. The use of a respiratory-triggered diffusion-weighted sequence allowed us to obtain an accurate measurement of the ADC value in small lesions due to the minimization of motion artefacts, and the reduction of the acquisition time should be considered an important factor when dealing with patients with a compromised respiratory status.
Contributor Information
Matteo Revelli, Email: matteorevelli@gmail.com.
Fabio Chiesa, Email: chiesa.fabio@gmail.com.
Alberto Del Prato, Email: albertodelprato1@gmail.com.
Alberto Tagliafico, Email: albertotagliafico@gmail.com.
Ilan Rosenberg, Email: ilan.rosenberg@asl5.liguria.it.
Pier Aldo Canessa, Email: pieraldo.canessa@asl5.liguria.it.
Valentina Pinelli, Email: valentina.pinelli@asl5.liguria.it.
Alessandro Villa, Email: dr.willaav@gmail.com.
REFERENCES
- 1.Bonomo L, Feragalli B, Sacco R, Merlino B, Storto ML. Malignant pleural disease. Eur J Radiol 2000; 34: 98–118. doi: 10.1016/S0720-048X(00)00168-6 [DOI] [PubMed] [Google Scholar]
- 2.Tsao AS, Wistuba I, Roth JA, Kindler HL. Malignant pleural mesothelioma. J Clin Oncol 2009; 27: 2081–90. doi: 10.1200/JCO.2008.19.8523 [DOI] [PMC free article] [PubMed] [Google Scholar]
- 3.Scherpereel A, Astoul P, Baas P, Berghmans T, Clayson H, de Vuyst P, et al. ; European Respiratory Society/European Society of Thoracic Surgeons Task Force. Guidelines of the European Respiratory Society and the European Society of Thoracic Surgeons for the management of malignant pleural mesothelioma. Eur Respir J 2010; 35: 479–95. doi: 10.1183/09031936.00063109 [DOI] [PubMed] [Google Scholar]
- 4.Yamamuro M, Gerbaudo VH, Gill RR, Jacobson FL, Sugarbaker DJ, Hatabu H. Morphologic and functional imaging of malignant pleural mesothelioma. Eur J Radiol 2007; 64: 356–66. doi: 10.1016/j.ejrad.2007.08.010 [DOI] [PubMed] [Google Scholar]
- 5.Metintas M, Ucgun I, Elbek O, Erginel S, Metintas S, Kolsuz M, et al. Computed tomography features in malignant pleural mesothelioma and other commonly seen pleural diseases. Eur J Radiol 2002; 41: 1–9. doi: 10.1016/S0720-048X(01)00426-0 [DOI] [PubMed] [Google Scholar]
- 6.Erasmus JJ, Truong MT, Smythe WR, Munden RF, Marom EM, Rice DC, et al. Integrated computed tomography-positron emission tomography in patients with potentially resectable malignant pleural mesothelioma: staging implications. J Thorac Cardiovasc Surg 2005; 129: 1364–70. doi: 10.1016/j.jtcvs.2004.10.034 [DOI] [PubMed] [Google Scholar]
- 7.Fujimoto K. Usefulness of contrast-enhanced magnetic resonance imaging for evaluating solitary pulmonary nodules. Cancer Imaging 2008; 8: 36–44. doi: 10.1102/1470-7330.2008.0009 [DOI] [PMC free article] [PubMed] [Google Scholar]
- 8.Gill RR, Umeoka S, Mamata H, Tilleman TR, Stanwell P, Woodhams R, et al. Diffusion-weighted MRI of malignant pleural mesothelioma: preliminary assessment of apparent diffusion coefficient in histologic subtypes. AJR Am J Roentgenol 2010; 195: W125–30. doi: 10.2214/AJR.09.3519 [DOI] [PubMed] [Google Scholar]
- 9.Coolen J, De Keyzer F, Nafteux P, De Wever W, Dooms C, Vansteenkiste J, et al. Malignant pleural mesothelioma: visual assessment by using pleural pointillism at diffusion-weighted MR imaging. Radiology 2015; 274: 576–84. doi: 10.1148/radiol.14132111 [DOI] [PubMed] [Google Scholar]
- 10.Canessa PA, Ferro P, Manta C, Sivori M, Franceschini MC, Fedeli F, et al. Clinical value of mesothelin in pleural effusions versus histology by medical thoracoscopy: brief report. Med Oncol 2013; 30: 649. doi: 10.1007/s12032-013-0649-x [DOI] [PubMed] [Google Scholar]
- 11.Franceschini MC, Ferro P, Canessa PA, Battolla E, Dessanti P, Valentino A, et al. Mesothelin in serum and pleural effusion in the diagnosis of malignant pleural mesothelioma with non-positive cytology. Anticancer Res 2014; 34: 7425–30. [PubMed] [Google Scholar]
- 12.Koh DM, Collins DJ. Diffusion-weighted MRI in the body: applications and challenges in oncology. AJR Am J Roentgenol 2007; 188: 1622–35. doi: 10.2214/AJR.06.1403 [DOI] [PubMed] [Google Scholar]
- 13.Agarwal PP, Seely JM, Matzinger FR, MacRae RM, Peterson RA, Maziak DE, et al. Pleural mesothelioma: sensitivity and incidence of needle track seeding after image-guided biopsy versus surgical biopsy. Radiology 2006; 241: 589–94. doi: 10.1148/radiol.2412051020 [DOI] [PubMed] [Google Scholar]
- 14.Armato SG, 3rd, Coolen J, Nowak AK, Robinson C, Gill RR, Straus C, et al. Imaging in pleural mesothelioma: a review of the 12th International Conference of the International Mesothelioma Interest Group. Lung Cancer 2015; 90: 148–54. doi: 10.1016/j.lungcan.2015.07.011 [DOI] [PubMed] [Google Scholar]
- 15.Coolen J, De Keyzer F, Nafteux P, De Wever W, Dooms C, Vansteenkiste J, et al. Malignant pleural disease: diagnosis by using diffusion-weighted and dynamic contrast-enhanced MR imaging—initial experience. Radiology 2012; 263: 884–92. doi: 10.1148/radiol.12110872 [DOI] [PubMed] [Google Scholar]
- 16.Kandpal H, Sharma R, Madhusudhan KS, Kapoor KS. Respiratory-triggered versus breath-hold diffusion-weighted MRI of liver lesions: comparison of image quality and apparent diffusion coefficient values. AJR Am J Roentgenol 2009; 192: 915–22. doi: 10.2214/AJR.08.1260 [DOI] [PubMed] [Google Scholar]


