Erratum
After publication of the original article [1], it is noticed that all the Figures in the HTML version of the article are incorrect, please see the correct figures below. We apologize for any inconvenience caused.
Fig. 1.
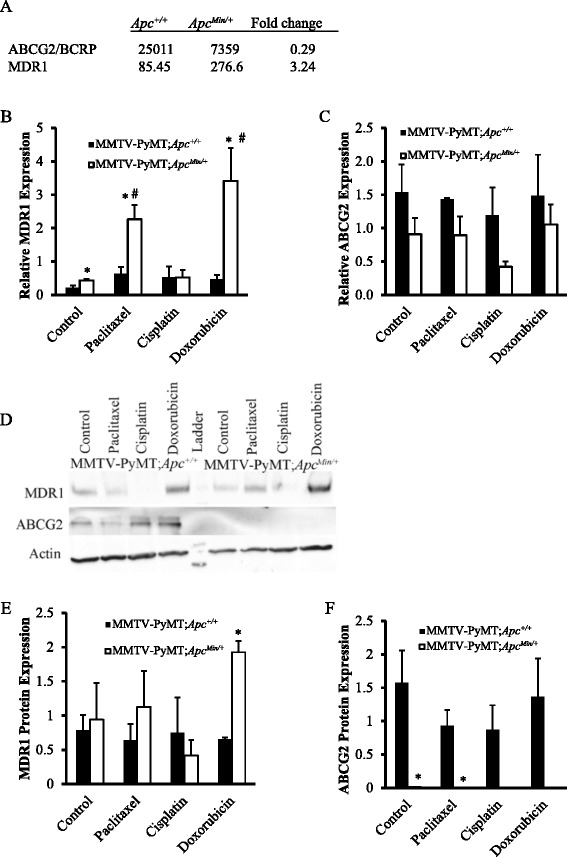
Gene expression of ATP-dependent binding cassette transporters. a Microarray analysis of mammary glands from Apc Min/+ and Apc +/+ mice at d16 of lactation show a decrease in ABCG2 and increase in MDR1 expression due to Apc mutation. b MDR1 gene expression in cells from MMTV-PyMT;Apc Min/+ and MMTV-PyMT;Apc +/+ mice after 24 h treatment with either solvent control, paclitaxel, cisplatin or doxorubicin. MDR1 expression was significantly increased in cells from MMTV-PyMT;Apc Min/+ mice after treatment with paclitaxel and doxorubicin but not cisplatin. c ABCG2 gene expression in cells from MMTV-PyMT;Apc Min/+ and MMTV-PyMT;Apc +/+ mice after treatment for 24 h with either solvent control, paclitaxel, cisplatin or doxorubicin. ABCG2 expression was not different between MMTV-PyMT;Apc Min/+ and MMTV-PyMT;Apc +/+ cells and chemotherapy treatment had no effect on ABCG2 expression. d Representative western blots for MDR1 and ABCG2 in cells from MMTV-PyMT;Apc Min/+ and MMTV-PyMT;Apc +/+ mice after treatment for 24 h with either solvent control, paclitaxel, cisplatin or doxorubicin. e Quantification of MDR1 western blots shows that MMTV-PyMT;Apc Min/+ cells have enhanced MDR1 expression when treated with doxorubicin. f Quantification of ABCG2 western blots shows that MMTV-PyMT;Apc +/+ cells have elevated ABCG2 protein expression compared to MMTV-PyMT;Apc Min/+ cells. Results in b, c, e and f are shown as the means ± SEM from 3 independent experiments; *P < 0.05 when comparing MMTV-PyMT;Apc Min/+ to MMTV-PyMT;Apc +/+ cells and #P < 0.05 when comparing MMTV-PyMT;Apc Min/+ cells treated with solvent control or chemotherapy agent
Fig. 2.
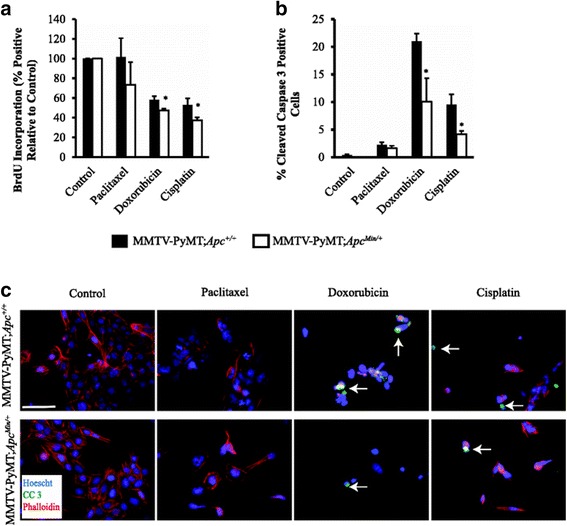
Cell proliferation and apoptosis in MMTV-PyMT;Apc Min/+ and MMTV-PyMT;Apc +/+ cells after treatment with paclitaxel, cisplatin and doxorubicin. a Cell proliferation as measured by BrdU incorporation after chemotherapuetic treatment. MMTV-PyMT;Apc Min/+ cells showed a modest decrease in proliferation after treatment with cisplatin and doxorubicin compared to MMTV-PyMT;Apc +/+ cells. b Apoptosis as measured by cleaved caspase 3 immunofluorescence (IF). The percentage of apoptosis was lower in cisplatin and doxorubicin treated MMTV-PyMT;Apc Min/+ compared to MMTV-PyMT;Apc +/+ cells while paclitaxel treatment did not affect apoptosis levels. c Representative images of cleaved caspase 3 (CC3) IF. The scale bar is equal to 200 microns. White arrows are representative cleaved caspase 3 positive cells. Data are shown as the means ± SEM from 3 independent experiments; *P < 0.05
Fig. 3.
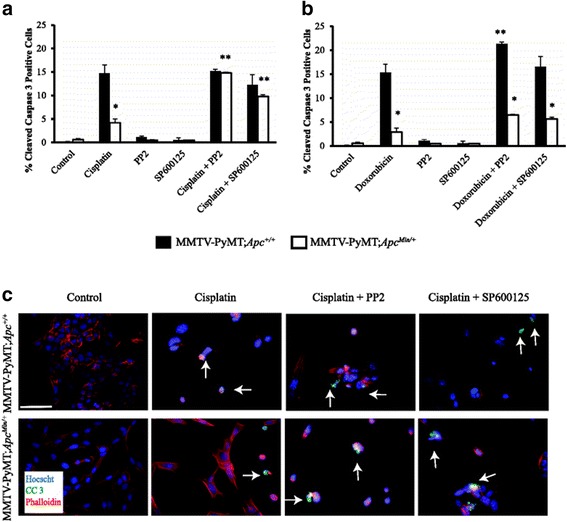
Apoptosis in MMTV-PyMT;Apc Min/+ and MMTV-PyMT;Apc +/+ cells treated with chemotherapeutic drugs and targeted inhibitors. a Apoptosis was measured by cleaved caspase 3 IF in the presence of cisplatin. Treatment with cisplatin and either PP2 or SP600125 significantly increases apoptosis compared to cisplatin alone in MMTV-PyMT;Apc Min/+cells. No effect was observed with the addition of PP2 or SP600125 in the MMTV-PyMT;Apc +/+cells. b Apoptosis was measured by cleaved caspase 3 IF with doxorubicin treatments. c Representative cleaved caspase 3 IF images of cells treated with cisplatin and the targeted inhibitor. The scale bar is equal to 200 microns and arrows are used to depict specific cleaved caspase 3 (CC 3) positive cells in each image. Data are shown as the means ± SEM from 3 independent experiments; *P < 0.05 when comparing MMTV-PyMT;Apc Min/+ to MMTV-PyMT;Apc +/+ cells and ** P < 0.05 when comparing the combination treatment versus a single agent (cisplatin or doxorubicin)
Fig. 4.
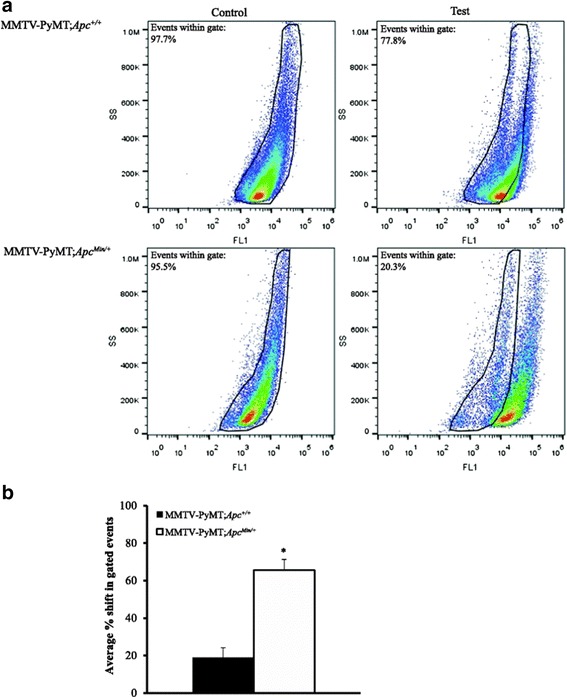
MMTV-PyMT;Apc Min/+ cells have higher aldehyde dehydrogenase (ALDH) enzyme activity than MMTV-PyMT;Apc +/+ cells. ALDH activity was measured using an Aldefluor™ Kit. For each cell line a Control (+DEAB) and test (−DEAB) sample were run. a Representative FACS analysis of ALDH activity in MMTVPyMT; Apc +/+ and MMTV-PyMT;Apc Min/+ cells using the Aldefluor™ assay. ALDH activity is increased in MMTV-PyMT;Apc Min/+ cells. b The population of cells that shifted outside of the control population was calculated for each test sample, indicating ALDH activity. MMTV-PyMT;Apc Min/+cells show a larger percentage of cells shifted outside of the control range than MMTV-PyMT;Apc +/+cells. Data are shown as the means ± SEM from 3 independent experiments; *P < 0.05
Fig. 5.
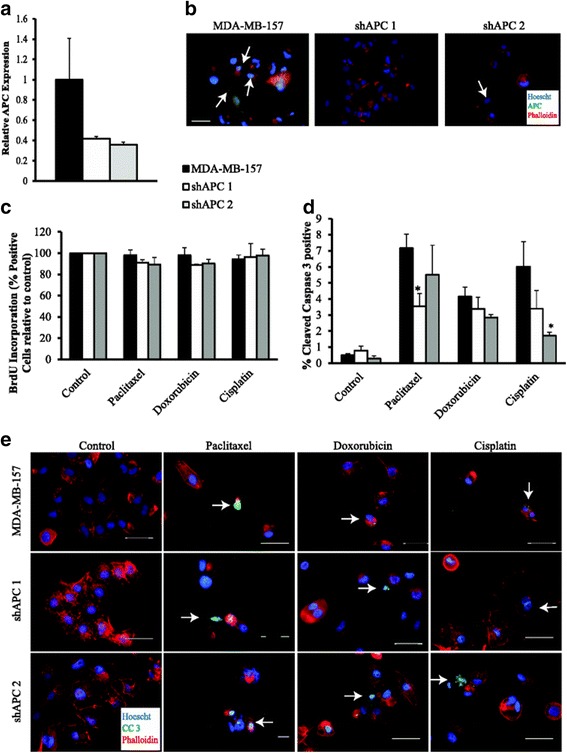
APC knockdown in MDA-MB-157 cells impacts response to paclitaxel and cisplatin. a Quantitative RT-PCR in MDA-MB-157 cells and shAPC constructs shows decreased level of APC in cells infected with the shAPC constructs. b Representative APC immunofluorescence images showing that APC knockdown cells have less APC protein compared to the MDA-MB-157 parent line. c Cell proliferation as measured by BrdU incorporation did not differ between the three cell lines after treatment with cisplatin, doxorubicin or paclitaxel. d Apoptosis as measured by cleaved caspase 3 IF. The percentage of apoptosis was lower in paclitaxel treated shAPC 1 and cisplatin treated shAPC 2 cells compared to MDA-MB-157 control cells. Doxorubicin treatment had no effect on rates of apoptosis. e Representative images of CC3 IF. Although there are a similar number of positive cells in many of the images, there are fewer total cells in those images representing treatments with a higher percent of apoptosis. The scale bar is equal to 100 microns (e) and 20 microns (b). Data are shown as the means ± SEM from 3 independent experiments; *P < 0.05
Footnotes
The online version of the original article can be found under doi:10.1186/s12885-015-1456-x.
Reference
- 1.VanKlompenberg MK, et al. APC selectively mediates response to chemotherapeutic agents in breast cancer. BMC Cancer. 2015;15:457. doi: 10.1186/s12885-015-1456-x. [DOI] [PMC free article] [PubMed] [Google Scholar]


