Abstract
We characterized Cryptococcus neoformans recombinant antiphagocytic protein 1 (rApp1) by SDS–PAGE, gel filtration chromatography, circular dichroism, and fluorescence spectroscopy. rApp1 produced by C. neoformans var. grubii contains an odd number of cysteines; therefore, it has the ability to form intermolecular disulfide bridges which can lead to the formation of amyloid fibrils in the absence of β-mercaptoethanol or DTT in vitro. Alternate approaches to over-expression of rApp1 in the Lepidopteran High Five™ Insect cell line using pIZ/V5-His and in lentivirus were explored and are described. Finally, localization of App1 in vivo was examined in the presence and absence of the capsule.
Keywords: Cryptococcus neoformans, Antiphagocytic protein 1 (App1), Intermolecular disulfide bridges, Insect cells, Lentivirus
Introduction
Cryptococcus holds the notable distinction of being the only organism to produce the specific antiphagocytic protein 1 (App1). App1 regulates Cryptococcus neoformans virulence by inhibiting phagocytosis of the fungus by alveolar macrophages via a complement- mediated mechanism [1, 2]. C. neoformans var. neoformans and C. gattii App1 contain six cysteine residues, whereas C. neoformans var. grubii App1 contains 7 cysteine residues, increasing the likelihood of the formation of intramolecular disulfide bonds (BLASTP). We carried out studies including native PAGE, gel filtration chromatography, circular dichroism and rhodamine fluorescence spectroscopy. To further characterize App1, we investigated the feasibility of different over-expression systems to optimize the production of soluble App1 versus the production of the recombinant protein in the form of inclusion bodies, which need to be solubilized and purified under denaturing conditions [1]. We also examined the localization of App1 in vivo and explored the interaction between rApp1 and the capsular polysaccharide glucuronoxylomannan (GXM).
Materials and Methods
Strains, Medium, and Reagents
Cryptococcus neoformans var. grubii serotype A H99-derived strain Δapp1 has been described previously in great detail [3]. H99 (wild type [WT]), Δapp1, and an acapsular strain Δcap59 were grown in yeast extract-peptone-2% dextrose (YPD) medium from Difco. Recombinant App1 (rApp1) was obtained as previously described [1] and stored at −80°C in 50 mM Tris–HCl, 150 mM NaCl, 5% glycerol, 2 mM β-mercaptoethanol, pH 7.9. Total protein from WT was extracted as described previously [2]. High Five™ insect cells were a kind gift from Dr Sergey Krupenko (Medical University of South Carolina). GXM and mAb 18b7 were a kind gift from Dr Arturo Casadevall (Albert Einstein College of Medicine). All reagents used were obtained from Sigma Chemical Co. (St. Louis, MO) unless otherwise specified.
Native PAGE of rApp1
A 2.5 mg/ml stock of rApp1 was obtained as described previously [1]. Dilutions were carried out, and 10 µl of each fraction separated by Native PAGE under non-reducing conditions on a Criterion ™ precast gel (Bio-Rad Cat # 345-0033). GelCode Blue stain reagent (Thermo Scientific, prod # 24590) was used to stain the gel, and it was destained with distilled water.
Mass Spectrometry of rApp1
Mass spectrometry was carried out at the MUSC Protein Mass Spectrometry Core in the Department of Cell and Molecular Pharmacology and Experimental Therapeutics.
Gel Filtration Chromatography
One hundred microlitre of a 1 mg/ml solution of rApp1 dialyzed into PBS buffer was injected onto a Superdex 75 10/300 GL gel filtration column at 10°C (GE Healthcare Cat # 17-5174-01) using an AKTA fast-performance liquid chromatography system (GE Healthcare), pre-equilibrated with phosphate-buffered saline (PBS) supplemented with 137 mM NaCl, 2.7 mM KCl, 10 mM Na2HPO4, and 2 mM KH2PO4 pH 7.6. The molecular weight markers comprised a mixture of aprotinin (6.5 kDa), ribonuclease A (13.7 kDa), carbonic anhydrase (29 kDa), ovalbumin (43 kDa), and conalbumin (75 kDa). Blue dextran was used to determine the void volume. Flow rate was 1 ml/min and absorbance was monitored at A280 nm.
Circular Dichroism
Circular dichroism (CD) spectra were recorded on an Aviv 400 model CD spectrometer. Measurements were carried out at either 5 or 25°C in a 1-mm path length quartz cuvette with protein concentrations ranging from 6 to 50 µM. Spectra were recorded in the 198–260 nm wavelength range with a 1 nm increment and a 5 s integration time. Three scans per sample were collected. Spectra were processed, baseline corrected, and smoothed using Aviv software. Spectral units were expressed as the molar ellipticity per residue. The secondary structure content was estimated using CDPro with the CONTINLL method, using an extended reference set of 43 proteins (SP43) [4, 5].
Solubility Assays
The method described by Bondos and Bicknell was used [6]. Briefly, 10 µl of 125 nM rApp1 was added to 100 µl of either 20 mM Tris pH 7.8 alone or 20 mM Tris pH 7.8 containing (a) 50, 100 or 200 mM KCl, (b) 10% glycerol with/without 200 mM KCl, (c) 0.5 M urea, or (d) 10 mM EDTA. The diluted protein was incubated at room temperature for 1 h then separated from aggregated protein using a Microcon concentrator with a 100,000 MWCO by centrifugation at 14,000 × g for 12 min. Aggregated protein retained on the membrane was resuspended in 30 µl of doubly distilled water, then spin inverted at 1,000 × g for 3 min. Samples of 30 µl each of soluble and aggregated protein were analyzed by SDS–PAGE.
Fluorescence Microscopy
Rhodamine fluorescence microscopy was carried out on a Nikon TE2000S Eclipse microscope equipped with a rhodamine filter. Five microliters of rApp1 protein was air-dried on a glass slide followed by the addition of Congo Red staining buffer following previously published protocols [7].
Expression of rApp1 in Lepidopteran High Five™ Insect Cell Line Using pIZ/V5-His
Purified plasmid DNA was obtained from the vector pBAD-His-App1 that had been transformed into E. coli TOP10 strain. The plasmid DNA was used as a template for PCR with primers 1 (5′-GAATTCGCCATGGCCATGTCCTCTGCCACTGC-3′) and 2 (5′-TAGACTCGAGCCAATCATCAATGT TCGCAG-3′) containing EcoRI and XhoI sites, respectively (bolded and underlined), and a Kozak translation initiation sequence (italics) containing an ATG start codon (italics and underlined). The resulting fragment was cloned into TOPO vector, transformed into One Shot® TOP10 E. coli cells digested with EcoRI and XhoI, and cloned into pIZ-V5/His vector (Invitrogen Life Technology), generating pIZ-V5/His-App1. The pIZ-V5/His-App1 vector was sequenced to ensure no mutations were inserted by genetic manipulations and then transformed into E. coli TOP10 strain (Invitrogen Life Technology). Clones were selected on low-salt LB plates containing Zeocin™. Plasmid DNA was isolated and sequenced, and the construct was transfected into High Five™ insect cells using Cellfectin®-mediated transfection following the protocol described in the Invitrogen InsectSelect™ system manual (Version F, page 11) using Express Five® serum-free medium in 60-mm culture plates.
Expression of rApp1 in Lentivirus
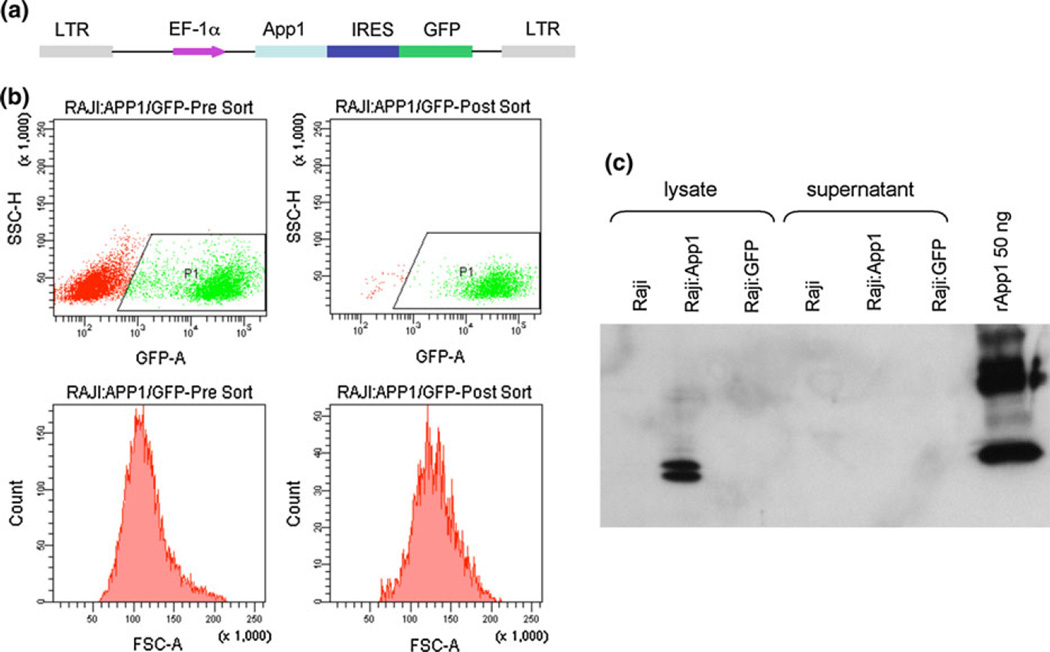
Production of App1 using the pGEX-6P-3 plasmid has been described previously [1]. Lentiviral particle production was conducted by cotransfection of human embryonic kidney cells (HEK293T) with three plasmids, i.e., a packaging defective helper construct (PsPAX2), a vesicular stomatitis virus glycoprotein (VSV-G) envelop coding construct (pMD2.G), and a transfer vector (pHR EF-1α) harboring App1-GFP (Fig. 9a) [America Pharma Source LLP]. A control vector (pHR EF-IRES-GFP) without App1 expressing GFP was also used in this study. The viral particles obtained were stored at −80°C until use.
Fig. 9.
a Lentivector used for App1 expression, b flow cytometry data showing pre- and post-sort for Raji:App1/GFP and c western blot showing App1 is detected in Raji:App1 only in lysate and not in supernatant, implying that App1 is not secreted under these expression conditions
Flow Cytometry
MH-S and Raji cells were subcultured at a density such that they were 50% confluent the next day. The cells were counted and plated on six-well plates before infection. Serial dilution of the lentivirus preparations was made in culture medium and used to infect the cultures by incubation with cells overnight in a volume of 500 µl. The next day, infected cells were washed with fresh medium and incubated for 3 more days in the presence of Polybrene (100 µg/ml) to allow for the expression of the transgenes. The transduced cells were then detached from the culture plates with a buffer containing ethylenediaminetetraacetic acid (EDTA) and washed twice with ice-cold PBS buffer. The pellets of cells infected with Lenti-App1-GFP or Lenti-GFP alone were resuspended in 0.5 ml of lysis buffer (100 mM Tris, 15% glycerol, 1 mM phenylmethylsulfonyl fluoride [PMSF] [Sigma], and 10 µg/ml each of chymostatin [Sigma], leupeptin [Sigma], antipain [Sigma], and pepstatin A [Sigma]), passaged through a 1 cc U-100 insulin syringe (Beckton Dickinson) 10 times and the resulting lysate analyzed by flow cytometry for GFP fluorescence. Positive cells expressing App1 or GFP were used to carry out western blots.
Western Blot
To detect the expression of App1 in vitro, supernatant was removed and cells transduced with Lenti-App1-GFP or Lenti-GFP vector were washed twice with ice-cold PBS buffer followed by lysing the cells with lysis buffer for 1.0 h at 4°C. The lysates were analyzed by SDS–PAGE on a 12% tris–glycine polyacrylamide gel and transferred to nitrocellulose membranes. Following blocking, the membrane was incubated with anti-App1 monoclonal antibody [4–6H] (1:20 dilution) overnight with continuous rocking at 4°C. After extensive washings, membranes were then incubated with goat anti-mouse secondary IgG-HRP (Jackson ImmunoResearch Laboratories Cat # 115-035-146) diluted 1:5,000 for 1 h at room temperature. Signals were visualized using Amersham™ ECL™ Western Blotting Detection Reagents (GE Healthcare) and exposure to Kodak BioMax MR film.
Spheroplasting
A starter culture of H99 was prepared in YPD (10 ml) and incubated for 24 h at 30°C, 250 rpm. A 1:40 dilution in YPD was then carried out and the culture incubated 24 h at 30°C, 250 rpm. The culture was centrifuged at 2,800 rpm and the cells washed 3 times in 0.5 M NaCl/50 mM EDTA, then re-suspended in sterile water and incubated for 1 h at 37°C, with occasional mixing. Following incubation, the cells were centrifuged at 2,800 rpm and resuspended in spheroplastic solution (1 ml) consisting of 1 M sorbitol, 0.1 M sodium citrate pH 5.8, and 0.01 M EDTA with or without 10 mg of lysing enzyme (Sigma cat # L1214). Cells were incubated for 3.5 h at 37°C with occasional mixing. The sample was then centrifuged at 1,000 rpm for 10 min and the resulting supernatant centrifuged again for 20 min at 10,000 × g at 4°C. The supernatant was carefully transferred to a sterile tube and placed on ice.
Pull-Down Assay
The Thermo Scientific ProFound Pull-Down PolyHis Protein:Protein interaction kit (21277) was used to carry out the App1-GXM pull-down assay. The manufacturer’s protocol was followed. Characterization of the samples was carried out by electrophoretic analysis of GXM using a 0.5% (w/v) agarose gel as outlined in McFadden et al. [8] with the following modifications. The transfer was carried out via capillary action overnight onto Nytran Supercharged nylon membranes, and the secondary antibody used was goat anti-mouse IgG-HRP (1:4,000) in Tris-buffered saline.
Co-immunoprecipitation
The Thermo Scientific Co-Immunoprecipitation kit (26149) was used to carry out the GXM-App1 co-IP assay. The manufacturer’s protocol was followed.
Results and Discussion
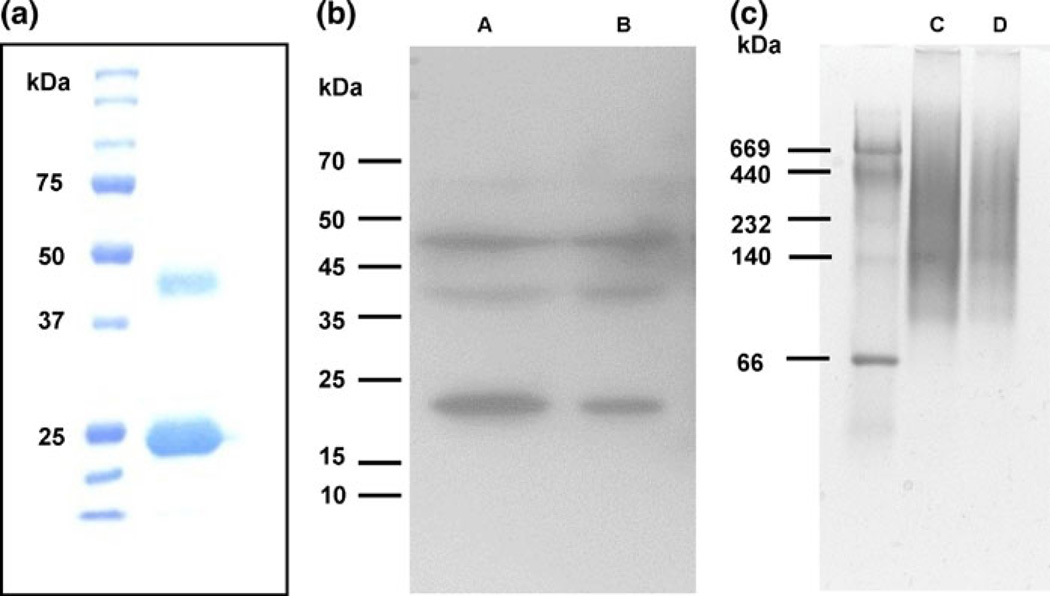
Given the fact that App1 contains an odd number (seven) of cysteines (Fig. 1), we hypothesized that one of them could be free to participate in an intermolecular disulfide bond between two (or more) App1 molecules. To test this, extracts of rApp1 were analyzed under reducing (with β-mercaptoethanol) and non-reducing conditions (native; without β-mercaptoethanol). Under reducing conditions (Fig. 2a), we observed App1 monomer (with His tag ~24 kDa) as well as a band at ~43 kDa. Tryptic digestion followed by mass spectrometry of the 24 and 43 kDa bands revealed both bands were App1 and confirmed that the 43 kDa band was dimeric App1. To confirm that this was not an artifact of the protein expression system used to produce recombinant App1, we ran a Western blot of total protein from C. neoformans WT probing for App1 with anti-App1 4–6H monoclonal antibody (Fig. 2b) which, when freshly isolated, showed mainly the presence of dimer, but after 16 h at −80°C, showed once again monomer, as well as a series of oligomers. Under non-reducing conditions (Fig. 2c), we observed a band at 140 kDa and smears at higher molecular weights, which correspond to App1 oligomers.
Fig. 1.
Protein sequence of App1 from C. neoformans var. grubii. The cysteine residue that is underlined is replaced by an arginine in other C. neoformans serotypes
Fig. 2.
a Fifteen percent Coomassie-stained SDS gel of rApp1. b Western blot from 12% SDS–PAGE of total protein extracted from WT, Lane A 20 mg total protein, Lane B 10 mg total protein; 1° antibody: anti-App1 4–6H (1:20), 2° antibody: goat anti-mouse IgG-HRP (1:5,000), 15 min exposure. c Native PAGE (4–20% Tris–HCl gel) of rApp1, Lane C 20 mg, Lane D 10 mg, stained with GelCode Blue
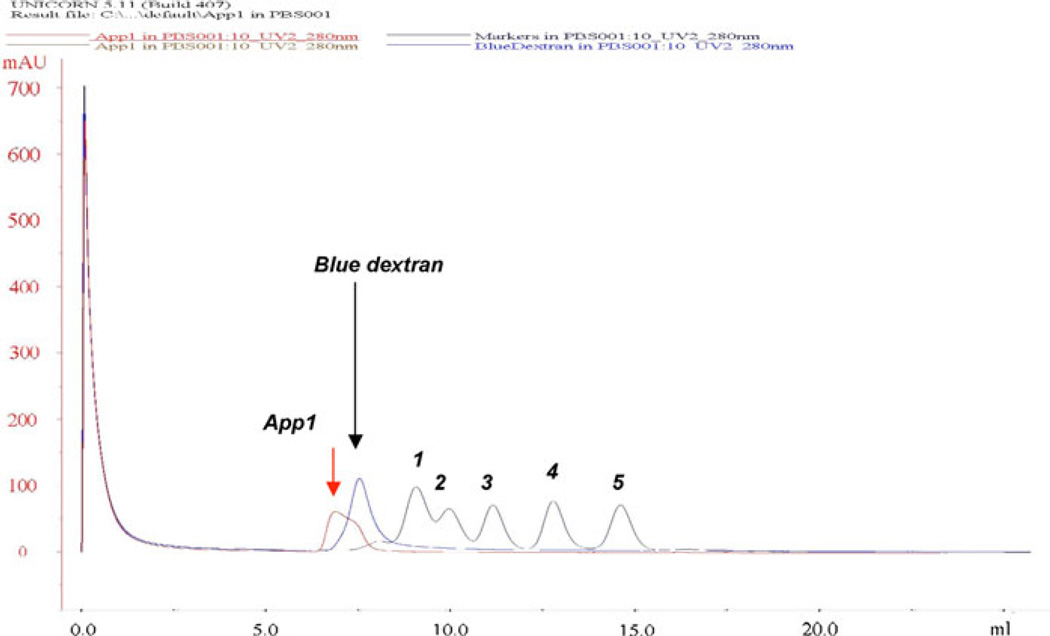
We next examined the elution profile of rApp1 by gel filtration chromatography (GFC) using a Superdex 75 10/300 GL column (Fig. 3), which has a nominal separation range from 3,000 to 70,000 Da. Any protein with a higher molecular weight will therefore elute in the void volume. App1 was dialyzed into the phosphate buffer used for GFC, i.e., PBS buffer supplemented with 137 mM NaCl, 2.7 mM KCl, 10 mM Na2HPO4, and 2 mM KH2PO4 pH 7.6. Under these conditions, it was observed that that the protein eluted in the void volume, suggesting that rApp1 is neither monomeric nor dimeric, but rather may self-associate to form an aggregate. Further support for an aggregate came from the inability to observe rApp1 by 1H NMR. The slow tumbling times of large soluble aggregates broaden resonances, often beyond detection [9]. Attempts to reduce self-association through the use of different buffers systems (phosphate, Tris) and co-solvents (50% acetonitrile) to enable detection of NMR resonances were unsuccessful.
Fig. 3.
Gel filtration chromatogram of rApp1 obtained from separation on Superdex 75 10/300GL column (exclusion limit 105 globular protein; separation range 3,000–70,000 Da). Molecular weight markers used are as follows: 1 conalbumin 75 kDa, 2 ovalbumin 43 kDa, 3 carbonic anhydrase 29 kDa, 4 ribonuclease A 13.7 kDa and 5 aprotinin 6.5 kDa. Elution of App1 was observed in the void volume (Blue dextran is used to determine the void volume) indicating the rApp1 is bigger than conalbumin (75,000 Da)
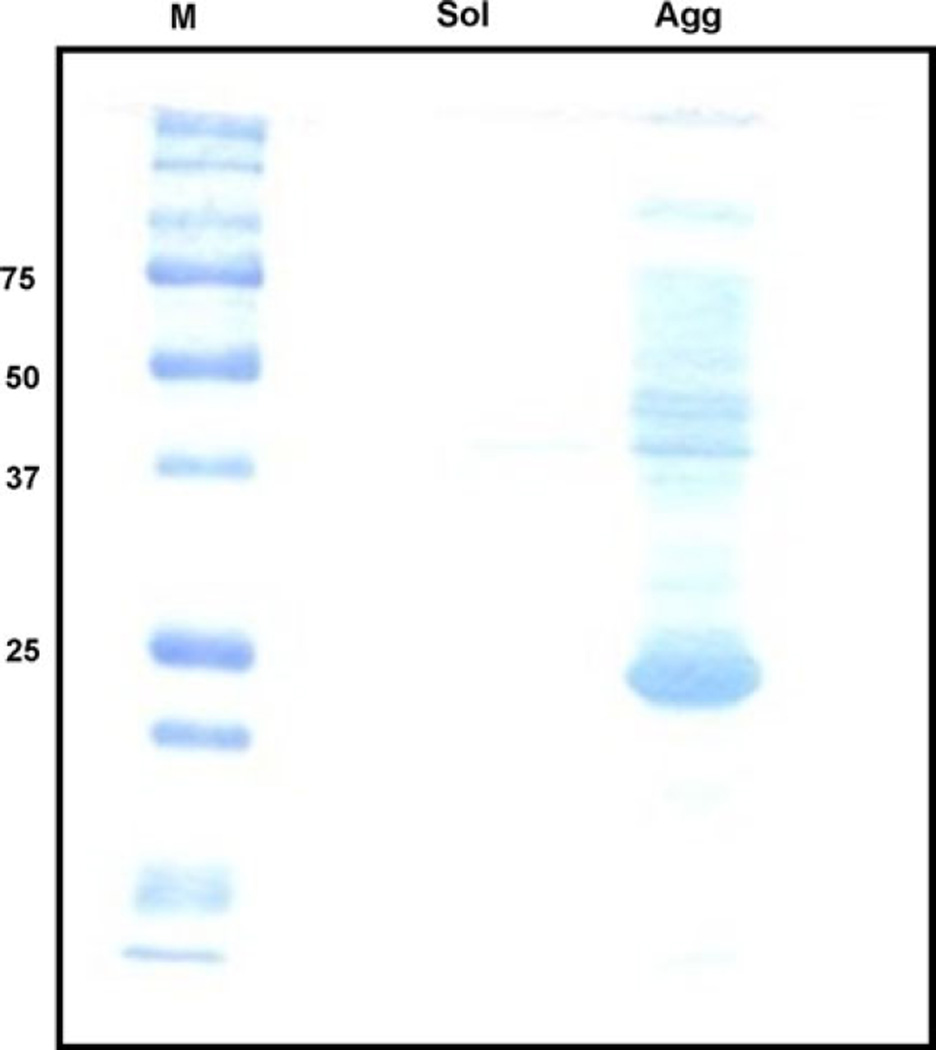
In an attempt to identify a buffer system that would stabilize an unaggregated form of rApp1, we checked the solubility in several Tris-buffer systems lacking β-mercaptoethanol as described in Materials and Methods. The buffer systems were screened by separating native protein from soluble and insoluble aggregates through filtration followed by detection on SDS–PAGE. In all cases, rApp1 was collected in the “aggregate” fraction, which, when subjected to SDS–PAGE, yielded once again the usual monomer with faint dimer and oligomer bands (Fig. 4). The fact that we see dimer bands under reducing conditions and higher-order oligomers under non-reducing conditions suggests that dimer formation may be non-covalent, while the formation of higher-order oligomers may be due to the formation of intermolecular disulfide bonds.
Fig. 4.
Representative 12% SDS–PAGE gel stained with Coomassie Blue of the results obtained from rApp1 solubility assays using eight buffers to screen conditions to enhance solubility. Buffers consisted of (i) 20 mM Tris pH 7.8 alone or with (ii) 50, 100, 200 mM KCl, (iii) 10% glycerol with/without 200 mM KCl, (iv) 0.5 M urea (v) 10 mM EDTA. Following centrifugation using a Microcon concentrator with 100 kDa MWCO, rApp1 is retained on the membrane and collected via an invert spin
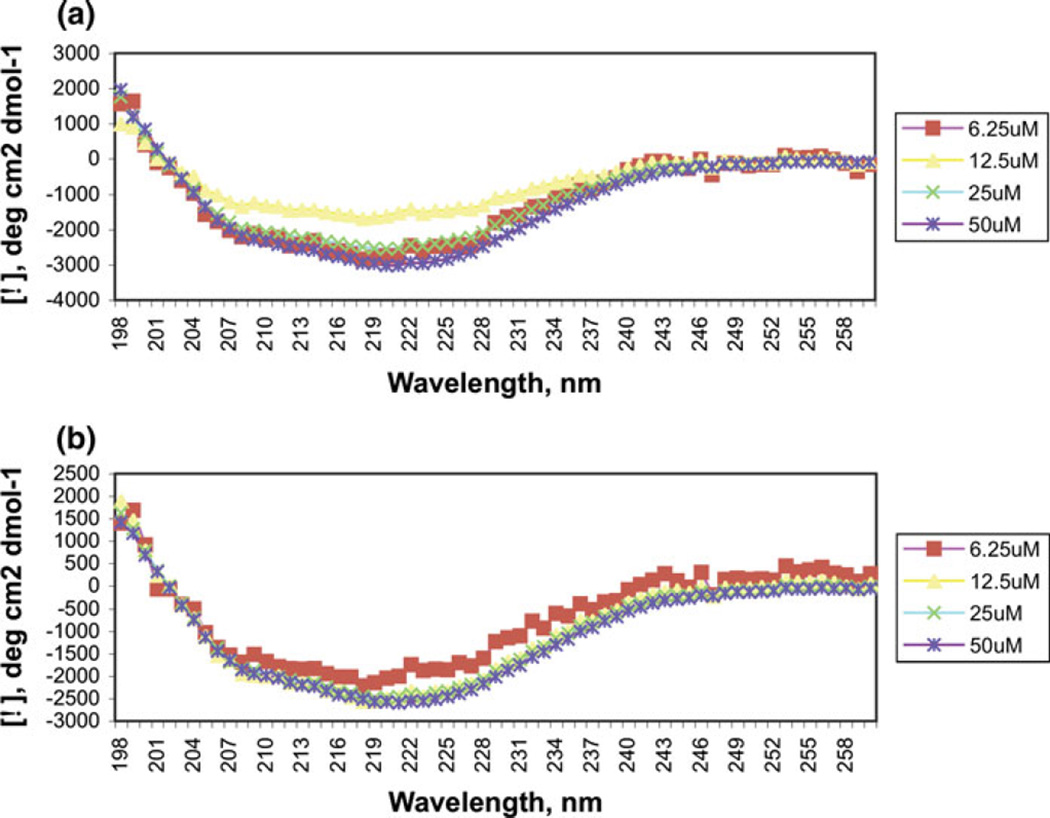
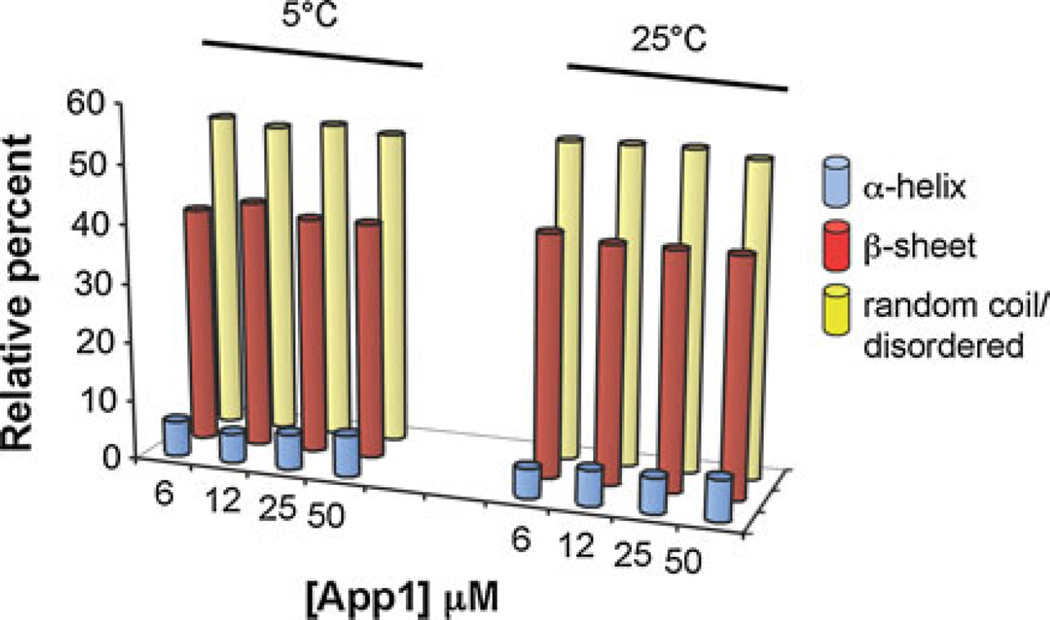
Circular dichroism spectroscopy was carried out to provide a basic characterization of the overall secondary structure. At 5 and 25°C, and at concentrations ranging from 6 to 50 µM, the appearance of a single minimum around 220 nm suggests rApp1 contains little or no α-helix and is predominantly in the β-strand conformation. (Fig. 5a, b). CONTINLL [5] analysis of the CD spectra estimates just over half of rApp1 to consist of random coil, a little less than half to be β-strand, and a very small proportion to be α-helix (Fig. 6). This was surprising considering secondary structure prediction algorithms (JPRED, PSIPRED) consistently predict App1 to consist mainly of α-helices. However, if the aggregated state of rApp1 forms fibrils, then the CD spectrum would be expected to be similar to that observed.
Fig. 5.
Circular dichroism spectra of rApp1 in PBS pH 7.6 at a 5°C and b 25°C showing the mean residue molar ellipticities plotted as a function of concentration. The spectra do not change over increasing concentration or temperature
Fig. 6.
CONTINLL prediction of secondary structure of App1 in PBS pH 7.6, showing predominantly random coil and b-strand with very little a-helix
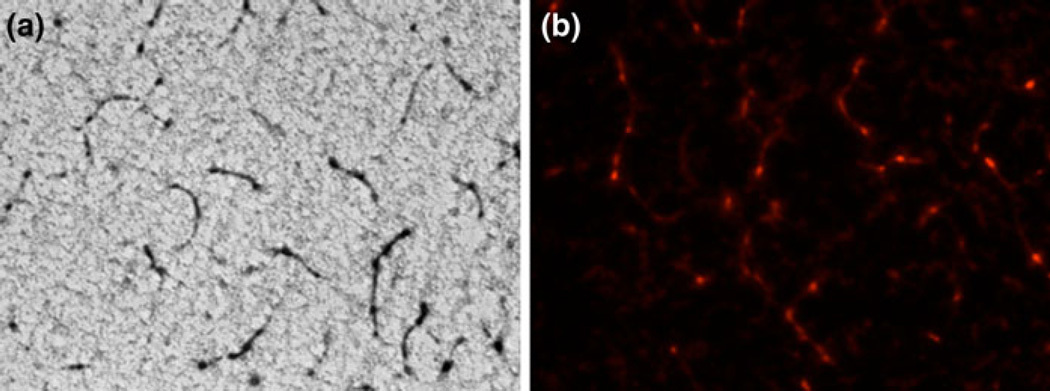
To confirm the presence of fibrils, we carried out fluorescence microscopy studies of rApp1 stained with Congo Red. Polarized light microscopy is typically used to detect amyloid fibrils via a yellow–green birefringence but recent advances in microscopic methods have revealed that the core of amyloid deposits do not show birefringence after staining with Congo Red [10]. This was indeed the case with rApp1, most likely due to the very low concentrations of fibrils present. However, rhodamine fluorescence is also widely used, as amyloid stained with Congo Red exhibits a pink–red fluorescence when illuminated with 546 nm (green) wavelength light. Brightfield microscopy (Fig. 7a) and fluorescence microscopy (Fig. 7b) were both carried out and showed the presence of fibrils within the rApp1 protein sample. Control proteins phosphoglucose isomerase from Methanosarcina (mPGI) and bovine serum albumin did not show the presence of such fibrils, nor did Congo Red alone.
Fig. 7.
a Congo Red-stained App1 viewed with brightfield microscopy at 40×. b Congo Red-stained App1 viewed with fluorescence microscopy 40× showing the presence of fibrils
In contrast to the general perception of amyloids as detrimental to the host due to its original identification in human disease and tissue damage, recent studies have identified functional roles for amyloid fibers in bacteria, fungi, insects, invertebrates, and humans [11]. By virtue of its amyloid characteristics, we can hypothesize that additional functions of App1 may exist. Several amyloid-based prions in the yeast Saccharomyces cerevisiae (e.g., the protein Sup35p) have been shown to facilitate information transfer [11], and a homologous hypothetical protein in C. neoformans var. grubii can be identified by BLASTX.
Another role may be in the biosynthesis of the pigment melanin, which is known to interfere with numerous host defense mechanisms. Studies have shown that melanized C. neoformans cells are less susceptible to the toxic effects of microbicidal peptides than non-melanized cells [12]. In addition, melanization protects C. neoformans against injury secondary to nitrogen- or oxygen-derived radical attack [13, 14]. In humans, amyloid composed of the protein Pmel17 is important in the biosynthesis of melanin. Querying the Cryptococcus genome with Pmel17 (BLASTX) identified a hypothetical gene with cyclin-dependent kinase homology.
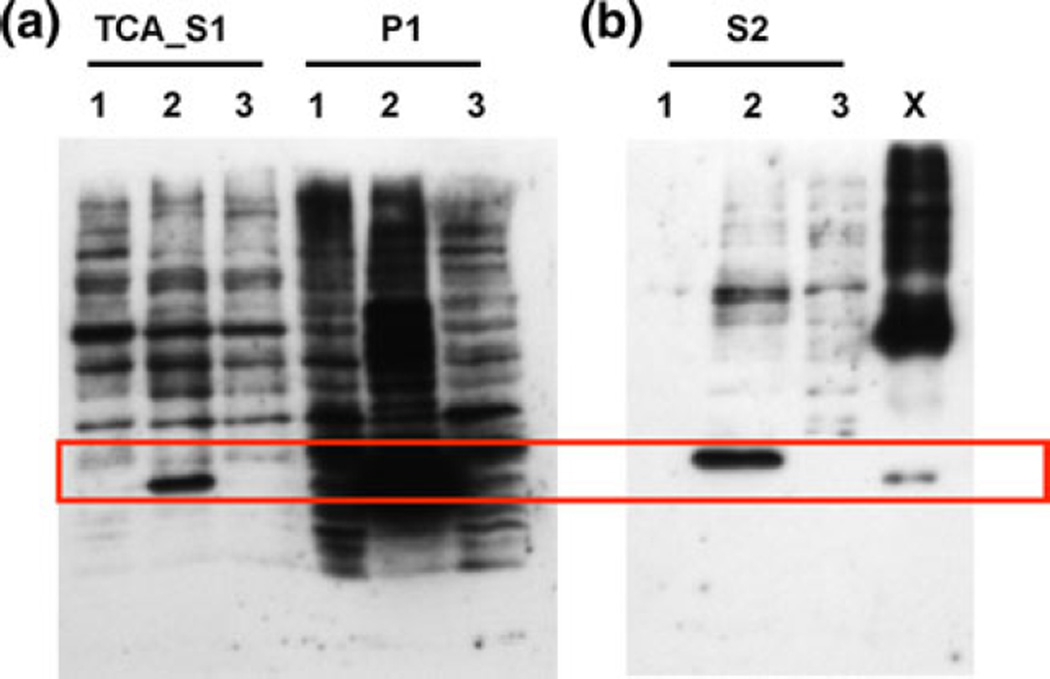
Since the rApp1 produced in E. coli appears to form fibrils, we decided to examine alternate approaches to over-expressing the recombinant protein. We first chose the InsectSelect System (Invitrogen) that allows constitutive stable or transient expression of proteins in insect cell lines. A single expression vector pIZ/V5-His was utilized to express the App1 gene, and it was found that soluble protein could be produced in this manner (Fig. 8) following trichloroacetic acid precipitation of the supernatant (TCA_S1). Cell lysate (S2) also showed the presence of expressed App1 with the majority still being in the cell pellet. However, the insect cell line yielded low-titer expression (1 µg/ml) of soluble rApp1 (TCA_S1).
Fig. 8.
Western blot from 12% SDS–PAGE of TCA-precipitated supernatant (TCA-S1), cell pellet (P1) and cell lysate (S2) obtained following treatment of High Five TM cells with either 1 construct alone 2 construct and Cellfectin® and 3 Cellfectin® alone for 3 days. X rApp1 control. Secreted protein is observed in TCA-precipitated supernatant from cells treated with construct and Cellfectin®, and cell lysate of the same treatment
We then explored the use of lentiviral systems (Fig. 9). After first ensuring that the virus did not alter cell viability (data not shown), we used flow cytometry to confirm that the virus particles had been transduced into the different cells, i.e., Raji and MH-S. Raji cells are lymphoblastoid cells derived from a Burkitt’s lymphoma, and MH-S are an alveolar macrophage cell line. These cell types were chosen on the basis that we have previously shown App1 binds to complement receptor (CR) 2, and CR2 serves as a receptor for Epstein–Barr virus (EBV) which is responsible for Burkitt’s lymphoma and stimulates cellular proliferation [1]. Cells positive for App1 were sorted and used for western blotting. It was observed for both Raji cells (Fig. 9c) and MH-S cells (data not shown) that a lentiviral vector carrying the App1 gene was able to induce the expression of App1 in different cells in vitro. However, the protein was found only in cell lysates. Thus, the lentiviral system did not yield soluble rApp1 in the supernatant.
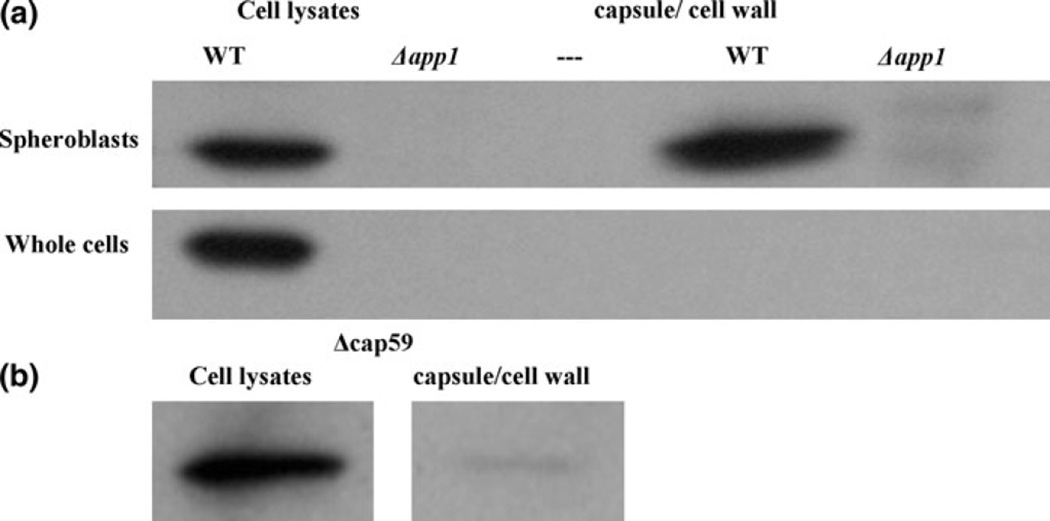
We next aimed to determine the subcellular localization of App1 (Fig. 10). Following spheroplasting of WT and Δapp1 cells and ultracentrifugation, it was observed that App1 is present in the cell lysates as expected (Fig. 10a) and also in the cellular components that were released in the medium following spheroplasting and ultracentrifugation. As a control, cells were not incubated with lysing enzyme but otherwise underwent the same protocol to ensure that any proteins found in the ultracentrifuged supernatant following spheroplasting were indeed components released from the removal of the cell wall and capsule. In the control, non-spheroplasted whole cells, App1 is seen in the cell lysates but not in the supernatant, ultracentrifuged portion. These results suggest thatApp1 is located in the capsule and/or cell wall of C. neoformans.
Fig. 10.
App1 is localized in the cell wall and possibly the capsule. a By spheroplasting cells, App1 was found to be in the capsule/cell wall portion of the yeast cell. b Next, an acapsular mutant was spheroplasted and App1 was also found in the cellular portion released after spheroplasting, suggesting it is in the cell wall. This experiment was repeated twice
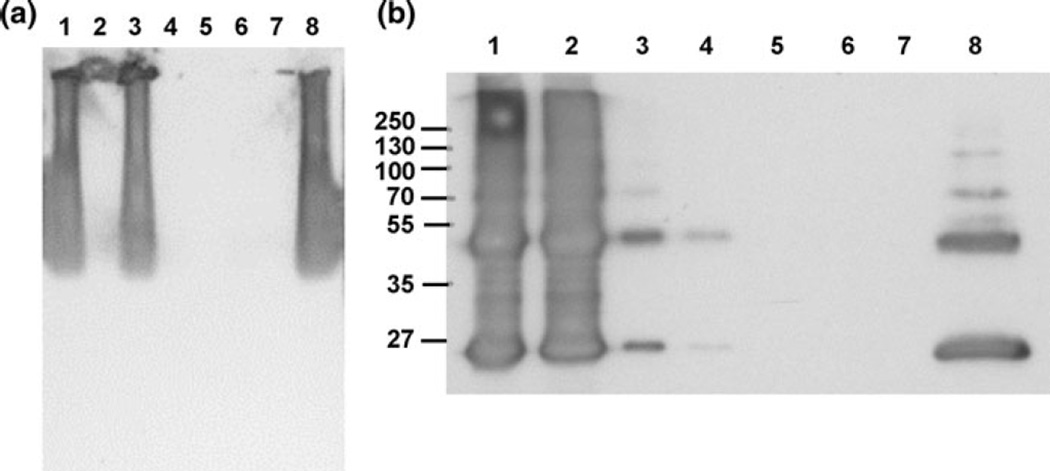
In order to further narrow down the cellular location of App1, an acapsular mutant was spheroplasted using the same protocol. Following spheroplasting of Δcap59 cells (Fig. 10b), App1 is seen in the cell lysates and also in the supernatant containing the released components of the acapsular cells following spheroplasting. Since App1 is present in this portion, we can conclude that App1 is located in the cell wall. We also predict that App1 is in the capsule as well, due to the difference in quantity of App1 in the released portion of WT cells (capsule and cell wall) compared with the released portion of acapsular cells (cell wall only). However, it is unlikely that App1 is binding directly to glucuronoxylomannan (GXM), the major component of the polysaccharide capsule, as results of both a pull-down assay (Fig. 11a) and co-immunoprecipitation (Fig. 11b) show that rApp1 does not bind to GXM. In the case of the pull-down assay, where His-tagged rApp1 was bound to an immobilized cobalt chelate resin, and GXM added as “prey” protein, a Western blot (Fig. 11a) shows that GXM elutes in the flow-through and no binding takes place. Similarly, during the co-immunoprecipitation, where monoclonal anti-GXM18b7 is bound to the agarose beads, and both GXM and rApp1 added, Western blot (Fig. 11b) once again shows rApp1 eluting in the flow-through. Thus, while App1 is localized in the cell wall and presumably in the capsule as well, it does not bind GXM but may bind other cell wall or capsular components. The fact that App1 is located in the cell wall and displays amyloid characteristics suggests that it may form a protective coating on the cell wall that allows C. neoformans to evade the host immune system [15], consistent with previous findings [1].
Fig. 11.
a Western blot of the results of the pull-down assay, showing that GXM is washed out in the flow-through and is not retained on the resin. Lane 1–3 flow-through; lane 1 resin control (+GXM), lane 2 bait control (−GXM), lane 3 sample (+GXM), Lane 4–6 eluate; lane 4 resin control, lane 5 bait control, lane 6 sample, lane 7 blank, lane 8 positive control (GXM 1 µg/µl, 15 µg loaded). b Western blot of co-IP showing that App1 elutes in the flow-through (FT) and is not bound to GXM. Lane 1–4 flow-through; lane 1 FT (negative control), lane 2 FT (sample), lane 3 FT after conditioning buffer for negative control, lane 4 FT for sample after conditioning buffer; lane 5 eluate (negative control), lane 6 eluate (sample), lane 7 blank, lane 8 App1 positive control 10 ng
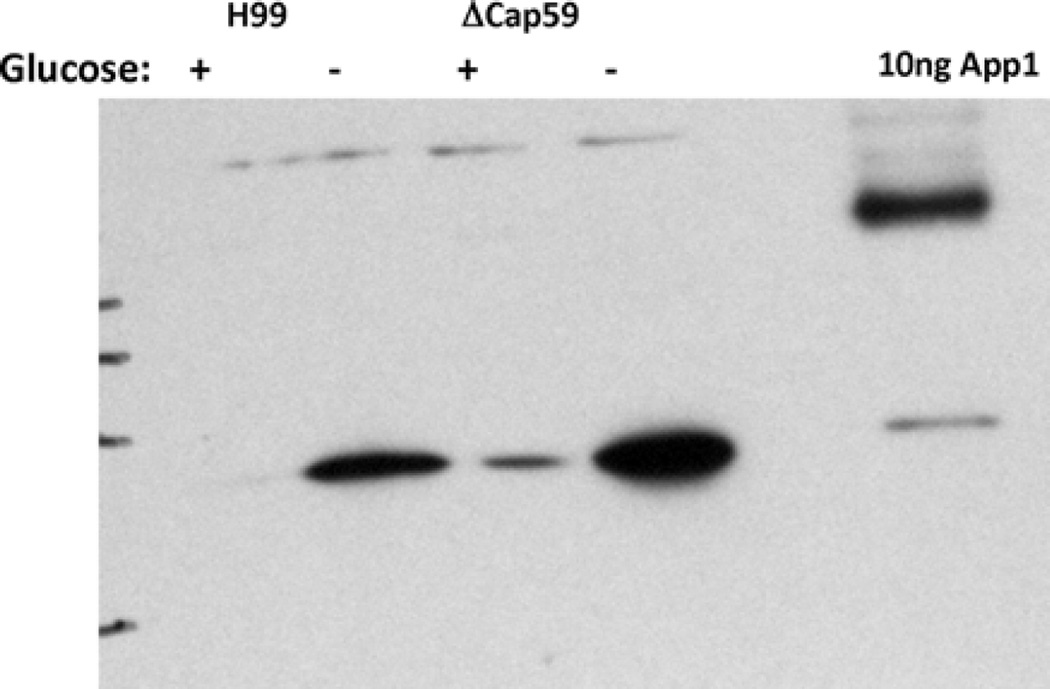
Finally, since we have previously shown that App1 expression is regulated by environmental glucose levels [2], we were interested in examining its expression under conditions of glucose starvation and in the absence of capsule. As shown in Fig. 12, it can be seen that App1 expression is significantly and similarly upregulated during glucose starvation in both WT and acapsular Δcap59 cells, suggesting that capsular material is not necessary for such upregulation.
Fig. 12.
App1 expression under ± glucose conditions
In conclusion, we have shown that, in vitro, rApp1 forms amyloid fibrils in the absence of β-mercaptoethanol. Hypothetical proteins found in C. neoformans are homologous to proteins in other organisms that are known to have beneficial roles and form amyloid, and thus, future work will focus on defining whether amyloid also has a beneficial function in C. neoformans. We have also shown that App1 is located in the cell wall and most likely also the capsule, although it does not bind directly to the major polysaccharide component of the capsule, thereby indicating that it may form a protective coat that assists the pathogen in evading the host immune system.
Acknowledgments
We are grateful to Dr Brendan Duggan for very helpful discussions and Drs Mark Kindy and Salim El-Amouri from the Department of Neuroscience at MUSC for their help with lentivirus expression. We also thank Rick Peppler from the MUSC Flow Cytometry & Cell Sorting (FCCS) Shared Resource Facility for carrying out the flow cytometry work. This work was supported in part by the Burroughs Wellcome Fund, the National Institutes of Health (grants AI56168, AI71142 and AI87541 to M. D. P.), and the Centers of Biomedical Research Excellence Program of the National Center for Research Resources (grant RR17677 project 2 to M. D. P.). Dr Maurizio Del Poeta is a Burroughs Wellcome New Investigator in the Pathogenesis of Infectious Diseases.
Contributor Information
Asfia Qureshi, Department of Biochemistry and Molecular Biology, Medical University of South Carolina, 173 Ashley Ave BSB 512A, Charleston, SC 29425, USA.
Virginia Williams, Department of Microbiology and Immunology, Medical University of South Carolina, Charleston, SC, USA.
Maurizio Del Poeta, Email: delpoeta@musc.edu, Department of Biochemistry and Molecular Biology, Medical University of South Carolina, 173 Ashley Ave BSB 512A, Charleston, SC 29425, USA; Department of Microbiology and Immunology, Medical University of South Carolina, Charleston, SC, USA; Department of Craniofacial Biology, Medical University of South Carolina, Charleston, SC, USA; Division of Infectious Diseases, Medical University of South Carolina, Charleston, SC, USA.
References
- 1.Stano P, Williams V, Villani M, Cymbalyuk ES, Qureshi A, Huang Y, et al. App1: an antiphagocytic protein that binds to complement receptors 3 and 2. J Immunol. 2009;182(1):84–91. doi: 10.4049/jimmunol.182.1.84. [DOI] [PMC free article] [PubMed] [Google Scholar]
- 2.Williams V, Del Poeta M. Role of glucose in the expression of Cryptococcus neoformans antiphagocytic protein 1, App1. Eukaryot Cell. 2011;10(3):293–301. doi: 10.1128/EC.00252-10. [DOI] [PMC free article] [PubMed] [Google Scholar]
- 3.Luberto C, Martinez-Marino B, Taraskiewicz D, Bolanos B, Chitano P, Toffaletti DL, et al. Identification of App1 as a regulator of phagocytosis and virulence of Cryptococcus neoformans. J Clin Invest. 2003;112(7):1080–1094. doi: 10.1172/JCI18309. [DOI] [PMC free article] [PubMed] [Google Scholar]
- 4.Sreerama N, Woody RW. Estimation of protein secondary structure from circular dichroism spectra: comparison of CONTIN, SELCON, and CDSSTR methods with an expanded reference set. Anal Biochem. 2000;287(2):252–260. doi: 10.1006/abio.2000.4880. [DOI] [PubMed] [Google Scholar]
- 5.Provencher SW, Glockner J. Estimation of globular protein secondary structure from circular dichroism. Biochemistry. 1981;20(1):33–37. doi: 10.1021/bi00504a006. [DOI] [PubMed] [Google Scholar]
- 6.Bondos SE, Bicknell A. Detection and prevention of protein aggregation before, during, and after purification. Anal Biochem. 2003;316(2):223–231. doi: 10.1016/s0003-2697(03)00059-9. [DOI] [PubMed] [Google Scholar]
- 7.Nilsson MR. Techniques to study amyloid fibril formation in vitro. Methods. 2004;34(1):151–160. doi: 10.1016/j.ymeth.2004.03.012. [DOI] [PubMed] [Google Scholar]
- 8.McFadden DC, De Jesus M, Casadevall A. The physical properties of the capsular polysaccharides from Cryptococcus neoformans suggest features for capsule construction. J Biol Chem. 2006;281(4):1868–1875. doi: 10.1074/jbc.M509465200. [DOI] [PubMed] [Google Scholar]
- 9.Gross M, Wilkins DK, Pitkeathly MC, Chung EW, Higham C, Clark A, et al. Formation of amyloid fibrils by peptides derived from the bacterial cold shock protein CspB. Protein Sci. 1999;8(6):1350–1357. doi: 10.1110/ps.8.6.1350. [DOI] [PMC free article] [PubMed] [Google Scholar]
- 10.Jin LW, Claborn KA, Kurimoto M, Geday MA, Maezawa I, Sohraby F, et al. Imaging linear birefringence and dichroism in cerebral amyloid pathologies. Proc Natl Acad Sci USA. 2003;100(26):15294–15298. doi: 10.1073/pnas.2534647100. [DOI] [PMC free article] [PubMed] [Google Scholar]
- 11.Fowler DM, Koulov AV, Balch WE, Kelly JW. Functional amyloid—from bacteria to humans. Trends Biochem Sci. 2007;32(5):217–224. doi: 10.1016/j.tibs.2007.03.003. [DOI] [PubMed] [Google Scholar]
- 12.Doering TL, Nosanchuk JD, Roberts WK, Casadevall A. Melanin as a potential cryptococcal defence against microbicidal proteins. Med Mycol. 1999;37(3):175–181. [PubMed] [Google Scholar]
- 13.Nosanchuk JD, Casadevall A. The contribution of melanin to microbial pathogenesis. Cell Microbiol. 2003;5(4):203–223. doi: 10.1046/j.1462-5814.2003.00268.x. [DOI] [PubMed] [Google Scholar]
- 14.Nosanchuk JD, Casadevall A. Impact of melanin on microbial virulence and clinical resistance to antimicrobial compounds. Antimicrob Agents Chemother. 2006;50(11):3519–3528. doi: 10.1128/AAC.00545-06. [DOI] [PMC free article] [PubMed] [Google Scholar]
- 15.Gebbink MF, Claessen D, Bouma B, Dijkhuizen L, Wosten HA. Amyloids—a functional coat for microorganisms. Nat Rev Microbiol. 2005;3(4):333–341. doi: 10.1038/nrmicro1127. [DOI] [PubMed] [Google Scholar]


