

Abstract
Background:
Dry eye patients suffer from all kinds of symptoms. Sometimes, the clinical signs evaluation does not disclose any obvious difference in routine examination; in vivo confocal microscopy (IVCM) is a powerful tool for ocular surface disease. This study aimed to clarify meibomian gland (MG) alterations in dry eye patients with different symptoms and to compare the findings using IVCM.
Methods:
A total of sixty patients were recruited, all subjected to Ocular Surface Disease Index (OSDI) and Salisbury Eye Evaluation Questionnaire (SEEQ), and questionnaires for the assessment of dry eye symptoms before clinical sign examinations were given to the patients. Finally, IVCM was applied to observe MG's structure. Statistical analysis was performed using the t-test, Mann-Whitney U-test and Spearman correlation analysis. The differences were statistically significant when P < 0.05.
Results:
In the severe symptom group, OSDI and SEEQ scores were significantly higher (P < 0.05) compared with the mild symptoms group. All other clinical sign examinations had no statistical difference in the two groups (P > 0.05). However, all the IVCM-observed data showed that patients with severe symptoms had more significant fibrosis in MG (acinar unit area 691.87 ± 182.01 μm2 for the severe, 992.17 ± 170.84 μm2 for the mild; P < 0.05) and severer decrease in the size of MG acinar units than those observed in patients with mild symptoms (MG acinar unit density [MGAUD] 70.08 ± 18.78 glands/mm2, MG acinar unit longest diameter [MGALD] 51.50 ± 15.51 μm, MG acinar unit shortest diameter [MGASD] 20.30 ± 11.85 μm for the severe, MGAUD 89.53 ± 39.88 glands/mm2, MGALD 81.57 ± 21.14 μm, MGASD 42.37 ± 14.55 μm for the mild; P < 0.05). Dry eye symptoms were negatively correlated with MG confocal microscopic parameters and positively correlated with conjunctival inflammatory cells and Langerhans cells (P < 0.05).
Conclusions:
IVCM application provides a strong support to differentiate dry eye patients with different symptoms: meibomian gland dysfunction (MGD) plays a pivotal role in dry eye aggravation, and using IVCM to observe MG fibrosis, changes in size and density of MG as well as status of inflammation cells can help not only correctly diagnose the type and severity of dry eye, but also possibly prognosticate in routine eye examination in the occurrence of MGD.
Keywords: Confocal Microscopy, Dry Eye, Meibomian Gland
Introduction
Dry eye is one of the most common disorders of the eye. It is also one of the most frequently encountered ocular diseases in the clinic. The International Dry Eye Workshop (2007) defined dry eye as a “multifactorial disease of the tears and ocular surface that results in symptoms of discomfort, visual disturbance, and tear film instability with potential damage to the ocular surface.” It is accompanied by increased osmolarity of the tear film and inflammation of the ocular surface.[1] Many physiological conditions, such as meibomian gland dysfunction (MGD), lacrimal gland insufficiency, impairment of neuronal innervation, and even environmental stress can lead to dry eye disease with diverse clinical symptoms.[1] The lipids secreted by the meibomian gland (MG), which constitute the outer layer of the tear film, act as an essential barrier to reducing evaporation of the tear film, facilitating lubrication of the ocular surface, and providing a smooth optical surface.[2] As many previous studies have reported,[3,4] the MGD causes excessive tear evaporation, resulting in an increase in the ocular surface friction and damage to the epithelial cells, thereby causing various kinds of dry eye symptoms with prevalence to be 33% in patients younger than 30 years and 71.7% in individuals 60 years or older.[5] However, there has been no report thus far investigating MG alterations and their impact on dry eye patients with different symptoms.
The common dry eye ocular surface epithelial histology and animal model studies uncover, at the cellular level, the consequence of dry eye disease or pathophysiological changes in dry eye development.[1] Unfortunately, it is not feasible for clinical diagnosis. On the other hand, many patients are evaluated with regular assessment as having clinically similar severity, with some patients suffering more than others. This calls for more powerful in vivo diagnostic method to provide further information for more efficient and accurate treatment.
In vivo confocal microscopy (IVCM) is a novel, noninvasive, high-resolution tool that enables in vivo analysis of the MG to provide insight into its structure and any structural changes under normal and pathologic conditions,[6,7,8,9,10,11] of which many are not visible by slit-lamp examination. In this study, we separated those patients with severe dry eye symptoms from those with mild symptoms, evaluated by a questionnaire of Ocular Surface Disease Index (OSDI) and Salisbury Eye Evaluation Questionnaire (SEEQ), the clinical signs of dry eye, and the assessment of MG status and function observed by regular methods combined with IVCM, aiming to explore the relationship between dry eye with different symptoms and MG structural alteration.
Methods
Patients and examination
A total of sixty patients with dry eye were recruited from among the outpatients in the Xiamen Eye Center of Xiamen University for this clinical study based on the following diagnostic criteria of aqueous tear deficiency: (1) presence of symptoms of dry eye; (2) abnormality of the tear production as determined by the Schirmer test (<5 mm after 5 min); (3) presence of tear film instability (<5 s); and (4) positive ocular surface Rose Bengal and fluorescein vital staining. The study was in compliance with the Tenets of the Declaration of Helsinki. Written informed consent from all patients and approval from the Ethics Committee were obtained.
None of the dry eye patients had a history of Sjögren's syndrome, Stevens-Johnson syndrome, and chemical, thermal, and radiation injuries. They had neither undergone any ocular surgery nor procedure that would create an ocular surface problem. Patients in this study also did not have a history of systemic drug or use of contact lens. Each patient completed OSDI and SEEQ questionnaires for the assessment of dry eye symptoms and, on that basis, the patients were further divided by the median of SEEQ, in accordance with the symptoms, into two groups: the severe symptom group and the mild symptom group. Thirty right eyes from the severe symptom group (13 men and 17 women; mean age, 38.3 ± 12.5 years; range, 29–67 years) and 30 right eyes from the mild symptom group (11 men and 19 women; mean age, 37.7 ± 11.9 years; range, 30–65 years) were examined in the study. There was no statistical significance attributed to the symptom due to patients’ age and gender.
All examinations were completed on a separate day and evaluated in the same darkened room by the same ophthalmologist.
Only data from the right eyes were analyzed by a researcher who was masked to determine as to which data belonged to which patients, according to the protocol of the current study.
Symptom assessment and dry eye clinical sign
Dry eye symptoms were evaluated by OSDI and SEEQ as described.[12,13] Dry eye clinical signs were evaluated with the following tests:
Conjunctival congestion assessment: Adopting CCLRU classification standard as the reference point, a photographic grading scale that has a generic (0–4) scale to score redness and roughness of the palpebral conjunctiva was used[14]
Tear film breakup time (BUT): After instillation of 2 µl of 1% fluorescein preservative-free solution in the conjunctival sac with a micropipette, the patients were instructed to blink several times for a few seconds and BUT was measured 3 times, and then the mean value of measurements was calculated. A tear film BUT value of <5 s was considered abnormal
Corneal fluorescein staining (FS): Corneal FS was graded from 0 to 12, a sum of the scores of corneal four quadrants, which were scored individually as 0 (no staining), 1 (mild staining with a few scattered dots of stains), 2 (moderate staining between 1 and 3), and 3 (severe staining with confluent stains or corneal filaments)[15]
Tear quantity evaluation: Standard Schirmer test І without topical anesthesia was performed. A value of <5 mm was considered abnormal.
Clinical meibomian gland assessment
To evaluate the morphological characteristics and function of MG, the following most commonly used parameters were measured: the Marx line (ML) score was analyzed and scored as described. After applying fluorescein dye solution to the eye, the ML score was calculated for the outer, middle, and inner thirds of the lower eyelid margin, and sored thereafter as: 0, entirely on the conjunctival side of the meibomian orifices (MOs); 1, part of the ML touches the MOs; 2, ML runs through all of the MOs; and 3, ML runs on the eyelid margin side of the MOs.[16]
Meibomian gland expression
A digital pressure was applied on the upper tarsus, and the degree of ease in expressing meibomian secretion (meibum) was evaluated semi-quantitatively as follows: Grade 0, clear meibum is easily expressed; Grade 1, cloudy meibum is expressed with a mild pressure; Grade 2, cloudy meibum is expressed with more than moderate pressure; and Grade 3, meibum cannot be expressed even with hard pressure.[17]
Meibum score
The expression of meibum was analyzed as described[18] and the meibum score was graded as follows: 0, clear meibum expressed easily; 1, cloudy meibum expressed gently; 2, cloudy meibum can be expressed with more than moderate pressure; and 3, no meibum can be expressed even with hard pressure.
Gland dropout degree visualized by meibography
MG morphology was observed by Keratograph 5 M (OCULUS, Wetzlar, Germany), a noncontact, placido ring-based corneal topographer,[8,19] and MG dropout degree was graded separately for both the upper and lower eyelids: Grade 0 (no loss MGs), Grade 1 (loss of 33% of the whole glands area), Grade 2 (loss of area between 33% and 67%), and Grade 3 (loss of 67% of the whole area).[20]
The meiboscore of each eye was calculated as the sum of the scores from both upper and lower eyelids, which made the total meiboscore per eye to a range of 0–6. In this study, meiboscore per eye was presented in each group for comparison.
In vivo laser confocal microscopic examination
IVCM was performed on all patients with a new generation confocal microscope, Heidelberg Retina Tomograph II-Rostock Cornea Module (Heidelberg Engineering GmbH, Dossenheim, Germany).
Clearly visible acinar units were all counted in a 400 µm × 400 µm frame, and the acinar density was described as the number of units per square millimeter. The MG acinar unit density (MGAUD), palpebral conjunctival inflammatory cell density (CICD), and periglandular inflammatory cell density (PICD) were measured with the internal software. The MG acinar unit area (MGAUA), MG acinar unit longest diameter (MGALD), and MG acinar unit shortest diameter (MGASD) were measured with the internal software and calculated in µm using the ImageJ software (Java software program developed by the National Institutes of Health; available: http://rsb.info.nih.gov/ij/). Three randomized, nonoverlapping, high-quality digital images of the nasal, middle, and temporal lower eyelid (total of 9 images/eyelid) were used for calculation of the IVCM parameters.[6]
Statistical analysis
All statistical analyses were performed by SPSS version 17.0 software (SPSS Inc., Chicago, IL, USA). The data is consistent with the normal distribution of the t test, the grade data does not conform to the normal distribution, were analysed Mann-Whitney U-test. When estimating the correlations between various factors, Spearman correlation analysis was used. The differences were regarded as statistically significant when P < 0.05.
Results
Dry eye symptom and clinical sign assessment
As the two groups of dry eye patients were grouped based on OSDI and SEEQ results, the score indeed presented statistically significant higher results in the severe symptom group than in the mild symptom group [P < 0.05, Table 1]. However, all the clinical sign assessments showed no statistical difference between the two groups [Table 1], suggesting clearly that the basic clinical sign assessment was not adequate to provide diagnostic support under such conditions and that further examination was required.
Table 1.
Comparison of dry eye symptom, clinical sign, and meibomian gland assessment in two groups (n = 30 in each)
| Parameters | Severe symptoms | Mild symptoms | Z | P |
|---|---|---|---|---|
| OSDI | 45.7 ± 13.2 | 27.6 ± 9.1 | 6.519 | <0.001 |
| SEEQ | 13.0 (12.0, 14.0) | 4.0 (3.0, 6.3) | −6.684 | <0.001 |
| PC | 0.0 (0.0, 1.0) | 0.0 (0.0, 1.0) | −0.523 | 0.601 |
| BC | 0.0 (0.0, 1.0) | 0.0 (0.0, 1.0) | −0.260 | 0.795 |
| BUT | 5.0 (3.0, 6.0) | 4.0 (2.7, 7.8) | −0.734 | 0.463 |
| FS | 1.0 (0.0, 2.5) | 1.5 (1.0, 4.3) | −0.889 | 0.374 |
| Schirmer I | 8.5 (3.8,13.0) | 4.5 (3.0,10.5) | −0.764 | 0.445 |
| ML score | 2.0 (1.0, 2.0) | 1.0 (1.0, 2.0) | −0.907 | 0.365 |
| MG expression | 2.0 (1.0, 2.0) | 2.0,(1.0, 2.0) | −0.629 | 0.529 |
| Meibum | 2.0 (1.0, 2.0) | 2.0 (1.0, 2.0) | −0.570 | 0.569 |
| MG dropout | 3.0 (2.0, 3.0) | 3.0 (2.0, 4.0) | −0.200 | 0.842 |
Data are presented as mean ± standard deviation or median (Interquartile range). OSDI: Ocular Surface Disease Index; SEEQ: Salisbury Eye Evaluation Questionnaire; PC: Palpebral conjunctiva; BC: Bulbar conjunctiva; BUT: Tear film breakup time; FS: Corneal fluorescein staining; ML: Marx line; MG: Meibomian gland.
Meibomian gland assessment
MGD is thought to be the leading cause of dry eye disease. We thus examined basic MGD in the patients by slit lamp, including: ML score, MG expression, and meibum score, as well as by meibography. All patients had obstructive meibomian gland disease, characterized by extensive MG dropout, unexpressible meibomian secretions, inflamed lid margins with thickening and debris, tear instability and ocular surface epithelial damage, and without seborrheic dermatitis. As shown in Table 1, there was no statistical difference of the basic MGD assessment and no MG dropout degree as visualized by meibography between the two groups of patients. All the results thus far clearly suggested that clinical examinations could not help understand the reasons giving rise to those severe symptoms. It was thus impossible to provide guidance on differential and effective treatment.
In vivo laser confocal microscopy
We applied IVCM to further detect any changes in the ocular surface, especially the MG, on a cellular level. As shown in Figure 1, clearly, there were acinar unit morphologic alterations in both groups of the dry eye patients; however, such alterations in the severe symptom group patients developed much worse than those in the mild symptom group. The fibrosis [Figure 1a and 1b] and loss of MG architecture followed by a decrease in MG acinar units’ size [Figures 1c and 2a] occurred significantly in the severe symptom group patients while all the alterations were marginal in the mild symptom group of patients [Figures 1d and 2b]. Further measurement and quantification disclosed more detailed changes in the severe symptom group patients in comparison with those in the mild symptom group patients. As shown in Figure 2, a significant decrease in MG acinar unit size in severe symptom group patients was attributed to decrease in both the unit density [MGAUD 70.08 ± 18.78 glands/mm2 for severe group, 89.53 ± 39.88 glands/mm2 for mild group; P < 0.05, Figure 2c] and the unit area [MGAUA 691.87 ± 182.01 µm2 for the severe group, 992.17 ± 170.84 µm2 for mild group; P < 0.0001; Figure 2d] as well as cellular size shrink, indicated as MGALD [51.50 ± 15.51 µm for severe group, 81.57 ± 21.14 µm for mild; P < 0.0001; [Figure 2e] and MGASD [20.30 ± 11.85 µm for severe group, 42.37 ± 14.55 µm for mild group; P < 0.0001; Figure 2f]. Compared with those in the mild group, the MGAUD decreased by 21.7%, while the MGALD and MGASD decreased by 36.9% and 52.1%, respectively, in the severe group. On the other hand, pronounced increase in cell number and extensive CICD and Langerhans cells was observed in the severe symptom group patients, compared with those in the mild symptom group patients [Figure 3a–3d]. The average CICD was significantly greater (1105.94 ± 628.01 cells/mm2) in the severe symptom group patients than in the mild symptom ones [654.36 ± 646.03 cells/mm2; P < 0.01; Figure 3e], in accordance with the Langerhans cells which are significantly greater (80.38 ± 62.70 cells/mm2) in the severe symptom group patients than in the mild symptom group patients [45.12 ± 74.32 cells/mm2; P < 0.05; Figure 3f]. The PICD showed no significant difference between the two groups.
Figure 1.

In vivo confocal microscopy images of meibomian gland morphology changes in the two groups of patients. a, b, and c are from severe symptom group patients. (a) Linear streaks of fibrosis of meibomian gland. (b) Loss of meibomian gland architecture with extensive fibrotic tissue surrounding the atrophic remnants of meibomian gland. White arrows (a and b) point to the areas of fibrosis in meibomian gland. (c) Loss of meibomian gland cell tire-like architecture (as shown in d). White arrows point to meibomian gland acinar units like a thread without normal epithelial cells. (d) Representative image of meibomian gland acinar units with extensive periglandular inflammatory cells in a mild symptom patient.
Figure 2.
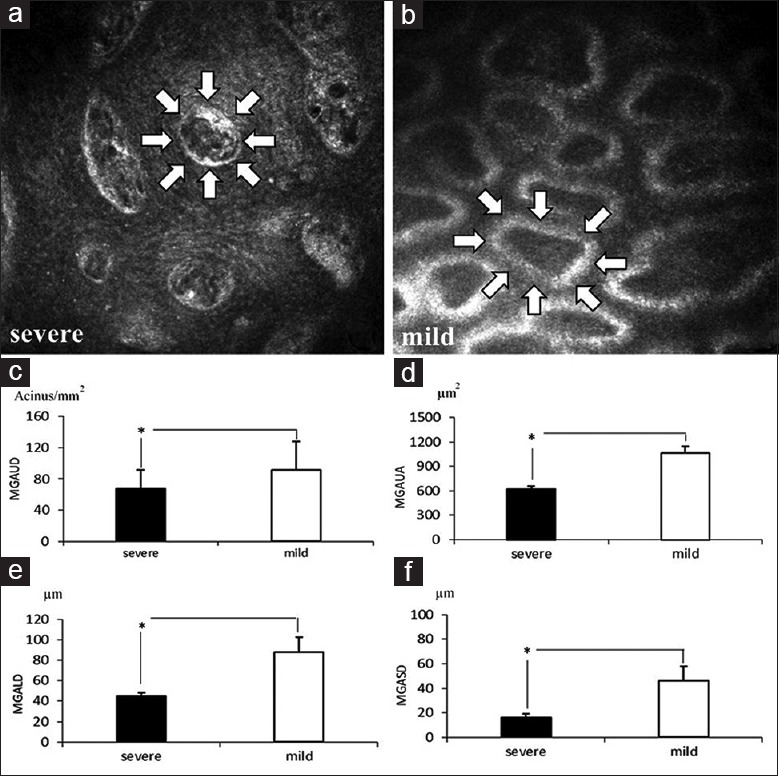
Comparison of confocal microscopy parameters, Meibomian gland acinar unit density and meibomian gland acinar unit area between the two groups of patients. Meibomian gland acinar units images observed in a representative severe symptom patient (a) and a mild symptom dry eye patient (b). The white arrows depict a typical acinar unit. Quantitative comparison of meibomian gland acinar unit density (c), meibomian gland acinar unit area (d), meibomian gland acinar unit longest diameter (e), and meibomian gland acinar unit shortest diameter (f) between the two groups of dry eye patients. *P < 0.05, t-test. MGAUD: Meibomian gland acinar unit density; MGALD:Meibomian gland acinar unit longest diameter; MGAUA :Meibomian gland acinar unit area; MGASD:Meibomian gland acinar unit shortest diameter.
Figure 3.
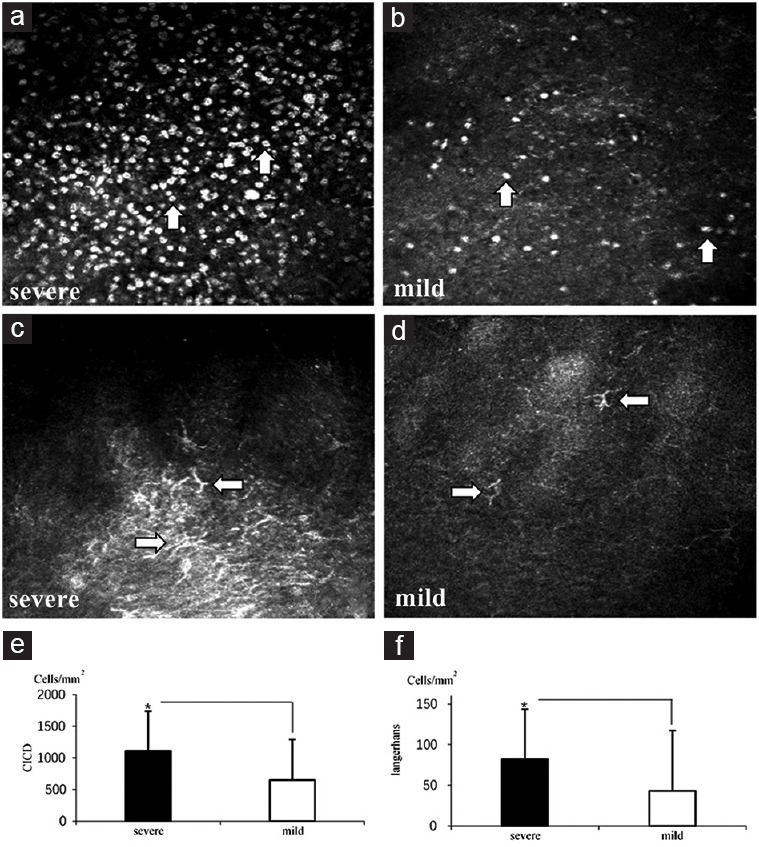
Alteration of conjunctival inflammatory cell density and Langerhans cell density in the two groups of patients. Representative images of conjunctival inflammatory cell (white arrows) density observed in a severe symptom patient (a) and a mild symptom patient (b). Representative images of Langerhans cells (white arrows) observed in a severe symptom patient (c) and a mild symptom patient (d). Quantitative plots indicating the changes of conjunctival inflammatory cell density (e) and Langerhans cell density (f) between the two symptom patients. *P < 0.05, t-test. CICD: Conjunctival inflammatory cell density.
Dry eye symptoms and meibomian gland acinar relationship
Finally, Spearman correlation analysis was calculated to reveal the relationship between the severe symptoms of dry eye patients and MG acinar unit structure alteration. Table 2 shows that the scores in the OSDI and SEEQ questionnaires were significantly correlated with MG confocal microscopic parameters (P < 0.05), and the four parameters were negatively correlated with dry eye symptoms (P < 0.05).
Table 2.
Relationship of OSDI and SEEQ scores and confocal microscope parameters
| Confocal microscope parameters | MGAUD | MGAUA | MGALD | MGASD | CICD | Langerhans |
|---|---|---|---|---|---|---|
| ro | −0.286 | −0.459 | −0.287 | −0.366 | 0.425 | 0.408 |
| rs | −0.349 | −0.713 | −0.657 | −0.704 | 0.440 | 0.490 |
ro: The rank correlation coefficient of OSDI and confocal microscope parameters (P<0.05); rs: The rank correlation coefficient of SEEQ and confocal microscope parameters (P<0.05). OSDI: Ocular Surface Disease Index; SEEQ: Salisbury Eye Evaluation Questionnaire; MGAUD: Meibomian gland acinar unit density; MGAUA: Meibomian gland acinar unit area; MGALD: Meibomian gland acinar unit longest diameter; MGASD: Meibomian gland acinar unit shortest diameter; CICD: Conjunctival inflammatory cell density.
Dry eye symptoms, palpebral conjunctival inflammatory cell, and Langerhans cell relationship
In addition to the MG, Spearman correlation analysis also showed that OSDI and SEEQ were positively correlated with CICD and Langerhans cells [P < 0.05, Table 2] and that the increase of CICD and Langerhans cells was concomitant, suggesting that with deterioration of the dry eye symptoms, both palpebral conjunctival inflammatory cell and Langerhans cell numbers increased accordingly.
Discussion
Dry eye affects approximately 60 million people worldwide, and MGD is likely the leading cause for ocular discomfort and abnormalities of the ocular surface.[21] The current clinical MGD assessment is effective to evaluate and differentiate patients with or without MGD symptom; however, it is apparently not adequate to diagnostically provide any support for those having severer MGD symptom, although support for prognosis was not mentioned. In this study, we applied IVCM to those patients, who were assessed with similar dry eye severity by the current routine clinical examination while some patients complained of more suffering than others and revealed that the severer symptom patients indeed had worse alteration of MG morphology as well as increased inflammation cells and Langerhans cells, demonstrating that using IVCM as a supplementary diagnostic tool is critical for patients, in that regular assessment cannot explain their symptoms.
The current methodology is well established to assess patients suffering from ocular discomfort and abnormalities of the ocular surface by monitoring an increase of TEROS and osmolarity of tears, damage of the ocular surface epithelium demonstrated by the increased vital staining scores, decrease in conjunctival goblet cell density, increased MG dropout, and decreased meibum expressibility. Using slit-lamp observation of the morphological changes in the lid margin, the current method is also used to evaluate meibomian glandular function and ocular surface status of the patients. However, when the assessment from both clinic sign and MG assessment confirmed the patients with dry eye disease, and yet it is not correlated with OSDI and SEEQ scores [Table 1], we fail to fathom the reason(s), thus to provide corresponding therapy if there were no more powerful diagnostic tools, such as in vivo microscopic image system.
In this study, using IVCM, we found that there was severe degree of fibrosis and atrophy of MG in the severe symptom group patients, while the mild symptom group patients only showed marginal alteration of MG [Figure 1]. Quantitative measurement of changes in MGAUD, MGAUA, MGALD, and MGASD between mild and severe groups of patients further demonstrated more significant decrease in size and cell density of MG in the severe group patients [Figure 2], suggesting that MG function became worse in the severe group patients. We thus believe that the reduced function of MG leads to a deterioration in the quantity and quality of meibum, which consequently results in increased tear film instability and ocular surface epithelial cell injury, and ultimately aggravates dry eye symptoms.[22]
Statistical analysis of the relationship between dry eye severity and MGD indicated that decrease of acinar unit density and diameter correlated well with OSDI and SEEQ scores, suggesting that these two can be considered as MGD indicators in diagnosis, and even in prognosis by using IVCM to evaluate MG disease, as reported earlier.[10] Recently, Korb and Blackie[23] have suggested that the confocal microcopy-supported MGD is the first approach that has the potential to revolutionize the timing of diagnosis and the choice of frontline therapy in most patients with dry eye, with the two parameters apparently lending support to it.
Noticeably, we also observed an increased number of inflammation cells and Langerhans cells [Figure 3], and the increase was correlated with the dry eye symptom severity [Table 2]. As both of the cell types are responding to foreign substance induced either by inflammatory or immunological responses, correlation of the dry eye symptom severity with the two types of cells suggests that it must be the inflammation that contributed to deterioration of dry eye symptoms and triggered an increase in the two types of cells in severe symptom group patients.
Due to equipment conditions, the study failed to test the MG lipid as well as the determination of inflammatory factors, which will be further researched in the next step.
In summary, our current research demonstrates that MGD plays a substantial role in dry eye aggravation, and that the application of IVCM in clinical eye examination for the status of MGs and alteration of MGAUD and MGALD as well as the status of inflammation cells will be essential in differentiating disease type, severity, and even in the prognosis of patients at a very early stage of MGD.
Financial support and sponsorship
This work was supported by a grant from the Public Welfare Fund of the Ministry of Health (No. 201302015).
Conflicts of interest
There are no conflicts of interest.
Footnotes
Edited by: Peng Lyu
References
- 1.The definition and classification of dry eye disease: Report of the definition and classification subcommittee of the International Dry Eye Workshop (2007) Ocul Surf. 2007;5:75–92. doi: 10.1016/s1542-0124(12)70081-2. [DOI] [PubMed] [Google Scholar]
- 2.Bron AJ, Tiffany JM, Gouveia SM, Yokoi N, Voon LW. Functional aspects of the tear film lipid layer. Exp Eye Res. 2004;78:347–60. doi: 10.1016/j.exer.2003.09.019. doi: 10.1016/j.exer.2003.09.019. [DOI] [PubMed] [Google Scholar]
- 3.Kobayashi A, Yokogawa H, Sugiyama K. In vivo laser confocal microscopy of Bowman's layer of the cornea. Ophthalmology. 2006;113:2203–8. doi: 10.1016/j.ophtha.2006.05.058. doi: 10.1016/j.ophtha.2006.05.058. [DOI] [PubMed] [Google Scholar]
- 4.Nichols KK, Foulks GN, Bron AJ, Glasgow BJ, Dogru M, Tsubota K, et al. The international workshop on meibomian gland dysfunction: Executive summary. Invest Ophthalmol Vis Sci. 2011;52:1922–9. doi: 10.1167/iovs.10-6997a. doi: 10.1167/iovs.10-6997a. [DOI] [PMC free article] [PubMed] [Google Scholar]
- 5.Stanek S. Meibomian gland status comparison between active duty personnel and U.S. veterans. Mil Med. 2000;165:591–3. [PubMed] [Google Scholar]
- 6.Ibrahim OM, Matsumoto Y, Dogru M, Adan ES, Wakamatsu TH, Shimazaki J, et al. In vivo confocal microscopy evaluation of meibomian gland dysfunction in atopic-keratoconjunctivitis patients. Ophthalmology. 2012;119:1961–8. doi: 10.1016/j.ophtha.2012.04.001. doi: 10.1016/j.ophtha.2012.04.001. [DOI] [PubMed] [Google Scholar]
- 7.Wu W, Cannon PS, Yan W, Tu Y, Selva D, Qu J. Effects of Merogel coverage on wound healing and ostial patency in endonasal endoscopic dacryocystorhinostomy for primary chronic dacryocystitis. Eye (Lond) 2011;25:746–53. doi: 10.1038/eye.2011.44. doi: 10.1038/eye.2011.44. [DOI] [PMC free article] [PubMed] [Google Scholar]
- 8.Srinivasan S, Menzies K, Sorbara L, Jones L. Infrared imaging of meibomian gland structure using a novel keratograph. Optom Vis Sci. 2012;89:788–94. doi: 10.1097/OPX.0b013e318253de93. doi: 10.1097/OPX.0b013e318253de93. [DOI] [PubMed] [Google Scholar]
- 9.Ibrahim OM, Matsumoto Y, Dogru M, Adan ES, Wakamatsu TH, Goto T, et al. The efficacy, sensitivity, and specificity of in vivo laser confocal microscopy in the diagnosis of meibomian gland dysfunction. Ophthalmology. 2010;117:665–72. doi: 10.1016/j.ophtha.2009.12.029. doi: 10.1016/j.ophtha.2009.12.029. [DOI] [PubMed] [Google Scholar]
- 10.Matsumoto Y, Sato EA, Ibrahim OM, Dogru M, Tsubota K. The application of in vivo laser confocal microscopy to the diagnosis and evaluation of meibomian gland dysfunction. Mol Vis. 2008;14:1263–71. [PMC free article] [PubMed] [Google Scholar]
- 11.Prabhasawat P, Tesavibul N, Mahawong W. A randomized double-masked study of 0.05% cyclosporine ophthalmic emulsion in the treatment of meibomian gland dysfunction. Cornea. 2012;31:1386–93. doi: 10.1097/ICO.0b013e31823cc098. doi: 10.1097/ICO.0b013e31823cc098. [DOI] [PubMed] [Google Scholar]
- 12.Schiffman RM, Christianson MD, Jacobsen G, Hirsch JD, Reis BL. Reliability and validity of the Ocular Surface Disease Index. Arch Ophthalmol. 2000;118:615–21. doi: 10.1001/archopht.118.5.615. doi: 10.1001/archopht.118.5.615. [DOI] [PubMed] [Google Scholar]
- 13.Schein OD, Tielsch JM, Munõz B, Bandeen-Roche K, West S. Relation between signs and symptoms of dry eye in the elderly. A population-based perspective. Ophthalmology. 1997;104:1395–401. doi: 10.1016/s0161-6420(97)30125-0. doi: 10.1016/S0161-6420(97)30125-0. [DOI] [PubMed] [Google Scholar]
- 14.MacKinven J, McGuinness CL, Pascal E, Woods RL. Clinical grading of the upper palpebral conjunctiva of non-contact lens wearers. Optom Vis Sci. 2001;78:13–8. doi: 10.1097/00006324-200101010-00009. doi: 10.1097/00006324-200101010-00009. [DOI] [PubMed] [Google Scholar]
- 15.Afonso AA, Monroy D, Stern ME, Feuer WJ, Tseng SC, Pflugfelder SC. Correlation of tear fluorescein clearance and Schirmer test scores with ocular irritation symptoms. Ophthalmology. 1999;106:803–10. doi: 10.1016/S0161-6420(99)90170-7. [DOI] [PubMed] [Google Scholar]
- 16.Yamaguchi M, Kutsuna M, Uno T, Zheng X, Kodama T, Ohashi Y. Marx line: Fluorescein staining line on the inner lid as indicator of meibomian gland function. Am J Ophthalmol. 2006;141:669–75. doi: 10.1016/j.ajo.2005.11.004. doi: 10.1016/j.ajo.2005.11.004. [DOI] [PubMed] [Google Scholar]
- 17.Shimazaki J, Goto E, Ono M, Shimmura S, Tsubota K. Meibomian gland dysfunction in patients with Sjögren syndrome. Ophthalmology. 1998;105:1485–8. doi: 10.1016/S0161-6420(98)98033-2. doi: 10.1016/S0161-6420(98)98033-2. [DOI] [PubMed] [Google Scholar]
- 18.Asbell PA, Stapleton FJ, Wickström K, Akpek EK, Aragona P, Dana R, et al. The international workshop on meibomian gland dysfunction: Report of the clinical trials subcommittee. Invest Ophthalmol Vis Sci. 2011;52:2065–85. doi: 10.1167/iovs.10-6997h. doi: 10.1167/iovs.10-6997f. [DOI] [PMC free article] [PubMed] [Google Scholar]
- 19.Hong J, Sun X, Wei A, Cui X, Li Y, Qian T, et al. Assessment of tear film stability in dry eye with a newly developed keratograph. Cornea. 2013;32:716–21. doi: 10.1097/ICO.0b013e3182714425. doi: 10.1097/ICO.0b013e3182714425. [DOI] [PubMed] [Google Scholar]
- 20.Arita R, Itoh K, Inoue K, Amano S. Noncontact infrared meibography to document age-related changes of the meibomian glands in a normal population. Ophthalmology. 2008;115:911–5. doi: 10.1016/j.ophtha.2007.06.031. doi: 10.1016/j.ophtha.2007.06.031. [DOI] [PubMed] [Google Scholar]
- 21.Knop E, Knop N, Brewitt H, Pleyer U, Rieck P, Seitz B, et al. Meibomian glands: Part III. Dysfunction – Argument for a discrete disease entity and as an important cause of dry eye. Ophthalmologe. 2009;106:966–79. doi: 10.1007/s00347-009-2043-9. doi: 10.1007/s00347-009-2043-9. [DOI] [PubMed] [Google Scholar]
- 22.Pult H, Nichols JJ. A review of meibography. Optom Vis Sci. 2012;89:E760–9. doi: 10.1097/OPX.0b013e3182512ac1. doi: 10.1097/OPX.0b013e3182512ac1. [DOI] [PubMed] [Google Scholar]
- 23.Korb DR, Blackie CA. “Dry eye” is the wrong diagnosis for millions. Optom Vis Sci. 2015;92:e350–4. doi: 10.1097/OPX.0000000000000676. doi: 10.1097/OPX.0000000000000676. [DOI] [PubMed] [Google Scholar]