

Abstract
Background
Higher rates of cardiovascular disease (CVD) and its risk factors are well documented among those with objective indicators of lower socioeconomic status (SES), such as income, education, and occupation. However, relatively little is known about the relationship of subjective SES to CVD risk, particularly within different racial groups.
Methods
Subjective SES and Framingham 10-year CVD risk profile were examined in 1,722 socioeconomically diverse Black and White adults enrolled in the Healthy Aging in Neighborhoods of Diversity across the Life Span (HANDLS) study. The sample had a mean age of 47.7 years, was 57% female, 56% African American, and 39% living in poverty.
Results
Subjective SES was associated with greater CVD risk after adjustment for poverty status, substance use, BMI, depression, antihypertensives, and co-morbidities (B=−.059, t[1,1711]=−2.44, P=.015). However, when the analysis was race-stratified, subjective SES was associated with CVD risk in Whites (B=−.074, F[1,787]=−2.01, P=.045), but not Blacks.
Conclusions
These results suggest that subjective SES may aid in predicting CVD risk in Whites, but not Blacks. It is important to note that these analyses were adjusted for poverty status, a potent indicator of objective SES. Thus, these findings further suggest that for Whites, subjective SES may influence CVD risk beyond that associated with objective SES. These findings highlight the potential importance of patients’ subjective SES in CVD risk detection. (Ethn Dis. 2014;24[2]:xxx–yyy)
Keywords: Health Disparities, Socioeconomic Status, Cardiovascular Disease Risk
Introduction
Cardiovascular disease (CVD) is the largest contributor to all-cause mortality in the United States and accounts for over 30% of the excess mortality experienced by Blacks.1 Higher rates of CVD and its risk factors are also well documented among those with objective indicators of lower socioeconomic status (SES) such as income, education, and occupation.2 Elucidating the relations among SES, race, and CVD risk is an important step in understanding health disparities that are prevalent in CVD and may lead to development of targeted interventions for addressing these disparities. In that regard, relatively little is known about the association of subjective SES to CVD risk.
Subjective SES is defined by Jackman et al as “the individual’s perception of his own position in the social hierarchy.”3. Although assessment of subjective SES was once quite complicated, involving a comprehensive social network analysis in addition to measurement of objective SES indicators,3 the MacArthur Research Network on SES and Health has recently developed a simple tool to assess subjective SES—the MacArthur Scale of Subjective Social Status4 (Figure 1). Cognitive interviewing performed with 60 participants in the CARDIA study while they were completing the MacArthur Scale showed that to determine their place on the social ladder, participants considered their material wealth (90%), occupation (72%), education (62%), spirituality or ethical values (25%), social responsibility and altruism (20%), and health (20%).5 In a recent study, subjective SES, assessed using the MacArthur Scale, was shown to be a better predictor of CVD than objective SES in a sample of White women.6 Subjective SES ratings from the MacArthur Scale are also associated with greater risk for a variety of other health outcomes, including all-cause mortality,7 angina,8 and diabetes.8 Therefore the predictive value of subjective SES in CVD risk above and beyond objective SES is important to assess.
Figure 1.
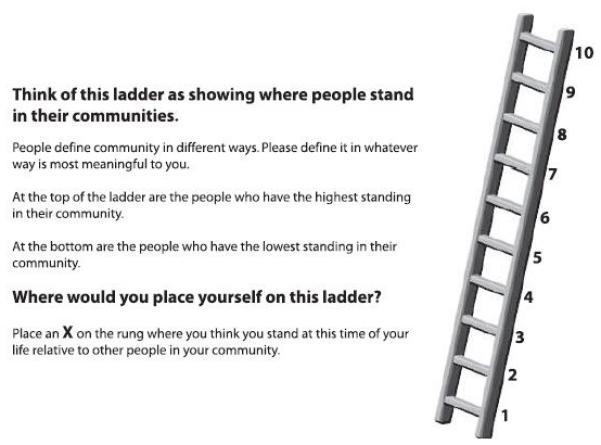
The MacArthur community ladder, adapted from the MacArthur Scale of Subjective Social Status (retrieved from macses.ucsf.edu), which was used to assess subjective SES in study participants.
The Framingham Cardiovascular Risk Equation is a commonly used predictor of CVD.9 Although the equation has been adapted to predict subtypes of CVD (eg, stroke), the general risk equation used herein may have the greatest clinical utility since all measures necessary for calculation are routinely measured in standard physical examinations.10 The relations between Framingham Cardiovascular Risk Equation scores and objective measures of SES are well-documented,7 but to our knowledge their relation to subjective SES has not been examined. Additionally, although the Framingham Cardiovascular Risk Equation has been validated in both Blacks and Whites,10 racial differences in risk scores are not fully understood, particularly within the context of SES.11 Determining how race and SES conjointly influence Framingham scores is imperative considering the ubiquitous use of this measure, both clinically and in research.
The aims of our study were: 1) to examine relation of subjective SES to 10-year CVD risk, and 2) to determine whether associations of subjective SES and CVD risk vary by racial group.
Methods
Participants
Participants (n=2,802) enrolled in the Healthy Aging in Neighborhoods of Diversity across the Life Span (HANDLS) study.12 The HANDLS study is an interdisciplinary, community-based, longitudinal, epidemiologic study examining the influences and interaction of race and socioeconomic status on the development of age-associated health disparities in a socioeconomically diverse cohort of Blacks and Whites initially aged 30-64 residing in the city of Baltimore.12 The HANDLS participants were recruited in 2004-2009 as a fixed cohort by household screenings from an area probability sample in selected neighborhoods (contiguous census tracts) that were likely to yield representative distributions of Baltimore City with sufficient individuals to fill the sampling design based on 2000 census data. The final cohort consisted of 3,720 participants of whom 2,198 self-identified as Black (59%) and 1,522 self-identified as White (41%). Socioeconomic status was operationalized by using 125% of the poverty status definition in which household incomes are indexed to household sizes. The final cohort consisted of 1,535 individuals below the poverty delimiter (41%) and 2,185 individuals at or above the poverty delimiter (59%). The distribution of race and poverty status mirrors the distribution of Blacks and Whites by poverty status in Baltimore City.
Comprehensive medical histories, collection biomaterials for clinical analysis and storage, and physical examinations were performed in mobile research vehicles on 2822 participants (76%). Clinical laboratory assessments were conducted by Quest Diagnostics Inc, The Nichols Institute, Chantilly, Virginia. Although the study uses a longitudinal design, only cross-sectional data from the first wave (collected between 2004-2009) were available at the time of analysis. After excluding participants with histories of CVD, 1,722 socioeconomically diverse Black and White adults were included in the present analyses (Table 1). This study was approved by the Medstar Institutional Review Board and every participant gave written informed consent.
Table 1.
Descriptive statistics and t-tests of significant differences for sample characteristics and variables of interest.
| Measure | White (n=798) |
Black (n=924) |
Total (n=1,722) |
|---|---|---|---|
| Age, mean (SD) | 47.65 (9.26) | 47.12 (9.23) | 47.37 (9.25) |
| % Female | 56.8% | 56.1% | 56.4% |
| % Below Povertya | 30.5% | 40.6% | 35.9% |
| Educationa, mean (SD) | 12.82 (3.58) | 12.47 (2.57) | 12.63 (3.07) |
| Framingham Riska, mean (SD) | 4.35 (6.06) | 3.74 (5.02) | 4.02 (5.53) |
| Subjective SES, mean (SD) | 4.21 (2.00) | 4.51 (2.08) | 4.37 (2.05) |
Significant differences by race (p<.001)
Measurement
Cardiovascular disease risk was calculated using the Framingham 10-year CVD risk equation.9 The risk score is based on sex, age, total cholesterol, high density lipoprotein, hypertensive status, diabetes status, and smoking status, all of which were assessed by either clinical laboratory assessments, medical history, or physical examination. Symptoms of depression were assessed by the CES-D.13 Participants were instructed to fast overnight after which blood samples were drawn from an antecubital vein in participants who had fasted at least 8 hours prior to venipuncture. Serum levels of total cholesterol (TSC), low density lipoprotein cholesterol (LDL-C), high density lipoprotein cholesterol (HDL-C), triglycerides (TG), and glucose (GLU) were then assessed at Quest Diagnostics (Chantilly, VA) using standard laboratory methods. All laboratory testing measures met or exceeded the standards set by CLIA 1988, the U.S. Centers for Disease Control, and the Prevention-National Heart, Lung and Blood Institute Lipid Standardization Program guidelines with total allowable error (random and systemic) on a single result ranging from ≤8.9% for TSC to ≤15% for TG.
Systolic blood pressure (SBP) and diastolic blood pressure (DBP) were measured after participants had rested in a seated position for 5 minutes with their feet flat on the floor, legs uncrossed, and measurement arm at a 90-degree angle with the palm facing up. The brachial artery auscultation method was used to measure both SBP and DBP with an aneroid manometer, a stethoscope, and an inflatable cuff; SBP and DBP were measured once in each arm and these measurements were averaged for the analysis.
Subjective SES was assessed using the MacArthur Scale of Subjective Social Status4 by self-ratings compared with participants’ communities (Figure 1). There were no missing data for this measure. Cundiff et al14 recently published psychometric properties for the MacArthur Scale. Convergent and discriminant validity correlations showed that the MacArthur Scale measures were more closely associated with each other than objective SES (income), as well as other psychosocial measures, including optimism, neuroticism, depression, and marital adjustment (P<.001). However, there was one exception—in older men there was a stronger association between the country SES comparison and income than with the community SES comparison. Additionally, the MacArthur Scale was shown to have incremental utility above and beyond objective SES in predicting psychosocial risk and resilience factors (P<.05).
Analysis
First, independent sample t-tests were performed on sample characteristics and variables of interest to assess race differences. Second, a linear regression was performed to assess for the associations of subjective SES on 10-year CVD risk, adjusting for poverty status, prescription drug use, tobacco and illicit drug use, alcohol use, body mass index, symptoms of depression, antihypertensive use, cancer as well as neurological, metabolic, and inflammatory diseases. Third, regression analyses were performed in race-stratified samples to assess whether the association of subjective SES with 10-year CVD risk varied by racial group. Additionally, correlations between subjective and objective measures of SES were examined. Analyses were performed using IBM SPSS Statistics, Version 20.
Results
T-tests showed racial differences in CVD Risk (Table 1), and Levine’s Test for Equality of Variances showed inequality of variances between Blacks and Whites (P<.001) for the Framingham, with Blacks showing lower risk and less variation of risk. There were no racial differences or unequal variances in subjective SES. The correlation between subjective and objective SES varied by race. In Whites, subjective SES was associated with household income (r=.32, P<.001), poverty status (r= −.23, P<.001), and education (r= −.33, P<.001); subjective SES in Blacks was associated only with income (r=.13, P<.001) and education (r=.11, P<.01). (data not shown)
The overall model was significant in the full sample (R2=.031, F(1, 1721)=6.05, P<.001). Lower subjective SES was associated with greater CVD risk after adjusting for covariates (B=−.059, t(1,1711)=−2.44, P=.015) (Table 2). An interaction between race and subjective SES was tested initially, but was not significant. However, we proceeded with examining the relations in a race-stratified model due to assumed differences in confounding variables, following the approach proposed by Jones in 2001.15 When the analyses were race-stratified, lower subjective SES was associated significantly with greater CVD risk for Whites (B=−.074, F(1,787)=−2.01, P=.045), but not for Blacks (Table 3).
Table 2.
Results of regression model of Subjective SES predicting Framingham CVD risk score in the full sample with significant covariates*.
| Beta | t | P Value | |
|---|---|---|---|
| Subjective SES | −.059 | −2.44 | .015 |
| Depression | −.061 | −2.50 | .012 |
| BMI | −.12 | −4.89 | .000 |
| Anti-Hypertensive Use | .080 | 3.13 | .002 |
| Diabetes/Metabolic Disorder | −.054 | −2.18 | .030 |
| Inflammatory Disease | .054 | 2.22 | .026 |
non-significant covariates (p > .05): alcohol & drug use, neurological disorders, cancer, poverty status.
Table 3.
Results of race-stratified regression model of Subjective SES predicting Framingham CVD risk score with significant covariatesa.
| Blacks | Whites | |||||
|---|---|---|---|---|---|---|
|
|
|
|||||
| Beta | t | P | Beta | t | P | |
| Subjective SES | −.037 | −1.15 | .25 | −.074b | −2.01b | .045b |
| Depression | −.012 | −0.35 | .73 | −.12b | −3.40b | .001b |
| BMI | −.17b | −4.92b | <.001b | −.076b | −2.06b | .040b |
| Anti-Hypertensive Use | .074b | 2.12b | .034b | .097b | 2.59b | .010b |
| Diabetes/Metabolic Disorder | −.084b | −2.48b | .013b | −.040 | −1.08 | .28 |
| Inflammatory Disease | .12b | 3.78b | <.001b | −.010 | −0.29 | .77 |
Non-significant covariates (P>.05): alcohol & drug use, neurological disorders, cancer, poverty status.
Significance P<.05.
Discussion
Our results indicate that subjective SES is an independent predictor of 10-year CVD risk, although when stratified by race, this association was significant only in Whites. Our findings expand the literature on race differences in the relation of subjective SES to health outcomes, such as diabetes and all-cause mortality,5,8 to CVD risk. Additionally, our findings suggest that measuring subjective SES might aid in elucidating the underlying mechanisms responsible for higher rates of CVD in lower SES populations.2 Furthermore, our results indicate that, for Whites, risk prediction models that include subjective SES may have added predictive value above and beyond models including only traditional biomedical risk factors and objective SES.
Assessing subjective SES may add predictive utility above and beyond objective measures by adding the individual’s evaluation of their objective SES indicators; this subjective evaluation may have important implications for health outcomes. Such assessment may be particularly important in the case of education, which varies substantially in quality (which may differentially impact health outcomes), but this variability is not captured in objective measures.16 While the MacArthur ladder has demonstrated construct validity from other psychosocial measures, there is a significant relation with subjective SES and measures of psychosocial risk and protective factors, including depression, neuroticism, and optimism,6 which suggests potential mechanisms for its influence on health outcomes.
Additionally, it should be noted that our study used the community ladder rather than the country ladder. Qualitative studies on the community ladder revealed that many participants considered community participation and perceived respect by their community, in addition to income, education, and occupation, in determining their subjective SES rating.4 This may indicate that the measure is also tapping into the individual’s perceptions of social integration and social support within their community, which has important implications for health.
Study limitations include that these analyses were cross-sectional and therefore temporal associations cannot be assumed. Next, the variance in CVD risk differed by race (Whites’ scores indicated higher risk and greater variability). The latter may indicate underestimation of risk in Blacks rather than true differences. This is particularly because Blacks in this sample had a significantly higher poverty rate than Whites, and poverty status is associated with risk underestimation.16 Additionally, since sex is factored into the Framingham calculation, sex differences could not be examined. Future studies should investigate whether changes in subjective SES are associated with relative changes in CVD risk longitudinally. Finally, the MacArthur Scale is lacking sufficient information regarding psychometric properties of the measure, with the exception of the construct validity analyses reported in the methods.
However, despite these limitations, the findings from our study have important implications for racial and socioeconomic disparities in CVD. One of the most important implications is the need to assess subjective SES in addition to objective SES when determining SES-related increases in CVD risk. Most population- and clinical-level data assesses objective SES only and therefore may be lacking an important component of SES-related risk for disease. The MacArthur scale presents a simple method of assessing subjective SES with very low participant or patient burden, and therefore could easily be included in population- and clinic-level data collection protocols. Additionally, these findings may have important policy implications due to the various components that make up the conceptualization of subjective SES by individuals. These factors, which include material wealth, education, occupation, spiritual and ethical values, and social responsibility,14 may represent mutable targets for policy-level interventions that may in turn decrease CVD risk.
Acknowledgment
This work was supported by the Intramural Research Program, National Institute on Aging, National Institutes of Health (NIH) and NIH grant 1 RO1AG034161.
Footnotes
Author Contributions:
Design and concept of study: Allen, McNeely, Waldstein, Evans, Zonderman
Acquisition of data: Evans, Zonderman
Data analysis and interpretation: Allen, McNeely, Waldstein, Evans
Manuscript draft: Allen, McNeely, Waldstein, Zonderman
Statistical expertise: Allen, McNeely, Zonderman
Acquisition of funding: Evans, Zonderman
Administrative: Allen, Evans, Zonderman
Supervision: Waldstein, Zonderman
References
- 1.Lloyd-Jones D, Adams RJ, Brown TM, et al. Heart disease and stroke statistics--2010 update: a report from the American Heart Association. Circulation. 2010;121:e46–e215. doi: 10.1161/CIRCULATIONAHA.109.192667. [DOI] [PubMed] [Google Scholar]
- 2.Mensah GA, Mokdad AH, Ford ES, Greenlund KJ, Croft JB. State of disparities in cardiovascular health in the United States. Circulation. 2005;111:1233–1241. doi: 10.1161/01.CIR.0000158136.76824.04. [DOI] [PubMed] [Google Scholar]
- 3.Jackman MR, Jackman RW. An Interpretation of the Relation Between Objective and Subjective Social Status. Am. Sociol. Rev. 1973;38(5):569–582. [PubMed] [Google Scholar]
- 4.Adler N, Stewart J. The MacArthur Scale of Subjective Social Status. Psychosoc. Noteb. 2007 Available at: macses.ucsf.edu. Accessed September 19, 2012. [Google Scholar]
- 5.Adler N, Singh-Manoux A, Schwartz J, Stewart J, Matthews K, Marmot M. Social status and health: A comparison of British civil servants in Whitehall-II with European- and African-Americans in CARDIA. Soc. Sci. Med. 2008;66(5):1034–1045. doi: 10.1016/j.socscimed.2007.11.031. [DOI] [PubMed] [Google Scholar]
- 6.Adler NE, Epel ES, Castellazzo G, Ickovics JR. Relationship of subjective and objective social status with psychological and physiological functioning: preliminary data in healthy white women. Health Psychol. 2000;19(6):586–92. doi: 10.1037//0278-6133.19.6.586. Available at: http://www.ncbi.nlm.nih.gov/pubmed/11129362. [DOI] [PubMed] [Google Scholar]
- 7.Fiscella K, Holt K. Racial Disparity in Hypertension Control: Tallying the Death Toll. Ann Fam Med. 2008;6:497–503. doi: 10.1370/afm.873. [DOI] [PMC free article] [PubMed] [Google Scholar]
- 8.Kopp M, Skrabski A, Rethelyi J, Kawachi I, Adler N. Self-rated health, subjective social status, and middle-aged mortality in a changing society. Behav. Med. 2004;30(2):65–72. doi: 10.3200/BMED.30.2.65-72. [DOI] [PubMed] [Google Scholar]
- 9.Wilson P, D’Agostino R, Levy D, Belanger A, Silbershatz H, Kannel W. Prediction of coronary heart disease using risk factor categories. Circulation. 1998;97(18):1837–1847. doi: 10.1161/01.cir.97.18.1837. [DOI] [PubMed] [Google Scholar]
- 10.D’Agostino R, Grundy S, Sullivan L, Wilson P. Validation of the Framingham coronary heart disease prediction scores. JAMA. 2001;286(2):180–187. doi: 10.1001/jama.286.2.180. [DOI] [PubMed] [Google Scholar]
- 11.LaVeist T. Disentangling race and socioeconomic status: a key to understanding health inequalities. J. Urban Heal. 2005;82(3):iii26–iii34. doi: 10.1093/jurban/jti061. [DOI] [PMC free article] [PubMed] [Google Scholar]
- 12.Evans MK, Lepkowski JM, Powe NR, LaVeist T, Kuczmarski MF, Zonderman AB. Healthy aging in neighborhoods of diversity across the life span (HANDLS): overcoming barriers to implementing a longitudinal, epidemiologic, urban study of health, race, and socioeconomic status. Ethn. Dis. 2010;20:267–275. [PMC free article] [PubMed] [Google Scholar]
- 13.Radloff LS. The CES-D Scale: A Self-Report Depression Scale for Research in the General Population. Appl. Psychol. Meas. 1977;1:385–401. [Google Scholar]
- 14.Cundiff J, Smith T, Uchino B, Berg C. Subjective social status: construct validity and associations with psychosocial vulnerability and self-rated health. Int. J. Behav. Med. 2011;20(1):1–11. doi: 10.1007/s12529-011-9206-1. [DOI] [PubMed] [Google Scholar]
- 15.Jones CP. Invited commentary: “race,” racism, and the practice of epidemiology. Am. J. Epidemiol. 2001;154(4):299–304. doi: 10.1093/aje/154.4.299. discussion 305–6. [DOI] [PubMed] [Google Scholar]
- 16.Brindle P, McConnachie A, Upton M, Hart C, Smith G, Watt G. The accuracy of the Framingham risk-score in different socioeconomic groups: a prospective study. Br. J. Gen. Pract. 2005;55(520):838. [PMC free article] [PubMed] [Google Scholar]