Abstract
Objective
Prostate specific antigen (PSA), used for the early diagnosis of prostate cancer (PCa), is one of the best tumour markers known so far. However, in situations when PSA is between 2–10 ng/mL, which is named as grey zone, PSA falls short of distinguishing benign prostate diseases from PCa. On the other hand, it was demonstrated in many previous studies that microRNA (miRNA) could be a marker for cancer. Therefore, in this study, it was aimed to enhance the diagnostic power of PSA, especially with grey zone patients, by the use of miRNA.
Material and Methods
Ninety-four patients included in the study were divided into three groups as “control group” (n=44, PSA=2–10 ng/mL and benign), “PCa 1 group” (n=37, PSA=2–10 ng/mL), and “PCa 2 group” (n=13, PSA >10 ng/mL), according to their pathological results and PSA levels. Free PSA (fPSA) and total PSA (T-PSA) levels were measured with chemiluminometric sandwich immunoassay method. Expressions of miRNAs were analyzed using quantitative reverse transcription-polymerase chain reaction (qRT-PCR) method. The most appropriate specificity, sensitivity and prediction values were found by drawing the receiver operating characteristic (ROC) curves of total PSA, free/total PSA (f/T PSA) ratio, and miRNAs, and the diagnostic powers were compared with each other.
Results
Diagnostic powers of the f/T PSA ratio and miRNA were compared in PCa 1 and the control groups to determine the marker with higher area under the curve (AUC). It was shown that the diagnostic power of the combination of miR-16-5p and f/T PSA was higher than that obtained when they were used separately.
Conclusion
As a result, while making the the discrimination between benign and malignant prostate in patients with grey zone, it was determined that the combination of miR-16-5p and f/T PSA was more valuable than T-PSA or f/T PSA alone. It was thought that diagnostic role of miRNAs in the early diagnosis of the different stages of PCa needed to be examined in further studies with larger groups.
Keywords: Grey zone, marker, microRNA, prostate cancer
Introduction
Prostate cancer (PCa) takes the second place among all cancers seen in men. It is one of the silent, slowly- progressing cancers which are seen in advanced age, while it has been diagnosed at an earlier age thanks to recent survey studies.[1–3] Generally prostate, lung, and colon cancers occupy the top three rows, while in Turkey lung, prostate, and bladder cancer have the highest incidence rates, in that order.[4]
Although its etiology has not been clarified yet, its incidence differs among various ethnic populations, and countries. For instance, as a known fact, its incidence is low in China, and Japan, while it is more frequently seen in Northern America, and Scandinavian countries. Some publications have demonstrated that diets rich in fat content, higher serum calcium, and androgen levels, professions dealing with cadmium, chronic infections, and vasectomy operation are associated with PCa.[2,3]
Diagnosis of PCa when it is organ-confined is important in order to increase disease-free survival, and decrease mortality rates. To this end annual prostate-specific antigen (PSA) screening tests combined with digital rectal examination (DRE) have been recommended after 50 years of age.[5–7] In the presence of suspect mass, transrectal ultrasound-guided (TRUS) prostate biopsy has been used as a gold standard diagnostic method for PCa.[5–7]
As the most frequently used tumor marker nowadays, PSA contributes considerably to early diagnosis, staging, and follow-up of PCa. Introduction of PSA, and its derivatives which aim to enhance sensitivity of PSA, into clinical practice has facilitated establishment of diagnosis of PCa at an early stage, and incidence of localized PCa has skyrocketed. PSA, also increases in benign diseases apart from PCa which supports its organ specific, rather than cancer-specific characteristics. Because of its low sensitivity, and specificity in the discrimination between malignant, and benign lesions, its diagnostic value as a tumor marker has been questioned. On the other hand, especially in cases with PSA values between 2, and 10 ng/mL where PSA values of benign prostatic hyperplasia (BPH), and PCa overlap, application of biopsy procedure contributes adversely to subsequent treatment burden.[8,9] Therefore in the early diagnosis of PCa, biomarkers with higher sensitivity, and specificity are needed without resorting to invasive interventions.
MicroRNA (miRNA) is one of the molecules investigated for this purpose. MicroRNAs are 21–23 long- single- strand RNAs which can not be converted to protein. Dependent on its partial or complete binding to messenger ribonucleic acid (mRNA), it triggers destruction of mRNA or suppresses its translation which characterizes its regulatory role in expression of genes.[10–12] Most of the genes are localized at cancer-related regions or fragile regions which suggests important roles of miRNA in the pathogenesis of neoplasias.[13] Because of differences in expression levels of miRNA between normal, and malignant tissues, in addition to the association between intensity of expression, and prognosis, and long-term stability of miRNA in tissue samples, and body fluids, miRNAs have been suggested as new biomarkers in the diagnosis, prognosis, and classification of malignant diseases. To this end studies have been performed in many types of cancer, and groups with PCa.[14–25]
In this study target population was patients whose PSA levels within the gray zone where PSA fails to differentiate between benign, and malignant diseases. In previous studies 59 different miRNAs related to PCa were determined, and their expression profiles were investigated. Thus in patients within gray zone, we aimed to evaluate the diagnostic power of expression levels of total PSA (T-PSA), free/total PSA (f/T PSA) ratio, and miRNA in the discrimination between benign, and malignant prostatic diseases when they are used individually or in combination.
Material and methods
Study group, and sampling
The patients who applied to the urology department between January 2012, and January 2013, and underwent prostate biopsy were grouped based on PSA values, and histopathology results. Forty-four patients aged between 47, and 83 years with benign pathology and PSA levels between 2–10 ng/mL constituted the “control group.” Thirty-seven patients aged between 48, and 72 years with malign pathology whose PSA values were between 2, and 10 ng/mL consisted PCa 1 Group. Thirteen patients aged between 53, and 81 years with PSA values above 10 ng/mL, and diagnosis of PCa based on histopathology report of the biopsy material were included in the PCa 2 Group.
These patients were treatment- naive PCa patients aged >18 years with PSA levels below 100 ng/mL without any distant metastases who were not hospitalized within the previous year for any malignancy or chronic disease. Demographic information of the patients, and control subjects who participated in the study were recorded. The study was approved by Mersin University Ethics Committee for Clinical Investigations dated 22.12.2011 with a decision number 2011/119. All study participants were informed about the study, and their written informed consent was obtained.
Blood samples of all patients were placed in plain tubes with gel, and in ethylene diamine tetraacetic acid (EDTA) containing tubes, and centrifuged (4000 rpm for 15 min) to obtain plasma, and serum portions. In hormone autoanalyzer [Advia Centaur XP (Siemens Healthcare Diagnostics Inc, Tarrytown, NY, 10591-5097, USA)] fPSA and T-PSA levels were measured two-site sandwich immunoassay using direct chemiluminometric technology method. Plasma portions were transferred into a clean microcentrifuge tube, and after the second centrifuging (13000 rpm for 5 min), 200 μL of the sample was kept at −80°C till isolation of RNA.
Isolation of miRNA, and qRT-PCR
In compliance with the manufacturer’s directives RNA was isolated using High Pure miRNA Isolation Kit (Roche Diagnostics, Manheim, Germany), and stored at −80°C till its use.
Complementary DNAs (cDNAs) were obtained from isolated RNAs using TaqMan MicroRNA Reverse Transcription Kit (Applied Biosystems, Foster City, CA, USA). All reactions were realized in compliance with the recommendations of the manufacturer. Reverse transcription procedure was performed using Gene-Pro Thermal Cycler (B384G, SN: BYQ606002E-060, Korea). Samples containing cDNA were kept at −80°C till application of polymerase chain reaction (PCR).
Pre-amplification procedure was performed using TaqMan PreAmp Master Mix 2X (PN 4391128; Applied Biosystems, Foster City, CA, USA) and Megaplex Human Primer Pools Set v3.0 (PN 4444750; Applied Biosystems, Foster City, CA, USA) kits in compliance with manufacturer’s recommendations. miRNA TaqMan PreAmp Thermal protocol was realized using Gene-Pro Thermal Cycler (B384G, SN: BYQ606002E-060, Korea).
Quantitative Real-Time PCR reactions (qRT-PCR) were induced using high capacity BioMark Real-Time PCR system (Fluidigm, South San Francisco, CA, USA). Pre-amplified cDNA samples and PCR mixture were pipetted into sample inlets of 96.96 Dynamic Array (Fluidigm, South San Francisco, USA). While, 20X Assay solutions diluted to 1:1 were pipetted into assay inlets of 96.96 Dynamic Array. Assay and sample mixture was loaded into the chamber of 96.96 Dynamic Array by BioMark IFC Controller device using Fluidigm’s Integrated Fluidic Circuit Technology. RT-PCR procedure was performed using BioMark System in compliance with the manufacturer’s instructions.
Statistical analysis
Results of statistical analysis of 59 miRNA expressions (Table 1) were evaluated with the aid of Biogazelle’s qbase PLUS 2.0 software (Belgium) which uses global mean normalization method that resolves the problem of housekeeping gen present in the circulation. Differences in miRNA expressions in the patient, and the control groups were compared with Mann-Whitney U test. P<0.05 was considered as statistically significant. Differences in expressions of miRNA were estimated using 2−ΔΔCt equation, and expressed as fold changes. Diagnostic powers of T-PSA, f/T PSA, and miRNA expressions were evaluated based on sensitivity, specificity, and cut-off values derived from ROC (receiver operating characteristic) curves. For statistical analyses MedCalc, and SPSS (Statistical Package for the Social Sciences Inc; Chicago, IL, USA) v.11.5 statistical programs were used. Analytical evaluation of the results was performed using ROC Curve, and factor analysis.
Table 1.
Expression levels of various miRNAs
| let-7a-3p | miR-17-5p | miR-125b-1-3p | miR-146b-5p | miR-25-5p | miR-141-3p | miR-198 |
| let-7a-5p | miR-23a-3p | miR-125b-2-3p | miR-203a | miR-26a-1-3p | miR-141-5p | miR-205-5p |
| let-7b-3p | miR-23b-3p | miR-143-3p | miR-449a | miR-26a-2-3p | miR-181a-5p | miR-221-3p |
| let-7b-5p | miR-23b-5p | miR-143-5p | miR-449b-5p | miR-32-3p | miR-181a-2-3p | miR-221-5p |
| let-7c | miR-100-3p | miR-145-3p | miR-21-3p | miR-32-5p | miR-181c-3p | miR-370 |
| miR-15a-3p | miR-100-5p | miR-145-5p | miR-21-5p | miR-93-3p | miR-181c-5p | |
| miR-15a-5p | miR-125a-3p | miR-146a-3p | miR-22-3p | miR-93-5p | miR-194-3p | |
| miR-16-5p | miR-125a-5p | miR-146a-5p | miR-22-5p | miR-135b-3p | miR-194-5p | |
| miR-16-1-3p | miR-125b-5p | miR-146b-3p | miR-25-3p | miR-135b-5p | miR-196a-3p |
miRNA: microRNA
Results
Descriptive information of the groups included in the study are given in Table 2.
Table 2.
Descriptive information of the patient, and the control groups
| Group | Mean age | Alcohol use (+/−) | Smoking (+/−) | Prostate volume |
|---|---|---|---|---|
| Control (n:44) | 61.8 years | 6/38 | 13/31 | 50.4 cc |
| PCa 1 (n: 37) | 63.9 years | 4/33 | 4/33 | 42.7 cc |
| PCa 2 (n:13) | 65.5 years | 2/11 | 2/11 | 36.7 cc |
T-PSA, and f/T PSA ratios of the PCa 1, and control groups were compared, and their ROC curves were drawn (Figures 1, and 2). Optimal sensitivity, and specificity values were determined, and corresponding cut-off values were selected.
Figure 1.
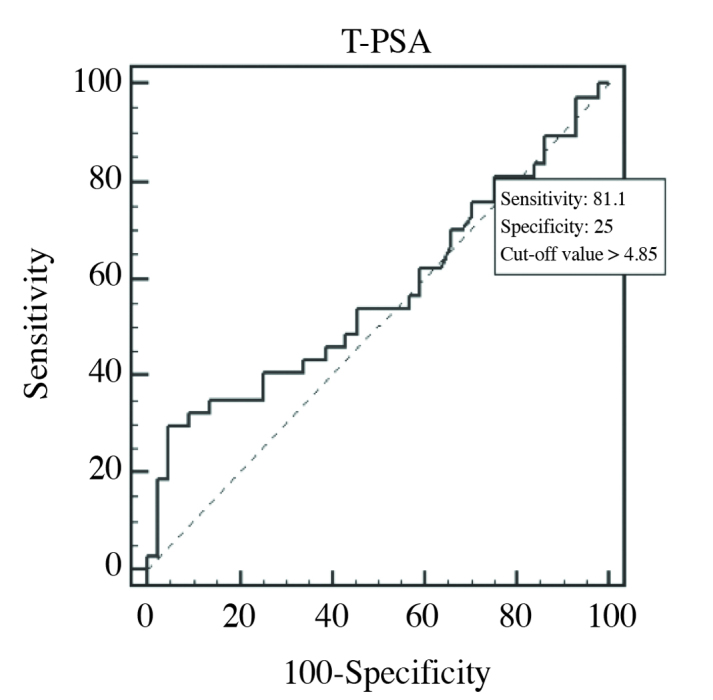
ROC curve of T-PSA in PCa 1, and control groups (AUC=0.566)
Figure 2.
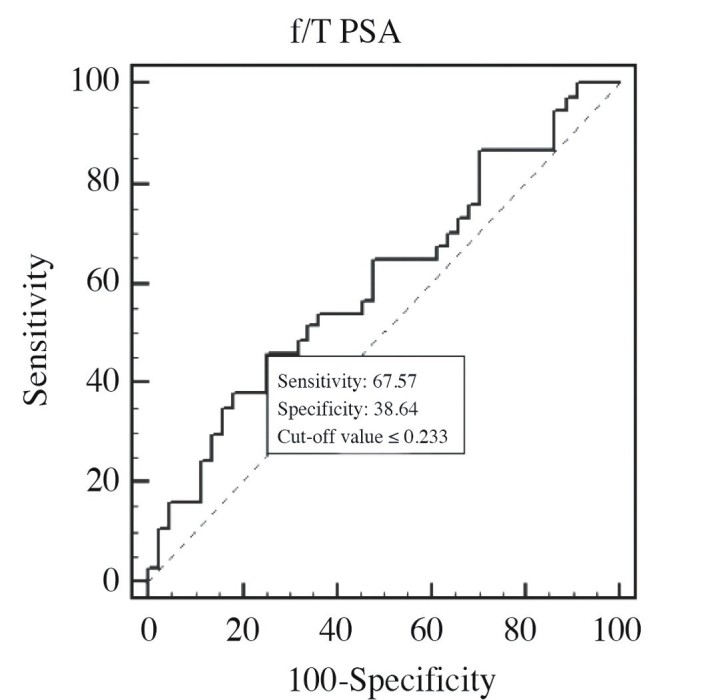
ROC curve of f/T PSA ratio in PCa 1, and control groups (AUC=0.602)
When cut-off value of PSA was >4.85 ng/mL, then its sensitivity, and specificity were 81.1, and 25%, respectively. When cut-off value of f/T PSA ratio was ≤0.233 (≤23.3%), then its sensitivity, and specificity were 67.57, and 38.64%, respectively. Area under curves (AUCs) of T-PSA, and f/T PSA PSA ratio were estimated as 0.566 (p=0.3206), and 0.602, respectively (p=0.1109).
In comparison between PCa 1, and control groups, miRNAs with significant fold changes between expressions were determined, and their ROC curves were drawn. Among them sensitivity, and diagnostic power of miRNAs with AUCs closest, and extremely different from that of f/T PSA were compared. A statistically significant difference was not found between these two groups as for miRNAs evaluated (p>0.05).
Although a statistically significant difference did not exist between PCa 1, and control groups as for miRNA expression levels, some miRNAs demonstrated ≥2-fold change with respect to both global mean, and intergroup comparisons, which was evaluated as statistically significant. The miRNAs with ≥2 fold-change are presented in Table 3.
Table 3.
miRNAs with significant fold-changes in expression levels between PCa 1, and control groups
| miRNAs with increasing levels | miRNAs with decreasing levels |
|---|---|
| miR-16-5p | miR-203a |
| miR-17-5p |
miRNA: microRNA
Intergroup comparisons based on fold-change (2−ΔΔCt) values determined the presence of a significant fold-change, and ROC curves of these 3 miRNAs were drawn to evaluate diagnostic power of these miRNAs using MedCalc statistical program. Based on optimal values for specificity, and sensitivity, cut-off values of each parametre were determined. Among them AUC values of only miR-16-5p were higher than those of others.
Cut-off value of >1,71-fold for miR-16-5p had 93.75% sensitivity, and 25% specificity. Accordingly, its AUC value was calculated as 0.586 (p=0.5080) (Figure 3). Even AUC value of miR-16-5p was lower than that of f/T PSA ratio, among these three miRNAs, miR-16-5p with the highest AUC value was selected. Then combined ROC curves of this miR-16-5p, and f/T PSA ratio were drawn, and evaluated (Figure 4).
Figure 3.
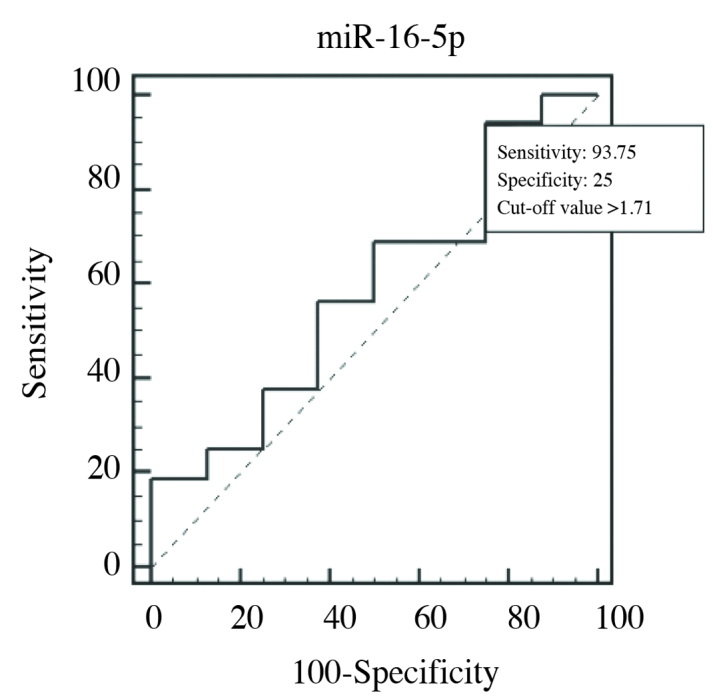
ROC curve of miR-16-5p in PCa 1, and control groups (AUC=0.586)
Figure 4.
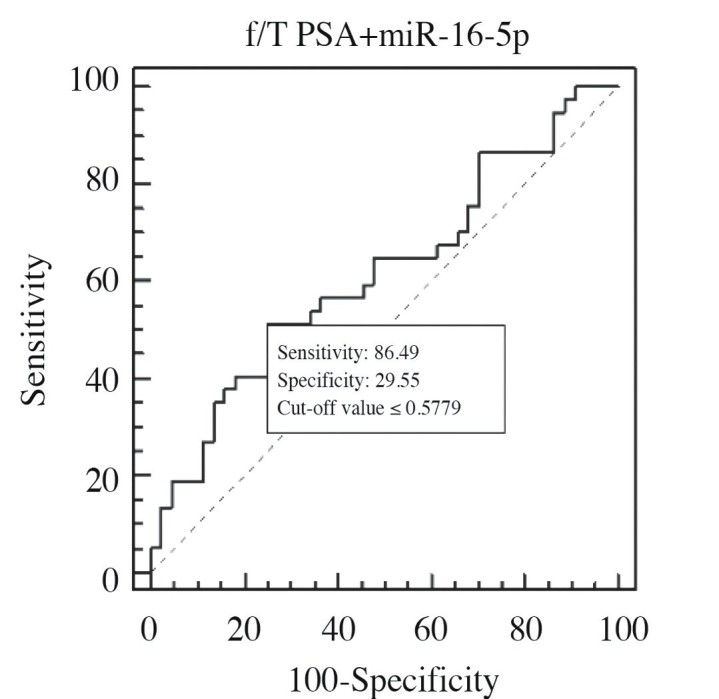
ROC curve of f/T PSA + miR-16-5p combination in PCa 1, and control groups (AUC=0.616) comparison
In the comparison between PCa 1, and PCa 2, cut-off value of >0.1337 (>13.37%) for f/T PSA ratio had optimal sensitivity, and specificity of 83.8, and 53.8%, respectively. While its AUC was calculated as 0.628 (p=0.2448) (Figure 5). In the PCa 2 group with T-PSA>10 ng/mL, expressions of some miRNAs decreased (Table 4), but this change was not statistically significant (p>0.05). ROC curves were drawn based on 2−ΔΔCt values of 4 miRNAs which demonstrated fold-changes between groups. AUC values of these 4 miRNAs were higher than those of f/T PSA ratios. These 4 miRNAs in PCa 1, and PCa 2 groups with AUC values higher than those of f/T PSA ratios were evaluated singly or in combination with f/T PSA by drawing their AUC curves, and their diagnostic powers were compared (Table 5).
Figure 5.
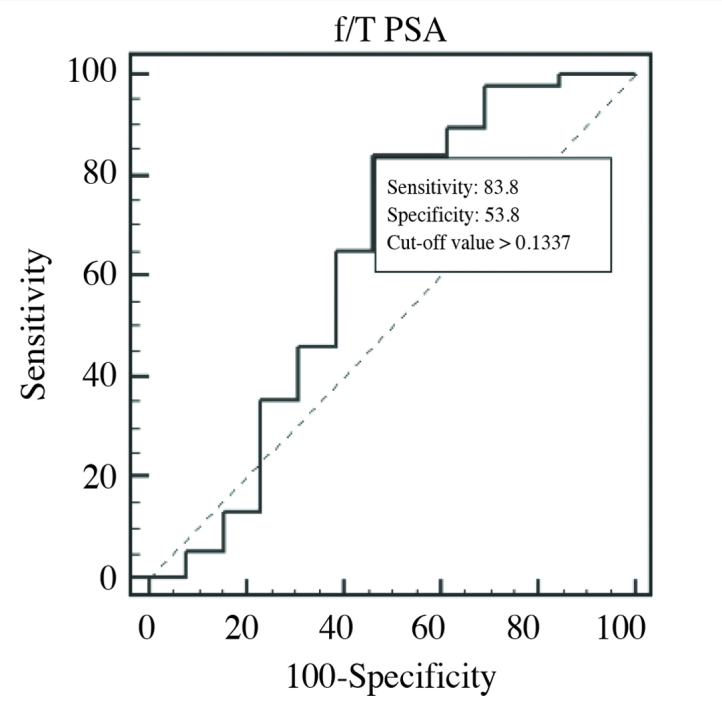
ROC curve in comparison between PCa 1, and PCa 2 groups as for f/T PSA ratio (AUC=0.628)
Table 4.
miRNAs with significant fold-changes in expression levels between PCa 1, and PCa 2 groups
| miRNAs with decreasing levels | |
|---|---|
| miR-25-3p | miR-194-5p |
| miR-125b-5p | miR-203a |
miRNA: microRNA
Table 5.
Data of the parameters whose ROC curves were drawn in the comparison between PCa 1, and PCa 2 groups
| Parametre | Cut-off value | AUC | Sensitivity | Specificity |
|---|---|---|---|---|
| f/T PSA | 13.37% | 0.628 | 83.8% | 53.8% |
| miR-25-3p | 3.821-fold | 0.708 | 85.7% | 41.67% |
| miR-125b-5p | 2.41-fold | 0.744 | 100% | 61.54% |
| miR-194-5p | 1.05-fold | 0.933 | 100% | 80% |
| miR-203a | 1.038-fold | 0.667 | 100% | 41.67% |
| f/T PSA+miR-25-3p | 0.4314 | 0.647 | 84.62% | 18.92% |
| f/T PSA+miR-125b-5p | −0.2997 | 0.601 | 76.92% | 35.14% |
| f/T PSA+miR-194-5p | 0.9065 | 0.672 | 92.31% | 24.32% |
| f/T PSA+miR-203a | 0.4082 | 0.707 | 92.31% | 32.43% |
| f/T PSA+4 miRNA | −0.033 | 0.576 | 92.31% | 37.84% |
ROC: Receiver operating characteristic curve; AUC: area under curve; f/T PSA: free/total PSA ratio; miRNA: microRNA
The f/T PSA ratios of PCa 2, and control groups were compared (Figure 6). Although a statistically significant difference was not detected between the PCa 2, and control groups, miRNAs demonstrated ≥2-fold changes between groups (Table 6). Two miRNAs which had higher AUC values than those of f/T PSA ratios were determined as miR-125b-5p, and miR-194-5p. ROC curves of miR-125b-5p, and miR-194-5p in PCa 2, and control groups which had higher AUC values than those of f/T PSA ratios were drawn singly or in combination with f/T PSA ratio, and their diagnostic powers were compared (Table 7).
Figure 6.
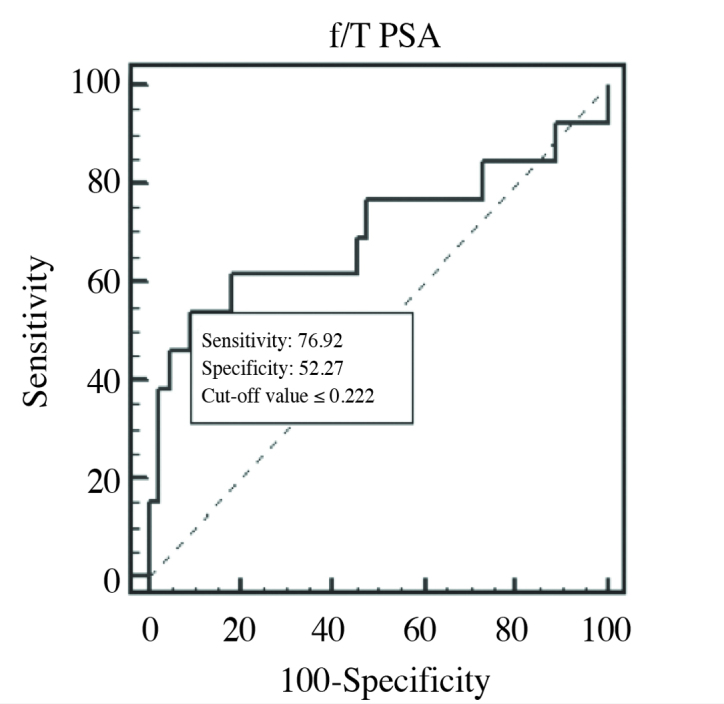
ROC curve of f/T PSA ratio (AUC=0.698) in PCa 2, and control groups comparison
Table 6.
miRNAs whose expressions differed significantly in the PCa 2, and control groups
| miRNAs with increasing levels | miRNAs with decreasing levels |
|---|---|
| miR-181c-5p | miR-25-3p |
| miR-125b-5p | |
| miR-194-5p |
miRNA: microRNA
Table 7.
ROC curves drawn for various parameters in comparison between PCa 2, and control groups
| Parametre | Cut-off value | AUC | Sensitivity | Specificity |
|---|---|---|---|---|
| f/T PSA | 22.2% | 0.698 | 76.92% | 52.27% |
| miR-125b-5p | 2.41-fold | 0.818 | 100% | 72.73% |
| miR-194-5p | 1.05-fold | 0.806 | 100% | 50% |
| f/T PSA+miR-125b-5p | 0.6651 | 0.626 | 84.62% | 25% |
| f/T PSA+2 miRNA | −0.4915 | 0.532 | 84.62% | 29.55% |
ROC: Receiver operating characteristic curve; AUC: Area under curve; f/T PSA: free/total PSA ratio; miRNA: microRNA
Discussion
Results we obtained from our ROC curves drawn with T-PSA data retrieved from PCa 1, and control groups were closer to those cited in the literature. In our study, cut-off value of 4.85 ng/mL had 81.1% sensitivity, and 25% specificity. However as demonstrated in the literature, cut-off value of 3.9 ng/mL could discriminate between benign, and malignant patients with 85% sensitivity,and 25% specificity.[8] In our study cut-off value of 23.3% for f/T PSA ratio had 67.57% sensitivity, and 38.64% specificity which were in accordance with the results of the previous studies. In various studies, use of threshold values for f/T PSA ratio ranging between 14–25% have been recommended.[26]
In studies performed with patients whose PSA values in the grey zone, higher diagnostic power of f/T PSA has been demonstrated relative to T-PSA.[8,26] In accordance with literature data, ROC curves were drawn for T-PSA (0.566), and f/T PSA (0.602), and higher discriminative power of f/T PSA was demonstrated due to its higher ROC curve value.
In comparisons between PCa 1, and control groups, we evaluated diagnostic powers of miRNAs in the discrimination between BPH, and PCa, and drew ROC curves of the miRNAs (miR-16-5p, miR-17-5p, and miR-203a) whose expressions differed significantly.
Diagnostic power of miR-16-5p - f/T PSA combination which increases in cancer patients relative to the control group and has an AUC value closest to that of f/T PSA ratio was evaluated. Estimated AUC value was higher than that calculated for each parameter individually which indicated higher diagnostic power of this combination (0.616).
In two studies performed with prostate tissue samples lower levels of miR-16 (new nomenclature: miR-16-5p) expression were demonstrated in PCa tissue relative to benign prostate tissue, and metastasis- suppressing effects of miR-16 which were correlated with the development of metastases were suggested.[27,28] A study performed in patients with localized, and metastatic PCa patients refractory to castration demonstrated that miR-16 expression relatively decreased in the metastatic group.[29] Mahn et al.[30] compared prostate tissues, and serum samples, and could not observed any difference between miR-16 expressions in malign, and benign prostate tissues, while higher levels of miR-16 expression were detected in sera of PCa patients when compared with BPH patients, and healthy controls. Besides, levels of miR-16 expression decreased after prostatectomy relative to preoperative values.
In some publications, miR-16 levels did not differ between patients with malignant, and benign diseases, so it was considered as housekeeping gene in plasma miRNA profiling studies. In some studies, its decrease in tissue samples harvested from cancer patients, while in our study similar to those reported by Mahn et al.[30] for serum samples, though not statistically significant, increased plasma miRNA levels were observed in serum samples.[31–33]
AUCs were calculated based on ROC curves drawn using f/T PSA data obtained from PCa 1, and PCa 2 groups (0.628). Decreases in miR-25-3p, miR-125b-5p, miR-194-5p, and miR-203a expression levels which demonstrated significant fold-change were seen in PCa 2 group relative to PCa 1 group. ROC curves were drawn for each miRNA singly or for all miRNAs combined with f/T PSA ratio. AUC value (0.933) of only miR-194-5p was statistically significant (p<0.0001) and demonstrated the best diagnostic power. Among AUC values of combined parameters, AUC value for f/T PSA + miR-203a was statistically significantly higher than those of other combinations (0.707) (p=0.0131).
Tong et al.[34] performed miRNA expression profiling of prostatectomy tissue materials using qRT-PCR method, and demonstrated higher levels of miR-194 (new nomenclature: miR-194-5p) in cancer patients. They suggested that modified miRNA expression accompanies oncogenic process developing in prostat tissue, and abnormal miRNA expressions might reflect the tendency of early disease recurrence. In our study two patient groups were allocated based on PSA isolated from plasma were compared, and we found decreased levels of miR-194-5p expression in PCa 2 group. Studies demonstrating different expression levels in tissue, and plasma samples might be the reason for different results obtained in our study, and in some literature studies.[30]
In a study where miR-203 (new nomenclature: miR-203a) expressions in malign, and normal prostate tissue were compared, decrease in miR-203 expression was demonstrated in correlation with advanced PCa, and its”anti-metastatic” value was suggested.[35] Also in our study, in compliance with the literature decrease in miR-203 levels was observed.
In comparison between PCa 2, and control groups, ROC curves drawn using f/T PSA ratio data, were evaluated to calculate AUC value (0.698). As a result of intergroup comparisons AUC values of decreased miR-125b-5p, and miR-194-5p were higher than AUC values estimated for f/T PSA ratio. (0.818, and 0.806, respectively). Afterwards, ROC curves were drawn one by one or in combination with f/T PSA ratio. Based on the results obtained one can say that isolated miR-125b-5p, and miR-194-5p expressions have higher diagnostic power when compared with f/T PSA ratio.
In the literature controversial results have been cited about miR-125b (new nomenclature: miR-125b-5p). In some publications it was described as an oncomir. Some authors observed increased, while others decreased expressions of miR-125b in PCa patients.[25,28,29,31–34,36–39] Mitchell et al.[22] compared miRNA expressions in serum samples of the patients with metastatic PCa, and control patients using qRT-PCR method, and reported higher miR-125b expression levels in PCa patients. Özen et al.[36], compared expressions of miRNA in benign, and PCa tissues, and observed lower miR-125b expressions in localized prostate cancer tissue. In our study, though not statistically significant, we found decreased miR-125b, expressions in the PCa group.
In this study where we aimed to find a biomarker which would either reinforce diagnostic power of PSA or could be used singly as a biomarker with higher diagnostic power, as an important study outcome we found that use of f/T PSA + miR-16-5p in combination has a more valuable diagnostic power when compared with isolated use of T-PSA or f/T PSA ratio.
In the PCa 2 group with PSA values above 10 ng/mL, we have found that decrease in the expression of miR-194-5p reinforced the presence of prostatic malignancy, which might be related also to the prognosis of the disease. However in comparison between PCa 2 and control groups, decrease in expressions of miR-125-5p, and miR-194-5p were in favour of malignancy, and could discriminate between PCa, and BPH more accurately than f/T PSA ratio. However in cases with PSA levels higher than 10 ng/mL, biopsy can not be avoided, use of biomarkers for screening will not either rule out exposure to interventional procedures or accelerate diagnostic process.
During miRNA expression profiling studies, controversies may exist for various reasons as comparison of cancer groups in different disease stages, inclusion of the patients with BPH or healthy volunteers in the study, isolation of miRNAs from diverse samples, studies performed in populations with various sampling sizes, and differences in isolation, and expression evaluation methods. In studies performed in small populations, one should know how accurately will study outcomes reflect the general condition as a whole, so an optimal sample group should be selected. One should not forget that large distribution range of the outcomes may also result in retrieval of controversial data.
In our study, analysis of easily obtainable samples, and evaluation of multiple samples using data retrieved from a single PCR procedure lasting for a few hours is a great advantage. Tissue retrieval, isolation of miRNAs, selection of prolonged, and tedious methods will effect the efficiency of the study. Each type of screening method to be used for early diagnosis should be easily applied with a short time, and the sample should be readily available.
Finally, we think that investigation of miRNA profiles in studies to be planned in larger study populations categorized according to disease stages may allow use of miRNAs in the early diagnosis of PCa.
Footnotes
This study was presented as a poster at the IFCC Worldlab 2014 Congress in Istanbul, on 22–26 June, 2014.
Ethics Committee Approval: Ethics committee approval was received for this study from the ethics committee of Mersin University School of Medicine (22.12.2011, 2011/119).
Informed Consent: Written informed consent was obtained from patients who participated in this study.
Peer-review: Externally peer-reviewed.
Author Contributions: Concept - N.M.; Design - S.A., N.M.; Supervision - N.M.; Resources - S.A., N.M., M.B.; Materials - S.A.; Data Collection and/or Processing - S.A., S.E.; Analysis and/or Interpretation - S.A., N.M., S.E., M.B.; Literature Search - S.A., N.M.; Writing Manuscript - S.A.; Critical Review - S.A., N.M., M.B.
Conflict of Interest: No conflict of interest was declared by the authors.
Financial Disclosure: This study was supported by Mersin University Scientific Research Projects Units as BAP-TF TTB (SA) 2012-1 TU coded project.
References
- 1.Siegel RL, Miller KD, Jemal A. Cancer statistics, 2016. CA Cancer Clin. 2016;66:7–30. doi: 10.3322/caac.21332. https://doi.org/10.3322/caac.21332. [DOI] [PubMed] [Google Scholar]
- 2.Grönberg H. Prostate cancer epidemiology. Lancet. 2003;361:859–64. doi: 10.1016/S0140-6736(03)12713-4. https://doi.org/10.1016/S0140-6736(03)12713-4. [DOI] [PubMed] [Google Scholar]
- 3.Reiter RE, deKernion JB, Epidemiology Etiology. Prevention of Prostate Cancer. In: Walsh PC, Retik AB, Vaughan ED, Wein AJ, editors. Campbell’s Urology. 8th ed. Vol. 4. Philadelphia, London New York, St. Louis, Sydney, Toronto: Saunders; 2002. pp. 3003–24. [Google Scholar]
- 4.Aydin S, Boz MY. Rapid changes in the incidence of urinary cancers in Turkey. Turk J Urol. 2015;41:215–20. doi: 10.5152/tud.2015.45548. https://doi.org/10.5152/tud.2015.45548. [DOI] [PMC free article] [PubMed] [Google Scholar]
- 5.Smith RA, Mettlin CJ, Davis KJ, Eyre H. American Cancer Society Guidelines for the early detection of cancer. CA Cancer J Clin. 2000;50:34–49. doi: 10.3322/canjclin.50.1.34. https://doi.org/10.3322/canjclin.50.1.34. [DOI] [PubMed] [Google Scholar]
- 6.Carroll P, Coley C, McLeod D, Schellhammer P, Sweat G, Wasson J, et al. Prostate specific antigen best practice policy. Part I. Early detection and diagnosis of prostate cancer. Urology. 2001;57:217–24. doi: 10.1016/s0090-4295(00)00993-6. https://doi.org/10.1016/S0090-4295(00)00993-6. [DOI] [PubMed] [Google Scholar]
- 7.Catalona WJ, Richie JP, Ahmann FR, Hudson MA, Scardino PT, Flanigan RC, et al. Comparison of digital rectal examination and serum prostate specific antigen in the early detection of prostate cancer: Results of a multicenter clinical trial of 6630 men. J Urol. 1994;151:1283–90. doi: 10.1016/s0022-5347(17)35233-3. [DOI] [PubMed] [Google Scholar]
- 8.Alkibay T, Gürocak S. Tümör immünolojisi ve tümör belirleyiciler. In: Anafarta K, Bedük Y, Arıkan N, editors. Temel Üroloji. 3. Baskı. Ankara: Öncü Basımevi; 2007. pp. 687–98. [Google Scholar]
- 9.Deliveliotis C, Alivizatos G, Stavropoulos N, Makrychoritis K, Koutsokalis G, Kiriakakis Z, et al. Influence of digital examination, cystoscopy, transrectal ultrasonography and needle biopsy on the concentration of prostate specific antigen. Urol Int. 1994;53:186–90. doi: 10.1159/000282670. https://doi.org/10.1159/000282670. [DOI] [PubMed] [Google Scholar]
- 10.Jackson RJ, Standart N. How do microRNAs regulate gene expression? Sci STKE. 2007;367:re1. doi: 10.1126/stke.3672007re1. https://doi.org/10.1126/stke.3672007re1. [DOI] [PubMed] [Google Scholar]
- 11.Lee RC, Feinbaum RL, Ambros V. The C. elegans heterochronic gene lin-4 encodes small RNAs with antisense complementarity to lin-14. Cell. 1993;75:843–54. doi: 10.1016/0092-8674(93)90529-y. https://doi.org/10.1016/0092-8674(93)90529-Y. [DOI] [PubMed] [Google Scholar]
- 12.Huntzinger E, Izaurralde E. Gene silencing by microRNAs: Contributions of translational repression and mRNA decay. Nat Rev Genet. 2011;12:99–110. doi: 10.1038/nrg2936. https://doi.org/10.1038/nrg2936. [DOI] [PubMed] [Google Scholar]
- 13.Calin GA, Sevignani C, Dumitru CD, Hyslop T, Noch E, Yendamuri S, et al. Human microRNA genes are frequently located at fragile sites and genomic regions involved in cancers. Proc Natl Acad Sci USA. 2004;101:2999–3004. doi: 10.1073/pnas.0307323101. https://doi.org/10.1073/pnas.0307323101. [DOI] [PMC free article] [PubMed] [Google Scholar]
- 14.Kong W, Zhao JJ, He L, Cheng JQ. Strategies for profiling microRNA expression. J Cell Physiol. 2009;218:22–5. doi: 10.1002/jcp.21577. https://doi.org/10.1002/jcp.21577. [DOI] [PubMed] [Google Scholar]
- 15.Blenkiron C, Miska EA. miRNAs in cancer: approaches, aetiology, diagnostics and therapy. Hum Mol Genet. 2007;16:R106–13. doi: 10.1093/hmg/ddm056. https://doi.org/10.1093/hmg/ddm056. [DOI] [PubMed] [Google Scholar]
- 16.Barbarotto E, Schmittgen TD, Calin GA. MicroRNAs and cancer: profile, profile, profile. Int J Cancer. 2008;122:969–77. doi: 10.1002/ijc.23343. https://doi.org/10.1002/ijc.23343. [DOI] [PubMed] [Google Scholar]
- 17.Nelson PT, Baldwin DA, Scearce LM, Oberholtzer JC, Tobias JW, Mourelatos Z. Microarray-based, high-throughput gene expression profiling of microRNAs. Nat Methods. 2004;1:155–61. doi: 10.1038/nmeth717. https://doi.org/10.1038/nmeth717. [DOI] [PubMed] [Google Scholar]
- 18.Xi Y, Nakajima G, Gavin E, Morris CG, Kudo K, Hayashi K, et al. Systematic analysis of microRNA expression of RNA extracted from fresh frozen and formalin-fixed paraffin-embedded samples. RNA. 2007;13:1668–74. doi: 10.1261/rna.642907. https://doi.org/10.1261/rna.642907. [DOI] [PMC free article] [PubMed] [Google Scholar]
- 19.Li J, Smyth P, Flavin R, Cahill S, Denning K, Aherne S, et al. Comparison of miRNA expression patterns using total RNA extracted from matched samples of formalin-fixed paraffin-embedded (FFPE) cells and snap frozen cells. BMC Biotechnol. 2007;7:36. doi: 10.1186/1472-6750-7-36. https://doi.org/10.1186/1472-6750-7-36. [DOI] [PMC free article] [PubMed] [Google Scholar]
- 20.Tetzlaff MT, Liu A, Xu X, Master SR, Baldwin DA, Tobias JW, et al. Differential expression of miRNAs in papillary thyroid carcinoma compared to multinodular goiter using formalin fixed paraffin embedded tissues. Endocr Pathol. 2007;18:163–73. doi: 10.1007/s12022-007-0023-7. https://doi.org/10.1007/s12022-007-0023-7. [DOI] [PubMed] [Google Scholar]
- 21.Doleshal M, Magotra AA, Choudhury B, Cannon BD, Labourier E, Szafranska AE. Evaluation and validation of total RNA extraction methods for microRNA expression analyses in formalin-fixed, paraffin-embedded tissues. J Mol Diagn. 2008;10:203–11. doi: 10.2353/jmoldx.2008.070153. https://doi.org/10.2353/jmoldx.2008.070153. [DOI] [PMC free article] [PubMed] [Google Scholar]
- 22.Mitchell PS, Parkin RK, Kroh EM, Fritz BR, Wyman SK, Pogosova-Agadjanyan EL, et al. Circulating micro-RNAs as stable blood-based markers for cancer detection. Proc Natl Acad Sci USA. 2008;105:10513–8. doi: 10.1073/pnas.0804549105. https://doi.org/10.1073/pnas.0804549105. [DOI] [PMC free article] [PubMed] [Google Scholar]
- 23.Mattie MD, Benz CC, Bowers J, Sensinger K, Wong L, Scott GK, et al. Optimized high-throughput microRNA expression profiling provides novel biomarker assessment of clinical prostate and breast cancer biopsies. Mol Cancer. 2006;5:24. doi: 10.1186/1476-4598-5-24. https://doi.org/10.1186/1476-4598-5-24. [DOI] [PMC free article] [PubMed] [Google Scholar]
- 24.Prueitt RL, Yi M, Hudson RS, Wallace TA, Howe TM, Yfantis HG, et al. Expression of microRNAs and protein-coding genes associated with perineural invasion in prostate cancer. Prostate. 2008;68:1152–64. doi: 10.1002/pros.20786. https://doi.org/10.1002/pros.20786. [DOI] [PMC free article] [PubMed] [Google Scholar]
- 25.Porkka KP, Pfeiffer MJ, Waltering KK, Vessella RL, Tammela TL, Visakorpi T. MicroRNA expression profiling in prostate cancer. Cancer Res. 2007;67:6130–5. doi: 10.1158/0008-5472.CAN-07-0533. https://doi.org/10.1158/0008-5472.CAN-07-0533. [DOI] [PubMed] [Google Scholar]
- 26.Tefik T, Şanlı Ö, Esen T. Klinik pratikte prostat biyopsi endikasyonu için PSA’nın kullanımı. In: Baltacı S, editor. Ürolojide Yeni Ufuklar. Ankara: Ayrıntı Basımevi; 2010. pp. 19–32. [Google Scholar]
- 27.Watahiki A, Wang Y, Morris J, Dennis K, O’Dwyer HM, Gleave M, et al. MicroRNAs associated with metastatic prostate cancer. PLoS ONE. 2011;6:e24950. doi: 10.1371/journal.pone.0024950. https://doi.org/10.1371/journal.pone.0024950. [DOI] [PMC free article] [PubMed] [Google Scholar]
- 28.Hellwinkel OJC, Sellier C, Sylvester YJ, Brase JC, Isbarn H, Erbersdobler A, et al. A cancer-indicative microRNA pattern in normal prostate tissue. Int J Mol Sci. 2013;14:5239–49. doi: 10.3390/ijms14035239. https://doi.org/10.3390/ijms14035239. [DOI] [PMC free article] [PubMed] [Google Scholar]
- 29.Watahiki A, Macfarlane RJ, Gleave ME, Crea F, Wang Y, Helgason CD, et al. Plasma miRNAs as biomarkers to identify patients with castration-resistant metastatic prostate cancer. Int J Mol Sci. 2013;14:7757–70. doi: 10.3390/ijms14047757. https://doi.org/10.3390/ijms14047757. [DOI] [PMC free article] [PubMed] [Google Scholar]
- 30.Mahn R, Heukamp LC, Rogenhofer S, von Ruecker A, Müller SC, Ellinger J. Circulating microRNAs (miRNA) in serum of patients with prostate cancer. Urology. 2011;77:1265 e9–e16. doi: 10.1016/j.urology.2011.01.020. [DOI] [PubMed] [Google Scholar]
- 31.Peltier HJ, Latham GJ. Normalization of microRNA expression levels in quantitative RT-PCR assays: identification of suitable reference RNA targets in normal and cancerous human solid tissues. RNA. 2008;14:844–52. doi: 10.1261/rna.939908. https://doi.org/10.1261/rna.939908. [DOI] [PMC free article] [PubMed] [Google Scholar]
- 32.Bonci D, Coppola V, Musumeci M, Addario A, Giuffrida R, Memeo L, et al. The miR-15a-miR-16-1 cluster controls prostate cancer by targeting multiple oncogenic activities. Nat Med. 2008;14:1271–7. doi: 10.1038/nm.1880. https://doi.org/10.1038/nm.1880. [DOI] [PubMed] [Google Scholar]
- 33.Schaefer A, Jung M, Miller K, Lein M, Kristiansen G, Erbersdobler A, et al. Suitable reference genes for relative quantification of miRNA expression in prostate cancer. Exp Mol Med. 2010;42:749–58. doi: 10.3858/emm.2010.42.11.076. https://doi.org/10.3858/emm.2010.42.11.076. [DOI] [PMC free article] [PubMed] [Google Scholar]
- 34.Tong AW, Fulgham P, Jay C, Chen P, Khalil I, Liu S, et al. MicroRNA profile analysis of human prostate cancers. Cancer Gene Therapy. 2009;16:206–16. doi: 10.1038/cgt.2008.77. [DOI] [PubMed] [Google Scholar]
- 35.Saini S, Majid S, Yamamura S, Tabatabai L, Suh SO, Shahryari V, et al. Regulatory role of miR-203 in prostate cancer progression and metastasis. Clin Cancer Res. 2011;17:5287–98. doi: 10.1158/1078-0432.CCR-10-2619. https://doi.org/10.1158/1078-0432.CCR-10-2619. [DOI] [PubMed] [Google Scholar]
- 36.Özen M, Creighton CJ, Ozdemir M, Ittmann M. Widespread deregulation of microRNA expression in human prostate cancer. Oncogene. 2008;27:1788–93. doi: 10.1038/sj.onc.1210809. https://doi.org/10.1038/sj.onc.1210809. [DOI] [PubMed] [Google Scholar]
- 37.Schaefer A, Jung M, Mollenkopf HJ, Wagner I, Stephan C, Jentzmik F, et al. Diagnostic and prognostic implications of microRNA profiling in prostate carcinoma. Int J Cancer. 2010;126:1166–76. doi: 10.1002/ijc.24827. [DOI] [PubMed] [Google Scholar]
- 38.Shi XB, Xue L, Ma AH, Tepper CG, Kung HJ, White RW. miR-125b promotes growth of prostate cancer xenograft tumor through targeting proapoptotic genes. Prostate. 2011;71:538–49. doi: 10.1002/pros.21270. https://doi.org/10.1002/pros.21270. [DOI] [PMC free article] [PubMed] [Google Scholar]
- 39.Szczyrba J, Loprich E, Wach S, Jung V, Unteregger G, Barth S, et al. The microRNA profile of prostate carcinoma obtained by deep sequencing. Mol Cancer Res. 2010;8:529–38. doi: 10.1158/1541-7786.MCR-09-0443. https://doi.org/10.1158/1541-7786.MCR-09-0443. [DOI] [PubMed] [Google Scholar]


