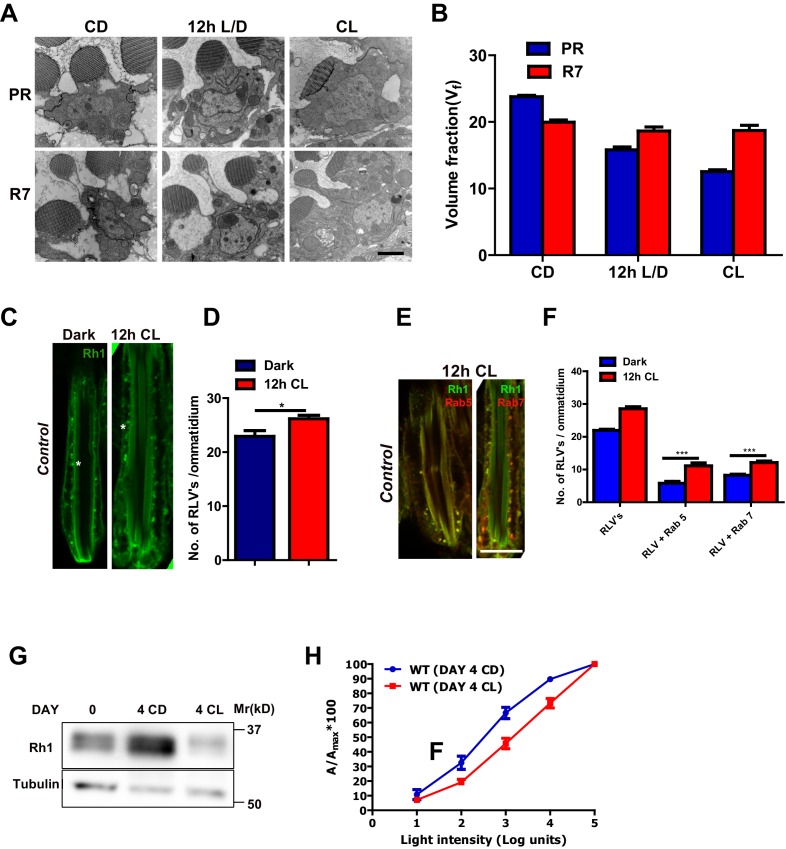
Figure 1. Rhabdomere size regulation during illumination in Drosophila photoreceptors.
(A) TEM images of single rhabdomere from wild-type photoreceptors (PRs) of 2-day-old flies post-eclosion reared in constant dark (CD), 12 hr light, 12 hr dark (12 h L/D) and constant light (CL). Scale bar: 1 µm. (B) Quantification of rhabdomere volume in PRs reared in various conditions. The peripheral PRs represent R1 to R6 rhabdomeres. The X-axis represents the rearing condition and the Y-axis represents the volume fraction (Vf) of rhabdomere expressed as a % with respect to total cell volume. n = 90 rhabdomeres taken from three separate flies. (C) Longitudinal section (LS) of retinae from control stained with rhodopsin 1 (Rh1) antibody. Flies were dissected after 0–6 hr (day 0) and 12 hr of bright light illumination (12 h CL) post-eclosion. Scale bar: 5 µm. (D) Quantification of RLVs from LS of retinae from control. The X-axis represents the time point and rearing condition. Y-axis shows the number of RLV’s per ommatidium. n = 10 ommatidia taken from three separate preps. (E) LS of retinae from control stained with Rh1 and Rab5; Rh1 and GFP (for Rh1>GFP::Rab7). Rearing condition is same as mentioned in (panel C). Scale bar: 5 µm. (F) Quantification of RLVs from LS of retinae from control. The X-axis represents the population of vesicles positive for mentioned protein. Y-axis shows the number of RLVs per ommatidium. n = 10 ommatidia taken from three separate preps. (G) Western blot from head extracts of control flies reared in various conditions as indicated on the top of the blot. The blot was probed with antibody to rhodopsin. Tubulin levels were used as a loading control. (H) Intensity response function of the light response from 4-day-constant-light (DAY 4 CL) and 4-day-constant-dark (DAY 4 CD) old control flies. The X-axis represents increasing light intensity in log units and Y-axis the peak response amplitude at each intensity normalized to the response at the maximum intensity. n=separate flies. Data are presented as mean ± SEM.

