

Abstract
In eukaryotic DNA, cytosine can be enzymatically modified to yield up to four epigenetic base variants. DNA methyltransferases convert cytosine to 5-methylcytosine (mC), which plays critical roles in gene regulation during development. Ten-eleven translocation (TET) enzymes can sequentially oxidize mC to three products: 5-hydroxymethylcytosine (hmC), 5-formylcytosine (fC), and 5-carboxylcytosine (caC). These oxidized bases have been found in numerous mammalian cell types, where they potentially carry out independent epigenetic functions and aid in DNA demethylation. To gain insight into the mechanisms and functions of TET family enzymes, rigorous approaches are needed to quantify genomic cytosine modifications in cells and track TET enzyme activity in vitro. Here, we present tools developed by our lab and others to report on each of the five forms of cytosine (unmodified, mC, hmC, fC, and caC) with high specificity and sensitivity. We provide detailed protocols for qualitative and quantitative analysis of cytosine modifications in genomic DNA by dot blotting and LC-MS/MS. We then describe methods for generating synthetic oligonucleotide substrates for biochemical studies, provide optimized reaction conditions, and introduce several chemoenzymatic assays, as well as HPLC, mass spectrometry, and scintillation counting methods to quantify cytosine modifications in vitro. These approaches enable mechanistic studies of TET activity, which are key to understanding the role of these enzymes in epigenetic regulation.
1. INTRODUCTION
Ten-eleven translocation (TET) enzymes are Fe(II)/α-ketoglutarate-dependent dioxygenases that are increasingly tied to diverse biological and pathological processes, including cellular differentiation, reprogramming, and malignancy (Kohli & Zhang, 2013; Tahiliani et al., 2009). There are three mammalian TET isoforms (TET1, 2, and 3) that are all capable of sequentially oxidizing 5-methylcytosine (mC) to 5-hydroxymethylcytosine (hmC), 5-formylcytosine (fC), and 5-carboxylcytosine (caC) (He et al., 2011; Ito et al., 2011). Stepwise oxidation provides a feasible pathway for DNA demethylation, as the highly oxidized bases fC and caC can be selectively removed by thymine DNA glycosylase (TDG), resulting in an abasic site that can be repaired to regenerate unmodified C (He et al., 2011; Maiti & Drohat, 2011). Emerging evidence also indicates that all three oxidized mC bases (ox-mCs) can exist as stable epigenetic marks with potentially independent functions (Bachman et al., 2014, 2015; Iurlaro et al., 2013; Spruijt et al., 2013). As TET biology has expanded, there has been a need for robust assays to detect, localize, and quantify these rare genomic modifications (Fig. 1). Numerous chemical methods now exist for quantification and base-resolution sequencing of ox-mC bases in a variety of cell types (Booth, Raiber, & Balasubramanian, 2015; Song, Yi, & He, 2012; Yardimci & Zhang, 2015). At the same time, rigorous biochemical assays are needed to address open mechanistic questions. Early approaches to the study of TET enzymes have been reviewed previously (Shen & Zhang, 2012). Here, we present the most current in vivo and in vitro methods developed by our lab and others to distinguish between the modified forms of cytosine and measure TET enzyme activity with high sensitivity.
Fig. 1.
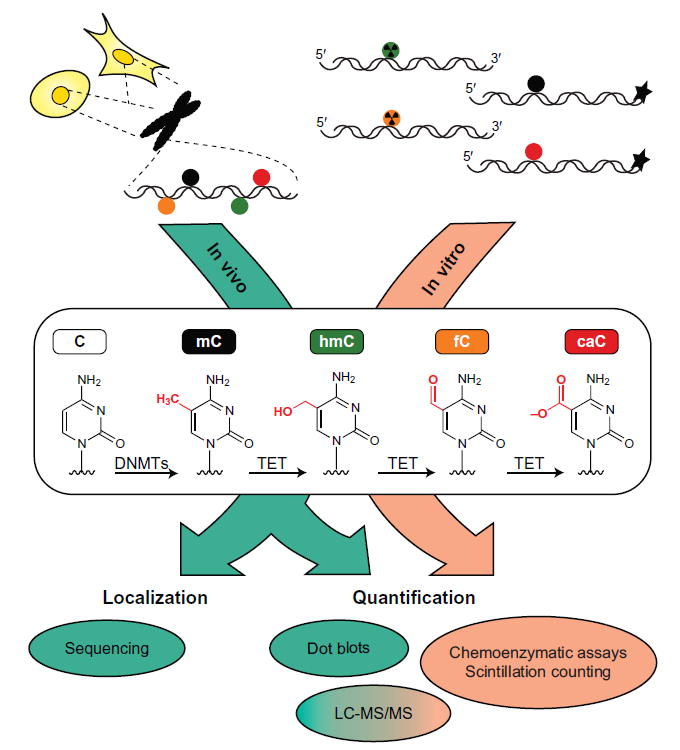
Current methods for static analysis of TET activity via modified cytosines in vivo and in vitro.
2. ANALYSIS OF CYTOSINE MODIFICATIONS IN CELLULAR DNA
2.1 Preparation of Genomic DNA from TET-Transfected Cells
One major area of study centers on the comparative roles of the three TET isoforms and their mutants, many of which have been catalogued in human diseases and may provide key insights into enzyme mechanisms. HEK293T cells provide a convenient overexpression system for assessing the relative activities of TET constructs. HEK293T cells have low levels of endogenous TET proteins and support efficient transfection and high levels of over-expression. Available constructs include full-length (FL) and catalytic domains (CD) of mouse and human TET1, 2, and 3 cloned into standard mammalian overexpression vectors. Our lab and others have demonstrated activity from the following: hTET1-FL (residues 1–2136), hTET1-CD (1418–2136), hTET2-FL (1–2002), hTET2-CD (1129–2002), hTET3-FL (1–1660), mTet1-FL (1–2007), mTet1-CD (1367–2039), mTet2-FL (1–1912), mTet2-CD (1042–1921), mTet3-FL (1–1668), and mTet3-CD (697–1668) (He et al., 2011; Ito et al., 2010; Tahiliani et al., 2009). In addition, Hu et al. crystallized a truncated form of the hTET2 catalytic domain (hTET2-CS, 1129–1936 ∆ 1481–1843) and demonstrated activity similar to the full-length construct (Hu et al., 2013). Common negative controls include the corresponding empty expression vector or mutation of the iron-binding HxD motif in the catalytic domain that renders TET inactive.
We use the following protocol to overexpress TET constructs. First, culture HEK293T cells in Dulbecco’s Modified Eagle Medium with GlutaMAX (Thermo Fisher Scientific) and 10% fetal bovine serum (Sigma). When cells are 70–90% confluent, transfect using Lipofectamine 2000 (Thermo) according to the manufacturer’s protocol. Change media 24 h posttransfection, harvest cells by trypsinization at 48 h, and resuspend pellets in phosphate buffered saline. A sample of transfected cells can be set aside for Western blotting to evaluate protein expression (see Section 2.2). Purify genomic DNA (gDNA) using the DNeasy Blood & Tissue Kit (Qiagen), including addition of RNase A where specified in the manufacturer’s protocol. Note that this kit is also adaptable for extracting gDNA from tissue specimens and cells that express endogenous TET enzymes.
2.2 Qualitative Analysis by Dot Blotting
Dot blots are commonly used to probe for modified bases in gDNA. DNA is denatured to expose the bases, spotted onto an absorbent membrane, and probed with antibodies against each of the four cytosine modifications. Dot blots offer a clear visual result and can be performed using either serial dilutions or single concentrations of DNA. We consider the former to be semiquantitative, while the latter is only qualitative but still particularly useful for screening a large number of samples. Dot blotting also works for plasmids but is generally not well suited for short oligonucleotides, likely because these do not adhere consistently to membranes.
The first step is to determine the appropriate amount of DNA for blotting, considering the amount of expected modifications. For gDNA from HEK293T cells overexpressing TET, load 400 ng of gDNA into each well of a Bio-Dot microfiltration apparatus (Bio-Rad). Calculate the total amount of DNA needed (based on number of blots and number of serial dilutions) and dilute to 10 ng/μL in TE buffer (10 mM Tris–Cl, pH 8.0, 1 mM EDTA). Add 1/4 volume of 2 M NaOH/50 mM EDTA. Denature the DNA at 95°C for 10 min, transfer quickly to ice, and add 1 volume of ice-cold 2 M ammonium acetate to stabilize single strands. Serial dilutions may be performed at this point into TE buffer. Meanwhile, prepare membranes for blotting; we have found that Sequi-Blot PVDF membranes (Bio-Rad) give cleaner results than nitrocellulose. Wet membranes in methanol and equilibrate in TE buffer; then, assemble the dot blotting apparatus, taping off any unused wells. Wash each well with 400 μL TE and draw through with gentle vacuum. Purge any air bubbles in the wells, as these can interfere with washing and spotting DNA, and release the vacuum gently to avoid regurgitation that can cross-contaminate wells. Apply 100 μL of DNA samples at the desired dilutions and wash with another 400 μL of TE. Carefully place the membranes into 50 mL conical tubes for blotting. Note that replicate membranes are needed for each separate mC, hmC, fC, and caC blot.
The blotting procedure begins with blocking for 2 h in TBST buffer (50 mM Tris–Cl, pH 7.6, 150 mM NaCl, 0.5% Tween 20) with 5% (w/v) milk at room temperature. Then, wash three times with TBST and incubate at 4°C overnight with primary antibodies against each modified cytosine (Active Motif offers mouse monoclonal mC and rabbit polyclonal hmC, fC, and caC antibodies). We use the following antibody dilutions in 5% milk/TBST: 1:5000 mC; 1:10,000 hmC; 1:5000 fC; and 1:10,000 caC. Volumes should be enough to cover the membrane evenly, and solutions should be poured off cleanly between steps. Wash the blots three times with TBST for 5 min each and incubate with secondary 1:2000 goat anti-mouse IgG-HRP or 1:5000 goat anti-rabbit IgG-HRP (Santa Cruz Biotechnology) at room temperature for 2 h. Wash three times again and, just before imaging, apply Immobilon Western Chemiluminescent HRP Substrate (Millipore) evenly over the entire blot. Expose on an imager with chemiluminescent detection capabilities (we use a Fujifilm LAS-1000), taking care to smooth the blot over the imaging surface and remove air bubbles and excess HRP substrate. As positive and negative controls for this optimized protocol, we typically use gDNA from cells transfected with WT hTET2-CD or empty vector, respectively. Fig. 2 shows an example of dot blotting results for select TET constructs.
Fig. 2.
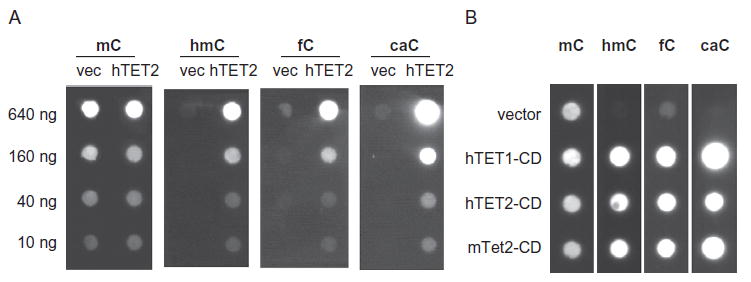
Representative dot blots from analysis of gDNA from transfected HEK293T cells. Shown are (A) serial dilutions of gDNA from cells transfected with either empty expression vectors or hTET2-CD and (B) dot blots on 400 ng of gDNA from HEK293T cells transfected with empty expression vector, hTET1-CD, hTET2-CD, or mTet2-CD.
2.3 Quantitative Analysis by LC-MS/MS
To quantify genomic levels of cytosine modifications more rigorously, we favor liquid chromatography tandem mass spectrometry (LC-MS/MS). Several alternatives exist to detect global cytosine modifications, including antibody-based or chemoenzymatic assays (Booth et al., 2015; Song et al., 2012), but we focus on LC-MS/MS as a direct, reliable, and flexible assay that can quantify diverse modifications simultaneously. A host of sequencing methods have also been developed to localize specific modifications at base resolution; these methods are not covered in this chapter, as they have been thoroughly reviewed elsewhere (Booth et al., 2015; Yardimci & Zhang, 2015). Here, we discuss the protocols we developed for micro- and nanoscale analysis of nucleosides by LC-MS/MS, though we note that multiple methods and instruments have been described (Bachman et al., 2014; Pfaffeneder et al., 2014; Tsuji et al., 2014), and optimization for each system will be unique.
We use an Agilent 6460 triple quadrupole mass spectrometer with Agilent 1200 Series HPLC and Supelcosil LC-18-S reverse phase analytical column (5 μm particle size, 2.1 mm ×25 cm, Sigma) (Fig. 3A). This system offers a good starting platform for nucleoside analysis, is well suited for most applications, and is likely more accessible for most researchers than the nanoscale setup described later. To prepare samples, concentrate up to 10 μg of purified gDNA by ethanol precipitation and, in a total of 20 μL, degrade the DNA to component nucleosides with 10 U DNA Degradase Plus (phosphodiesterase and phosphatase cocktail available from Zymo Research) in 1× DNA Degradase Buffer (Zymo). Incubate this mixture at 37°C overnight, then dilute 10-fold into 0.1% formic acid, since on-column retention of caC in particular requires pH adjustment.
Fig. 3.
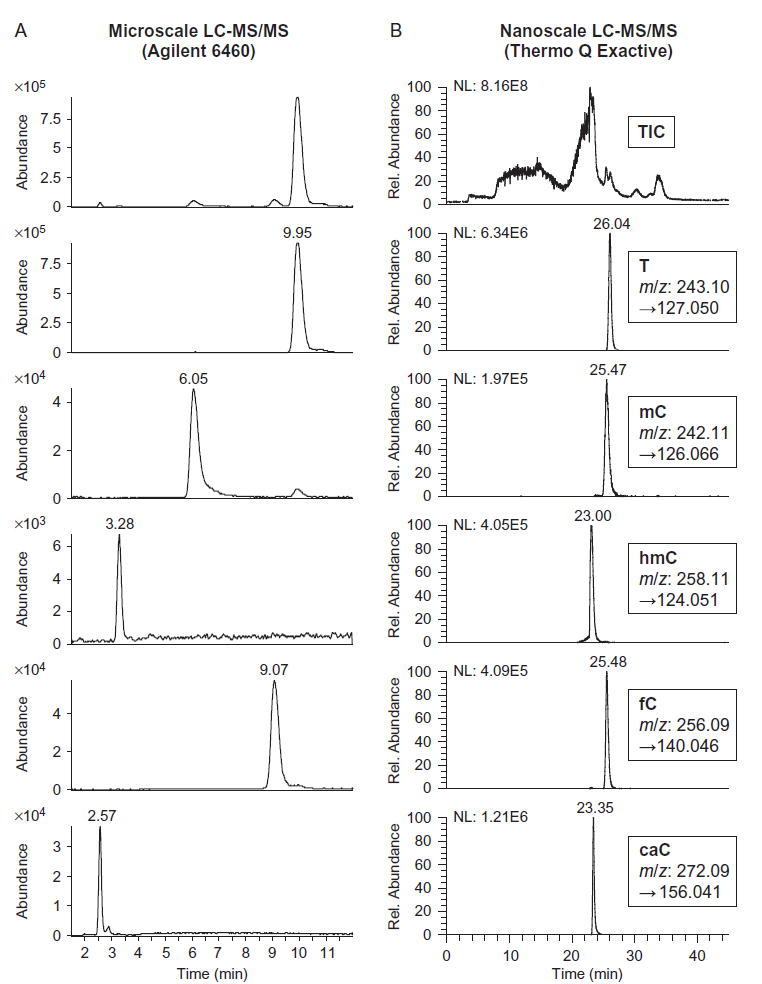
Examples of LC-MS/MS analysis of DNA nucleosides. Protocols can be applied to genomic DNA or oligonucleotide substrates. Shown are traces from oligonucleotide substrates containing a single mC that were treated with hTET2-CS in vitro, degraded to nucleosides, and analyzed by (A) HPLC with tandem Agilent 6460 triple quadrupole mass spectrometer or (B) nano-LC with tandem Thermo Q Exactive hybrid quadrupole-orbitrap mass spectrometer. From top to bottom are the total ion current (TIC) and MS2 chromatograms for T, mC, hmC, fC, and caC deoxyribonucleosides, along with retention times and mass transitions.
Equilibrate the HPLC column to 50°C in Buffer A1 (5 mM ammonium formate, pH 4.0). Load 2 μL (up to 0.1 μg) of the nucleoside mixture and separate by gradient elution at a flow rate of 0.5 mL/min: 0–5 min, 0% Buffer B1 (4 mM ammonium formate, pH 4.0, 20% (v/v) methanol); 5–12 min, 0–10% B1; 12–12.5 min, 10–100% B1; 12.5–20 min, 100% B1; 20–20.5 min, 100–0% B1; and 20.5–28 min, 0% B1. Note that this gradient is optimized for efficient separation of all modified cytosine nucleosides, but the most hydrophobic bases, such as adenosine, elute at >10% B1. Set downstream positive ion mode electrospray ionization for gas temperature of 175°C, gas flow of 10 L/min, nebulizer at 35 psi, sheath gas temperature of 300°C, sheath gas flow of 11 L/min, capillary voltage of 2000 V, and fragmentor voltage of 70. Collect MS2 scans on the following mass transitions: mC 242.11 → 126.066 m/z; hmC 258.11 → 142.061 and 124.051; fC 256.09 → 140.046; caC 272.09 → 156.041 (A, C, G, and, T are optional but can be useful as a loading control: A 252.11→136.062; C 228.10→112.051; G 268.10 → 152.057; and T 243.10 → 127.050). Optimized collision energies are 10 for mC, fC, and T; 15 for caC; and 25 for hmC. For quantification, generate standard curves from nucleosides (Berry & Associates) ranging from approximately 5 μM to 10 pM; many isotopically labeled nucleosides are available as internal standards. Fit all peak areas to the standard curve to determine amounts of each modified cytosine in the gDNA sample.
This method attains low-femtomolar and high-attomolar range detection limits, allowing for quantification of 1 modification in 105–106 of all cytosines. This provides excellent detection of rare oxidized bases, especially in HEK293T cells overexpressing TET, though quantifying fC and caC in physiological samples remains a challenge. However, the triple quadrupole system has two notable limitations: the need for a large electron multiplier voltage and low mass resolution. At best, the Agilent 6460 differentiates only 0.7 amu, which can present a challenge if analytes are 1 amu or less apart, as might occur in some stable isotope labeling studies.
For analysis of isotopically labeled cytosines, we use nano-LC in tandem with a Q Exactive hybrid quadrupole-orbitrap mass spectrometer (Thermo Scientific) (Fig. 3B). A key advantage to this system is the very high mass resolution, which improves signal-to-noise and clearly distinguishes between isotopes with 1 amu mass difference. Detection limits for modified nucleosides are generally in the low-femtomole range. However, the system is prone to clogging and inconsistent electrospray, so samples and column fittings should be prepared with care.
We make columns from fused-silica tubing (New Objective) with a frit at one end: dip the column into a 400 μL mixture of 1:3 formamide:KASIL 1624 potassium silicate solution (PQ Corporation), let polymerize at 100°C overnight, and trim to ~3 mm. Using a pressure injection cell, pack a 150 μm × ~15 cm precolumn and 100 μm × ~25 cm analytical column with Supelcosil LC-18-S resin (Sigma). Connect columns to an Easy-nLC 1000 (Thermo) with a two-column setup, and add a 10 μm SilicaTip emitter (New Objective). (Alternatively, nanospray tips can be generated with a laser-based micropipette puller (Sutter Instrument), which eliminates the need for frits and significantly reduces dead volume, but this process is delicate and the setup can clog more easily.) Equilibrate the precolumn and analytical column in 5–10 column volumes of Buffer A2 (0.1% formic acid in H2O) at a constant pressure of 275 bar.
Prepare samples as described earlier and inject 1 μL (0.05 μg) onto the LC-MS system. Set a sample loading step to send 5 μL of Buffer A2 through the sample loop to the precolumn at a constant pressure of 275 bar; this way, the sample is bound to the precolumn and desalted by sending the flow-through to waste. Next, run the gradient at a flow rate of 300 nL/min: 0–2 min, 0% Buffer B2 (0.1% formic acid in acetonitrile); 2–7 min, 0–10% B2; 7–37 min, 10–40% B2; 37–39 min, 40–70% B2; and 39–45 min, 70% B2. Perform tandem mass spectrometry in positive ion mode nanospray ionization with spray voltage of 2.9 kV, capillary temperature of 275°C, and normalized collision energy of 35%. Mass transitions and data analysis are the same as described earlier for the microscale setup. These LC-MS/MS methods, while technically challenging, are broadly applicable for sensitive quantification of cytosine modifications in gDNA. Moreover, in the next section, we will return to these methods as a powerful tool for quantifying the results of TET reactions on oligonucleotides in vitro.
3. ANALYSIS OF CYTOSINE MODIFICATIONS IN VITRO
3.1 Purification of TET Enzymes from Sf9 Insect Cells
To prepare recombinant TET enzymes for biochemical analysis, we and most other groups use a baculovirus expression system in Sf9 insect cells. TET constructs are typically cloned into a pFastBac1 vector containing a FLAG-tag at the N-terminus. Biochemical studies to date have largely relied on the catalytic domain constructs, as these retain the activity of the full-length protein but are generally obtained in higher purity and are more stable in vitro. Bacmid preparation and transfection were previously described in detail (Shen & Zhang, 2012). We express proteins for only 24 h, which we find minimizes the formation of truncation products. Cells are collected by centrifugation and the pellet is stored at −80°C until ready for purification. Alternative strategies have been described for expressing and purifying TET proteins from HEK293T cells and, in the crystal structure studies, from Escherichia coli (Hu et al., 2013, 2015); however, we favor Sf9 cells as a relatively straightforward way to obtain pure and active enzyme at intermediate yield.
We adapted a simple protocol for FLAG-based affinity purification of TET enzymes from Sf9 cells; the volumes below are for purification from a 500 mL culture. Resuspend the cell pellet in 10 mL of lysis buffer (50 mM HEPES, pH 7.5, 300 mM NaCl, 0.2% (v/v) NP-40) with cOmplete, EDTA-free Protease Inhibitor Cocktail (Roche, 1 tablet/10 mL) and 10 U/mL of Benzonase Nuclease (Millipore). To lyse the cells, freeze the cell suspension overnight at −20°C, thaw the following morning on ice, and pass through both a 20-gauge and then a 25-gauge needle. For larger volumes, a microfluidizer or sonicator is a good alternative. Clear the lysate by centrifugation at 20,000 × g for 20 min, collect the supernatant, and pass it through a 0.2 μm syringe filter. Next, prepare a 500 μL column of anti-FLAG M2 affinity gel (Sigma) per manufacturer instructions and equilibrate in lysis buffer. Apply the filtered lysate twice over the column under gravity flow. Wash the protein-bound column three times with 10 mL of wash buffer (50 mM HEPES, pH 7.5, 150 mM NaCl, 15% (v/v) glycerol). To elute the protein, apply 500 μL of wash buffer containing 100 μg/mL 3 × FLAG peptide (Sigma) to the column, incubating for 5–10 min before collecting the fraction. Collect until no protein is detected by Bio-Rad Protein Assay and SDS-PAGE. Pool fractions, add DTT to 1 mM, aliquot, and store at −80°C. By this method, we are able to obtain highly pure, active TET proteins with minimal steps.
3.2 Synthesis and Isotopic Labeling of TET Substrates
Our lab employs a variety of techniques to synthesize substrates for in vitro TET reactions and to label the substrates with fluorophores and/or heavy isotopes to enable sensitive detection and quantification. In general, we use DNA oligonucleotides 12–35 nt in length, containing a single TET substrate (mC, hmC, or fC) in a CpG context (although useful HPLC-based assays for substrates as short as 4–6 nt have also been developed; Kizaki & Sugiyama, 2014). TET enzymes exhibit a strong preference for CpGs (Hu et al., 2013) but are thought to be less sensitive to surrounding sequences (Yu et al., 2012). Importantly, the self-complementarity of CpGs requires special considerations, since one or both strands of a DNA duplex can contain a TET substrate. This consideration makes it important to control the identity of the top and bottom strands independently, and if both strands are set up to contain a substrate, assays must be designed to distinguish reactivity on each strand.
For most assays, we synthesize oligonucleotides in-house on an Applied Biosystems 394 DNA/RNA synthesizer. All four modified cytosines are now available (Glen Research) and compatible with standard phosphoramidite synthesis protocol, although fC requires postsynthetic processing to obtain the final formyl group from the precursor. Custom-made oligonucleotides are also available from Integrated DNA Technologies (IDT) and the W.M. Keck Biotechnology Resource Laboratory at Yale University, among other facilities. To facilitate tracking of the designated “top” strand, we typically attach 6-carboxyfluorescein (6-FAM) or alternative fluorophores to either the 5'- or 3' -end of the modified oligonucleotide. This can be done during synthesis or, for 3'-end labeling, can also be done after purification using terminal transferase enzymes and fluorophore-conjugated ddUTP analogs. Importantly, neither the identity nor location of the fluorescent tag alters the reactivity of TET on these substrates. As the first step toward differentiating duplexed strands, we leave the bottom strand unlabeled.
Starting with single strands, the top and bottom strands can be selected to address the experimental goals. In most cases, we use the FAM-labeled top strand containing a single TET substrate and, to ensure that all substrates are double stranded, anneal a 1.1- to 1.5-fold excess of unlabeled bottom strand containing unmodified C, so that the resulting DNA duplex contains only one reactive site. Typically, the CpG is embedded in a restriction site for MspI to allow for downstream analysis (see Section 3.3). Annealing is performed in a thermocycler: mix the top and bottom strands, heat at 95°C for 5 min, then cool slowly by decreasing steps of 5°C for 30 s per step. These duplexes can be added directly to a TET reaction, and reaction products can be visualized by fluorescent detection after separation by denaturing polyacrylamide gel electrophoresis (PAGE), as described in the next sections.
Fluorescence-based assays are well suited for addressing many important mechanistic questions but have limits of detection in the high-femtomole range. To increase the sensitivity of detection for cases of low product formation (eg, in kinetic studies), one previous strategy has been to radiolabel the 5'-end of full-length substrates with T4 polynucleotide kinase (New England Biolabs); however, similar to fluorescent labeling, this method only reports on the activity of a single strand. To measure activity on both strands independently, we developed enzymatic methods to generate substrates where the 5-methyl group of mC is labeled with either 13C2H3 or 14CH3, which permits several avenues for sensitive and strand-specific detection of product formation (see Section 3.4).
The isotopically labeled substrates are generated enzymatically using the CpG methyltransferase (Fig. 4A). For 13C2H3 labeling, we start with [13C2H3]-l-methionine (Sigma) and, in a single reaction mixture, enzymatically generate S-[13C2H3-Me]-adenosyl-l-methionine ([13C2H3]-SAM) in situ and simultaneously transfer the methyl moiety from SAM to DNA. For 14C labeling, we simply start with S-[14C-Me]-adenosyl-l-methionine ([14C]-SAM) from Perkin Elmer and transfer the methyl group to a CpG-containing oligonucleotide using CpG methyltransferase (NEB). Notably, CpG methyltransferase acts on double-stranded DNA, so we first anneal complementary oligonucleotides, both containing an unmodified CpG, and purify methylated top and bottom strands separately by HPLC.
Fig. 4.
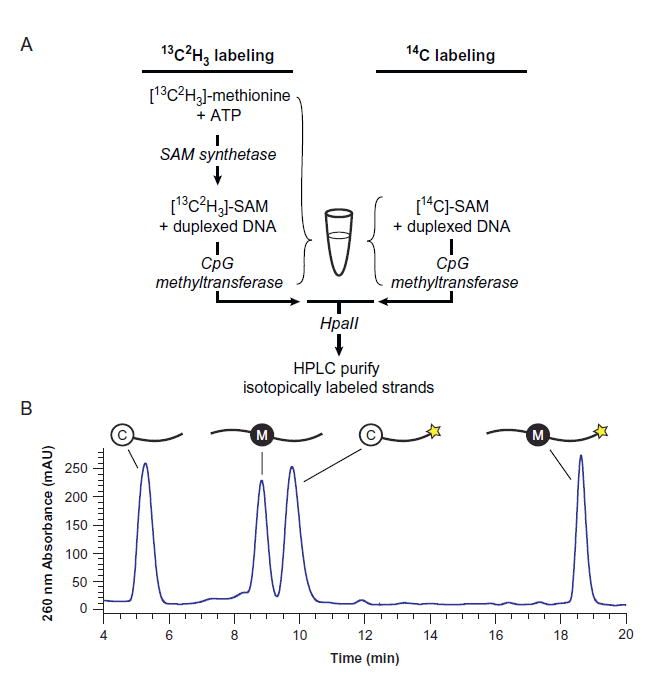
Synthesis of isotopically labeled substrates. (A) Preparation of oligonucleotide substrates containing isotopically labeled mC. For 13C2H3 labeling (left), [13C2H3]-S-adenosylmethionine is enzymatically generated and simultaneously consumed in a single reaction mixture, yielding oligonucleotide duplexes containing [13C2H3]-mC. For 14CH3 labeling (right), [14C]-SAM is commercially available, requiring only CpG methyltransferase M.SssI to generate DNA duplexes containing [14C]-mC. Unmethylated strands are digested by the methylation-sensitive restriction enzyme HpaII, and the full-length methylated oligonucleotides are purified by HPLC. (B) Representative HPLC chromatogram showing the HpaII-digested products of 13C2H3 or 14CH3 labeling. Complementary strands are distinguished by a 3’-FAM label (star) on the top strand, which increases on-column retention and is detectable by 490 nm absorbance (not shown).
For the generation of substrates with a 13C2H3-modified mC, first purify recombinant E. coli SAM synthetase as described (Ottink, Nelissen, Derks, Wijmenga, & Heus, 2010). The in situ generation of [13C2H3]-SAM is initiated by reacting 1 mg/mL SAM synthetase with 1 mM [13C2H3]-l-methionine and 2 mM ATP in 1× NEB Buffer 2 (10 mM Tris–Cl, pH 7.9, 50 mM NaCl, 10 mM MgCl2, 1 mM DTT). Incubate this mixture at 37°C for 15 min, then add 4× volume of duplexed DNA (final concentration 10 μM) and the CpG methyltransferase M.SssI (1:20 total reaction volume, 1000 U/mL) (NEB) in 1× NEB Buffer 2. The simultaneous SAM synthesis and CpG [13C2H3]-methylation is carried out for an additional 5 h at 37°C.
For the generation of substrates with a [14C]-mC label, with [14C]-SAM supplied at ~350 μM in ~500 μL, prepare a reaction containing 35 μM [14C]-SAM, 5.8 μM duplexed DNA, and 224 U/mL CpG methyl-transferase (M.SssI), incubating at 37°C for 4 h. Set aside a small sample of the reaction to determine specific radioactivity for liquid scintillation counting (LSC). Extract DNA from the 13C2H3- and 14C-labeling reactions by ethanol precipitation, resuspend the dried pellet in H2O, and desalt with illustra MicroSpin G-25 Columns (GE Healthcare Life Sciences) equilibrated in water. The resulting oligonucleotide mixture contains methylated products and unmethylated substrate, with and without FAM labels. To digest residual unmethylated substrates, treat with 5000 U/mL of HpaII (NEB) in 1× CutSmart Buffer (NEB) at 37°C overnight. Ethanol precipitate again and dissolve the dried pellet in Buffer A3 (100 mM triethylamine acetate (TEAA), pH 7). Purify by ion-pairing HPLC over an Agilent Zorbax Eclipse Plus C18 reverse phase column (3.5 μm particle size, 4.6 mm × 10 cm); we use an Agilent Infinity 1260 Quaternary Pump VL with 1260 FC-AS fraction collector. Equilibrate the column to 65°C in 65% Buffer A3 and 35% Buffer B3 (50% (v/v) methanol/100 mM TEAA, pH 7), and separate over a 20 min gradient from 35% to 45% Buffer B3 at a flow rate of 1 mL/min. Four major peaks should be observed (along with smaller digestion products): (1) HpaII-digested, unmethylated bottom strand without FAM; (2) full-length, methylated bottom strand without FAM; (3) HpaII-digested, unmethylated top strand with FAM; and (4) full-length, methylated top strand with FAM (Fig. 4B). Collect fractions (2) and (4), the methylated products±FAM, and lyophilize. These purified [13C2H3]-mC or [14C]-mC oligonucleotides can then be duplexed to complementary strands for use in various TET activity assays. For basic analysis of reactivity at one CpG site, we use a complementary strand with an unmodified CpG. Alternatively, the complementary strand can contain mC or ox-mC bases with natural isotope composition, allowing for strand-specific measurements of activity when both strands contain TET substrates.
Finally, some experiments may benefit from longer substrates with multiple targets, rather than simple oligonucleotides. In this case, we use PCR to generate amplicons containing mC, hmC, or fC at all cytosines using ox-mC dNTPs that are commercially available (Trilink). Set up a 50 μL reaction under the following conditions, which have worked well for the majority of our substrates: 1× PCR buffer (20 mM Tris–Cl, pH 8.4, 50 mM KCl), 1.5 mM MgCl2, 200 μM of each dNTP (including the desired modified cytosine and no natural cytosine), 1 μM of forward and reverse amplification primers, 1 ng of template DNA (containing unmodified cytosines), and 5 U of Taq polymerase (Invitrogen). When generating mC-containing substrates, add 5% DMSO to aid in denaturation. The thermocycler settings will depend upon the polymerase, nature of the substrate, primer length, etc., but most standard settings translate to these conditions. Amplification of DNA containing caC is not efficient under these conditions, but an alternative strategy using Phusion polymerase has been reported (Neri et al., 2015). Run the entire reaction on an agarose gel and excise the desired band. Use the ZymoClean Gel DNA Recovery Kit (Zymo) to purify the amplicons.
3.3 Chemoenzymatic Activity Assays on Full-Length Oligonucleotides
Despite the diversity of substrates, TET reaction conditions are largely the same for all applications. Our optimized conditions are as follows: 50 mM HEPES, pH 6.5, 100 mM NaCl, 1 mM α-ketoglutarate, 75 μM ammonium iron(II) sulfate (Sigma), 1 mMDTT, and 2 mM sodium ascorbate. The concentration of DNA substrate and TET protein varies based on the experimental goals (see examples later). Importantly, both the α-ketoglutarate and Fe(II) must be fresh, and Fe(II) should be added immediately prior to the start of the reaction to minimize oxidation to Fe(III). Sodium ascorbate is not essential but increases activity, likely by helping to keep Fe(II) in the reduced state (Blaschke et al., 2013; Yin et al., 2013). We note minor differences between our methods and those used successfully by other groups. First, we performed a pH titration for our enzymes and found pH 6.5 to be optimal, with decreasing activity at higher pH; however, other groups routinely perform reactions at pH 8.0 (Hu et al., 2015). ATP has also been reported to stimulate TET activity (He et al., 2011), but it made no detectable difference when evaluated under our reaction conditions.
Incubate the reaction at 37°C for the desired time. We specifically tested our purified mTet2-CD protein under low turnover conditions (eg, 500 nM DNA, 10 μg/mL enzyme) and showed linear activity through at least 20 min. Under higher turnover conditions (eg, 25 nM DNA, 30 μg/mL enzyme), we typically achieve complete conversion of mC and hmC to fC and caC by 30 min; longer reactions are also possible with activity detectable out to 3 h, although turnover slows past ~30 min. Quench the reaction by adding 8× volume of 100% ethanol with 2× volume of Oligo Binding Buffer (Zymo). Purify reactions using the Zymo Oligo Clean & Concentrator kit.
The purified products consist of a mixture of DNA duplexes containing mC, hmC, fC, and/or caC. A number of assays are available to probe for specific bases qualitatively and quantitatively. As noted earlier, Kizaki and Sugiyama reported using 4–6 nt substrates with direct resolution of the reaction products by HPLC (Kizaki & Sugiyama, 2014). However, longer substrates are needed to understand how strand specificity, sequence context, and other factors impact TET activity. Assays on these longer substrates rely on indirect methods involving either enzymatic processing or degradation to nucleosides to deliver rigorous, reliable quantification of TET reaction products in vitro.
There are several bacterial restriction enzymes that display variable capacity to cleave the different cytosine modifications. MspI, the most well known of these enzymes, cleaves the sequence CXGG completely when X is C, mC, or hmC; cleaves partially when X is fC; and cannot cleave when X is caC (Fig. 5A and B). There is some evidence that MspI cleavage behavior is affected by the identity of the opposite strand CpG (Pais et al., 2015), but the majority of our experiments use substrates that have unmodified CpG on the complement. We have also observed a similar pattern of discrimination with HaeIII on oligonucleotides containing a GGCX sequence. We exploit these restriction enzymes’ behavior further by enzymatically modifying hmC and/or chemically modifying fC to prevent cleavage. The difference in cleavage patterns between treated and untreated samples reflects the fraction of these bases in the total reaction mixture. Notably, by selectively excluding either/both chemical modification steps, this method allows the levels of specific bases to be probed.
Fig. 5.
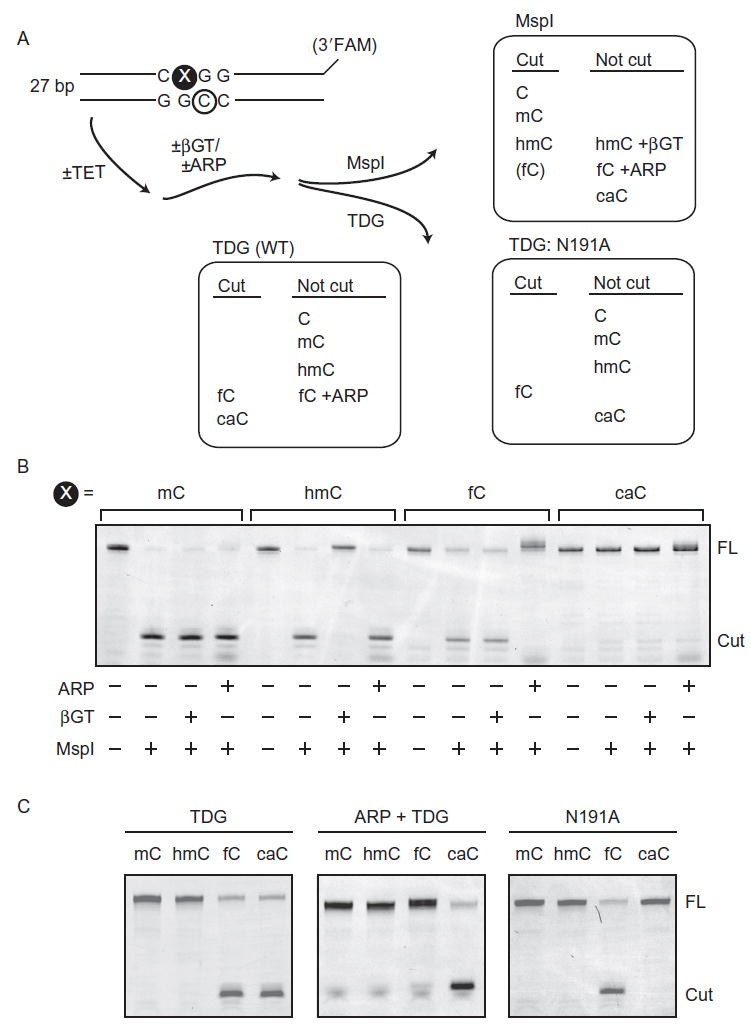
Enzyme-coupled assays for TET activity. (A) Chemoenzymatic assays indirectly measure TET activity on full-length oligonucleotides. Typically, duplexed DNA containing a FAM-labeled reactive strand, which has a mCpG in the MspI cleavage-sequence context, is treated with recombinant TET protein according to optimized assay conditions. Any resulting hmC and fC among reaction products are chemically protected by glucose (via β-glucosyltransferase) or ARP, respectively. Then, the full-length, duplexed DNA is treated with either MspI or TDG (WT or mutant N191A), which each have a unique cleavage capacity against natural and chemically protected cytosine derivatives. (B and C) Denaturing polyacrylamide gels displaying chemoenzymatic activity assay products. Oligonucleotides containing each cytosine modification at the reactive site (X) were employed in lieu of a TET reaction to display MspI (B) and TDG (C) cleavage signatures, in the presence or absence of various chemical protection steps.
To protect hmC from cleavage, treat the reaction mixture with 2 mM UDP-glucose and 1:25 by volume of T4 β-glucosyltransferase (βGT) (NEB) in 1 × CutSmart buffer at 37°C to transfer the glucose moiety from UDP-glucose to hmC (Terragni, Bitinaite, Zheng, & Pradhan, 2012). All hmC bases are glucosylated in 30 min, and MspI/HaeIII does not cleave the resulting glucosyl-hmC. To protect fC, mix DNA substrate with at least 35,000-fold molar excess of aldehyde reactive probe (ARP, Dojindo) in a reaction with 6 mM HEPES at pH 5.0 (the lower pH improves the efficiency of the reaction). Incubate at 37°C overnight, or for at least 3 h. MspI/HaeIII does not cleave fC when ARP is covalently attached. Note that ARP and βGT can be used sequentially to protect both hmC and fC in a reaction mixture: perform the ARP reaction first and then dilute into 1 × CutSmart buffer for the βGT reaction, since βGT is more tolerant of buffer conditions. Proceed directly to MspI digestion in 1× CutSmart buffer at 37°C for at least 2 h, without need for further purification.
In addition to restriction enzymes, we also utilize TDG to recognize fC and caC in TET reaction mixtures (Fig. 5A and C). TDG is expressed and purified as described previously (Morgan, Bennett, & Drohat, 2007). Treat TET reaction products with 25-fold molar excess of TDG (eg, 125 nM substrate and 3.125 μM TDG) in TDG buffer (20 mM HEPES, pH 7.5, 100 mM NaCl, 0.2 mM EDTA, 2.5 mM MgCl2) for 4 h at 37°C. TDG excises fC and caC, leaving abasic sites, but does not react with mC and hmC. To cleave oligonucleotides that now contain abasic sites, add 1:1 volume of 0.3 M NaOH/0.03 M EDTA and incubate at 85°C for 15 min. As an added means for discrimination of TET products, we use a mutant form of TDG, N191A, that has been shown to preferentially excise fC but not caC (Maiti, Michelson, Armwood, Lee, & Drohat, 2013); this mutant can be purified and used in the same manner to identify fC specifically. Finally, it is possible to selectively cleave caC-containing DNA by treating with ARP (as described earlier), which protects fC from excision by WT TDG, leaving only caC susceptible. A variant of TDG that shows preferential excision of caC has also been reported and may provide a complementary approach to quantifying caC in reaction products (Hashimoto, Zhang, & Cheng, 2013).
As the final step of all chemoenzymatic assays, mix samples 1:1 with formamide containing bromophenol blue, denature, separate full-length from cleaved oligonucleotides on a 7 M urea/20% acrylamide/1 × TBE gel prewarmed to 50°C, and image for FAM fluorescence. Altogether, these chemoenzymatic activity assays provide a complete toolbox to probe for specific ox-mC base modifications in a TET reaction mixture.
3.4 Quantitative Activity Assays on Nucleosides
Our chemoenzymatic assays with fluorescent oligonucleotides are both convenient and quantifiable, but digesting the reaction products to nucleosides greatly enhances the accuracy and sensitivity of quantification. This is particularly true of 14C-labeled reactions, for which we can use HPLC to separate modified nucleosides, collect fractions, and perform liquid scintillation counting (LSC) (Fig. 6A). After reacting [14C]-mC substrate with TET enzymes and purifying as described earlier, degrade the products to nucleosides using DNA Degradase Plus (Zymo). Note that we typically use radioactivity for reactions where very low turnover is desired and product formation would be difficult to detect by any other means. Since these product peaks would be invisible to UV detection during HPLC, spike the samples with 10 μM each of nonradioactive mC, hmC, fC, and caC nucleosides (Berry & Associates), which act as chromatographic markers. Separate the samples by gradient elution over the Supelcosil LC-18-S column, as described in Section 2.3. In lieu of mass spectrometry, collect the peaks into 0.25 mL fractions, mix with Opti-Fluor liquid scintillant (Perkin Elmer), and subject to LSC (we use a Tri-Carb 2910 TR (Perkin Elmer)), counting each vial for 10 min using the 14C setting (Fig. 6B). Measure specific radioactivity from the small sample that was set aside during preparation of radiolabeled substrate (Section 3.2), and correct for background radiation using fractions collected from a nonradioactive control reaction. The resulting measurements of disintegrations per minute should be normalized to the input volume and known input concentration to yield molar concentrations of each modified cytosine base.
Fig. 6.
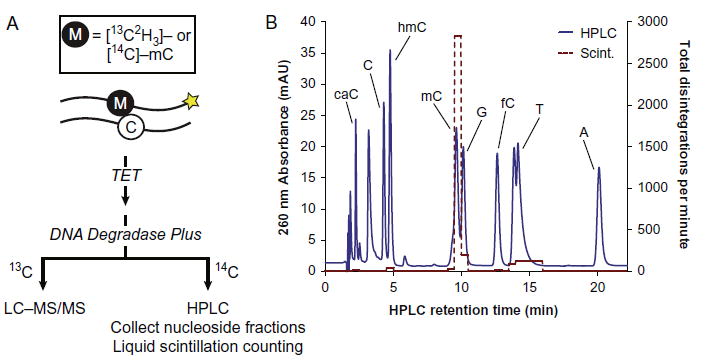
High-sensitivity in vitro assays. (A) Isotopically labeled oligonucleotides duplexed with an unlabeled complementary strand can be reacted with purified TET enzymes in vitro. Depending on the nature of the label, the reaction products are degraded to nucleosides and analyzed by either LC-MS/MS or HPLC with liquid scintillation counting to quantify oxidized bases with high sensitivity. (B) Representative HPLC chromatogram (solid line) of nucleosides from a degraded TET reaction on 14C-labeled DNA. The samples were spiked with unlabeled mC, hmC, fC, and caC to mark these peak positions for fraction collection, and the fractions were subjected to liquid scintillation counting. The disintegrations per minute (dashed line) for each fraction are overlaid with the HPLC chromatogram. Very low (<1%) product formation can be reliably detected by this approach.
For nonradioactive reactions, LC-MS/MS offers the best method of quantification (Fig. 3). The application of this protocol using one strand that is selectively 13C2H3-labeled can also facilitate tracking of oxidation of two strands of DNA simultaneously. For a typical analysis, degrade at least 5 pmol of TET reaction products to component nucleosides with 1 U DNA Degradase Plus (Zymo) in 10 μL at 37°C for at least 2 h. Dilute this mixture 10-fold into 0.1% formic acid, and inject at least 20 μL onto the Agilent LC-MS/MS system as described in Section 2.3. Alternatively, for better resolution of isotopically labeled bases, we start with ~20 pmol of reaction products and inject 1 μL onto the nano LC-MS/MS system.
Acknowledgments
We are grateful to our colleagues who have previously shared reagents or protocols, including Drs. Guoliang Xu (Shanghai Institutes for Biological Sciences), Yi Zhang (Harvard, HHMI), and Alex Drohat (University of Maryland). We thank Dr. Benjamin Garcia for assistance in development of LC-MS/MS protocols. This work was supported by the Rita Allen Foundation.
References
- Bachman M, Uribe-Lewis S, Yang X, Burgess HE, Iurlaro M, Reik W, et al. 5-Formylcytosine can be a stable DNA modification in mammals. Nature Chemical Biology. 2015;11:555–557. doi: 10.1038/nchembio.1848. [DOI] [PMC free article] [PubMed] [Google Scholar]
- Bachman M, Uribe-Lewis S, Yang X, Williams M, Murrell A, Balasubramanian S. 5-Hydroxymethylcytosine is a predominantly stable DNA modification. Nature Chemistry. 2014;6:1049–1055. doi: 10.1038/nchem.2064. [DOI] [PMC free article] [PubMed] [Google Scholar]
- Blaschke K, Ebata KT, Karimi MM, Zepeda-Martinez JA, Goyal P, Mahapatra S, et al. Vitamin C induces Tet-dependent DNA demethylation and a blastocyst-like state in ES cells. Nature. 2013;500:222–226. doi: 10.1038/nature12362. [DOI] [PMC free article] [PubMed] [Google Scholar]
- Booth MJ, Raiber EA, Balasubramanian S. Chemical methods for decoding cytosine modifications in DNA. Chemical Reviews. 2015;115:2240–2254. doi: 10.1021/cr5002904. [DOI] [PMC free article] [PubMed] [Google Scholar]
- Hashimoto H, Zhang X, Cheng X. Selective excision of 5-carboxylcytosine by a thymine DNA glycosylase mutant. Journal of Molecular Biology. 2013;425:971–976. doi: 10.1016/j.jmb.2013.01.013. [DOI] [PMC free article] [PubMed] [Google Scholar]
- He YF, Li BZ, Li Z, Liu P, Wang Y, Tang Q, et al. Tet-mediated formation of 5-carboxylcytosine and its excision by TDG in mammalian DNA. Science. 2011;333:1303–1307. doi: 10.1126/science.1210944. [DOI] [PMC free article] [PubMed] [Google Scholar]
- Hu L, Li Z, Cheng J, Rao Q, Gong W, Liu M, et al. Crystal structure of TET2-DNA complex: Insight into TET-mediated 5mC oxidation. Cell. 2013;155:1545–1555. doi: 10.1016/j.cell.2013.11.020. [DOI] [PubMed] [Google Scholar]
- Hu L, Lu J, Cheng J, Rao Q, Li Z, Hou H, et al. Structural insight into substrate preference for TET-mediated oxidation. Nature. 2015;527:118–122. doi: 10.1038/nature15713. [DOI] [PubMed] [Google Scholar]
- Ito S, D’Alessio AC, Taranova OV, Hong K, Sowers LC, Zhang Y. Role of Tet proteins in 5mC to 5hmC conversion, ES-cell self-renewal and inner cell mass specification. Nature. 2010;466:1129–1133. doi: 10.1038/nature09303. [DOI] [PMC free article] [PubMed] [Google Scholar]
- Ito S, Shen L, Dai Q, Wu SC, Collins LB, Swenberg JA, et al. Tet proteins can convert 5-methylcytosine to 5-formylcytosine and 5-carboxylcytosine. Science. 2011;333:1300–1303. doi: 10.1126/science.1210597. [DOI] [PMC free article] [PubMed] [Google Scholar]
- Iurlaro M, Ficz G, Oxley D, Raiber EA, Bachman M, Booth MJ, et al. A screen for hydroxymethylcytosine and formylcytosine binding proteins suggests functions in transcription and chromatin regulation. Genome Biology. 2013;14:R119. doi: 10.1186/gb-2013-14-10-r119. [DOI] [PMC free article] [PubMed] [Google Scholar]
- Kizaki S, Sugiyama H. CGmCGCG is a versatile substrate with which to evaluate Tet protein activity. Organic & Biomolecular Chemistry. 2014;12:104–107. doi: 10.1039/c3ob41823e. [DOI] [PubMed] [Google Scholar]
- Kohli RM, Zhang Y. Tet, TDG and the dynamics of DNA demethylation. Nature. 2013;502:472–479. doi: 10.1038/nature12750. [DOI] [PMC free article] [PubMed] [Google Scholar]
- Maiti A, Drohat AC. Thymine DNA glycosylase can rapidly excise 5-formylcytosine and 5-carboxylcytosine: Potential implications for active demethylation of CpG sites. The Journal of Biological Chemistry. 2011;286:35334–35338. doi: 10.1074/jbc.C111.284620. [DOI] [PMC free article] [PubMed] [Google Scholar]
- Maiti A, Michelson AZ, Armwood CJ, Lee JK, Drohat AC. Divergent mechanisms for enzymatic excision of 5-formylcytosine and 5-carboxylcytosine from DNA. Journal of the American Chemical Society. 2013;135:15813–15822. doi: 10.1021/ja406444x. [DOI] [PMC free article] [PubMed] [Google Scholar]
- Morgan MT, Bennett MT, Drohat AC. Excision of 5-halogenated uracils by human thymine DNA glycosylase. Robust activity for DNA contexts other than CpG. The Journal of Biological Chemistry. 2007;282:27578–27586. doi: 10.1074/jbc.M704253200. [DOI] [PMC free article] [PubMed] [Google Scholar]
- Neri F, Incarnato D, Krepelova A, Rapelli S, Anselmi F, Parlato C, et al. Single-base resolution analysis of 5-formyl and 5-carboxyl cytosine reveals promoter DNA methylation dynamics. Cell Reports. 2015;10:674–683. doi: 10.1016/j.celrep.2015.01.008. [DOI] [PubMed] [Google Scholar]
- Ottink OM, Nelissen FH, Derks Y, Wijmenga SS, Heus HA. Enzymatic stereospecific preparation of fluorescent S-adenosyl-l-methionine analogs. Analytical Biochemistry. 2010;396:280–283. doi: 10.1016/j.ab.2009.09.013. [DOI] [PubMed] [Google Scholar]
- Pais JE, Dai N, Tamanaha E, Vaisvila R, Fomenkov AI, Bitinaite J, et al. Biochemical characterization of a naegleria TET-like oxygenase and its application in single molecule sequencing of 5-methylcytosine. Proceedings of the National Academy of Sciences of the United States of America. 2015;112:4316–4321. doi: 10.1073/pnas.1417939112. [DOI] [PMC free article] [PubMed] [Google Scholar]
- Pfaffeneder T, Spada F, Wagner M, Brandmayr C, Laube SK, Eisen D, et al. Tet oxidizes thymine to 5-hydroxymethyluracil in mouse embryonic stem cell DNA. Nature Chemical Biology. 2014;10:574–581. doi: 10.1038/nchembio.1532. [DOI] [PubMed] [Google Scholar]
- Shen L, Zhang Y. Enzymatic analysis of Tet proteins: Key enzymes in the metabolism of DNA methylation. Methods in Enzymology. 2012;512:93–105. doi: 10.1016/B978-0-12-391940-3.00005-6. [DOI] [PMC free article] [PubMed] [Google Scholar]
- Song CX, Yi C, He C. Mapping recently identified nucleotide variants in the genome and transcriptome. Nature Biotechnology. 2012;30:1107–1116. doi: 10.1038/nbt.2398. [DOI] [PMC free article] [PubMed] [Google Scholar]
- Spruijt CG, Gnerlich F, Smits AH, Pfaffeneder T, Jansen PW, Bauer C, et al. Dynamic readers for 5-(hydroxy)methylcytosine and its oxidized derivatives. Cell. 2013;152:1146–1159. doi: 10.1016/j.cell.2013.02.004. [DOI] [PubMed] [Google Scholar]
- Tahiliani M, Koh KP, Shen Y, Pastor WA, Bandukwala H, Brudno Y, et al. Conversion of 5-methylcytosine to 5-hydroxymethylcytosine in mammalian DNA by MLL partner TET1. Science. 2009;324:930–935. doi: 10.1126/science.1170116. [DOI] [PMC free article] [PubMed] [Google Scholar]
- Terragni J, Bitinaite J, Zheng Y, Pradhan S. Biochemical characterization of recombinant beta-glucosyltransferase and analysis of global 5-hydroxymethylcytosine in unique genomes. Biochemistry. 2012;51:1009–1019. doi: 10.1021/bi2014739. [DOI] [PMC free article] [PubMed] [Google Scholar]
- Tsuji M, Matsunaga H, Jinno D, Tsukamoto H, Suzuki N, Tomioka Y. A validated quantitative liquid chromatography-tandem quadrupole mass spectrometry method for monitoring isotopologues to evaluate global modified cytosine ratios in genomic DNA. Journal of Chromatography. 2014:953–954. 38–47. doi: 10.1016/j.jchromb.2014.01.050. [DOI] [PubMed] [Google Scholar]
- Yardimci H, Zhang Y. Charting oxidized methylcytosines at base resolution. Nature Structural & Molecular Biology. 2015;22:656–661. doi: 10.1038/nsmb.3071. [DOI] [PMC free article] [PubMed] [Google Scholar]
- Yin R, Mao SQ, Zhao B, Chong Z, Yang Y, Zhao C, et al. Ascorbic acid enhances Tet-mediated 5-methylcytosine oxidation and promotes DNA demethylation in mammals. Journal of the American Chemical Society. 2013;135:10396–10403. doi: 10.1021/ja4028346. [DOI] [PubMed] [Google Scholar]
- Yu M, Hon GC, Szulwach KE, Song CX, Zhang L, Kim A, et al. Base-resolution analysis of 5-hydroxymethylcytosine in the mammalian genome. Cell. 2012;149:1368–1380. doi: 10.1016/j.cell.2012.04.027. [DOI] [PMC free article] [PubMed] [Google Scholar]