Abstract
Background
High-resolution manometry (HRM) utilizes software tools to diagnose esophageal motor disorders. Performance of these software metrics could be affected by averaging and by software characteristics of different manufacturers.
Methods
HRM studies on 86 patients referred for antireflux surgery (61.6±1.4 yr, 70% F) and 20 healthy controls (27.9±0.7 yr, 45% F) were first subject to standard analysis (Medtronic, Duluth, GA). Coordinates for each of 10 test swallows were exported and averaged to generate a composite swallow. The swallows and averaged composites were imported as ASCII file format into Manoview (Medtronic, Duluth, GA) and Medical Measurement Systems database reporter (MMS, Dover, NH), and analyses repeated. Comparisons were made between standard and composite swallow interpretations.
Results
Correlation between the two systems was high for mean distal contractile integral (DCI, r2≥0.9) but lower for integrated relaxation pressure (IRP, r2=0.7). Excluding achalasia, six patients with outflow obstruction (mean IRP 23.2±2.1 with 10-swallow average) were identified by both systems. An additional 9 patients (10.5%) were identified as outflow obstruction (15 mmHg threshold) with MMS 10-swallow and 4 with MMS composite swallow evaluation; only one was confirmed. IEM was diagnosed by 10 swallow evaluation in 19 (22.1%) with Manoview, and 20 (23.3%) with MMS. On Manoview composite, 17 had DCI<450 mmHg.cm.s, and on MMS composite, 21, (p≥0.85 for each comparison) but these did not impact diagnostic conclusions.
Conclusions
Comparison of 10 swallow and composite swallows demonstrate variability of software metrics between manometry systems. Our data supports use of manufacturer specific software metrics on 10 swallow sequences.
Keywords: high resolution manometry, integrated relaxation pressure, distal contractile integral, esophagogastric junction outflow obstruction
Graphical abstract
Diagnostic value of high resolution manometry (HRM) software metrics could be affected by averaging and by software characteristics of different manufacturers. We exported and averaged coordinates of 10 swallow manometry studies in patients referred for antireflux surgery and in controls; these single and composite swallows were imported back into two different HRM systems (Manoview, Medtronic; Medical Measurement Systems, MMS). Differences were noted between Manoview and MMS in IRP values generated, with overdiagnosis of outflow obstruction when Manoview IRP thresholds were applied to MMS composite swallows. Our data supports using manufacturer specific thresholds for HRM software tools.
High resolution manometry (HRM) utilizes computerized data acquisition and display from multiple solid state sensors spaced 1 cm apart on an esophageal manometry catheter1. With digital data assimilation, software tools can be used to interrogate important elements of esophageal peristalsis2. The three motor metrics most reliant on software tools are the distal contractile integral (DCI), distal latency (DL) and integrated relaxation pressure (IRP)3. DCI assesses collective vigor of esophageal smooth muscle contraction, taking into account the length, amplitude and duration of contraction of the smooth muscle segments4. DL assesses timing of the peristaltic sequence as it progresses down the esophagus5. IRP provides a measure of resistance to bolus flow through the esophagogastric junction by measuring nadir pressures during expected lower esophageal sphincter (LES) relaxation6.
HRM analysis (Chicago Classification 3.0) utilizes peristaltic sequences from 10 test swallows of ambient temperature water to assess IRP and DCI for motor diagnoses of outflow obstruction (mean IRP>15 mmHg using the Medtronic system, Duluth, GA) and ineffective esophageal motility (IEM; ≥50% swallows with DCI<450 mmHg.cm.s)3. Since mean values are often used, assessment of motor function by software metrics could be affected by the algorithms utilized. Further, diagnostic thresholds for these software metrics, particularly IRP, are known to vary by manufacturer7-9.
In this study, we assessed the impact of averaged swallow metrics on esophageal motor diagnosis using two different HRM software programs, compared to interpretation of individual swallows separately on a 10 swallow sequence. A single composite sequence was generated by averaging the source HRM coordinates from 10 swallow sequences, and imported into the two software programs where display of the averaged sequence was possible. Our intent was to determine if esophageal HRM metrics generated similar conclusions when an averaged composite swallow was analyzed, and when different HRM software programs were utilized for interpretation of manometric data, both composite swallows and the 10 swallow complement.
Methods
The cohort consisted of patients > 18 years old referred for anti-reflux surgery (ARS), undergoing preoperative esophageal HRM for assessment of peristaltic function, which represented a convenience data set that had already been analyzed as part of previous reports, and served to answer questions posed by the aims of this study10, 11. To qualify for inclusion, subjects had to be referred for ARS, and HRM performed as part of pre-operative peristaltic evaluation. Exclusion criteria included planned surgery for indications other than GERD, prior foregut resections, and unintelligible studies with artifacts limiting evaluation. A cohort of 20 asymptomatic healthy subjects constituted the controls for this study; all underwent esophageal HRM as part of the institutional normative data assessment. None of the control subjects were on any regular medications. Analysis of HRM Clouse plots for the purpose of this study was approved by the Human Research Protection Office (institutional review board) at Washington University in St. Louis.
All HRM studies were performed using a 36-channel solid state catheter system with circumferential sensors 1 cm apart (Medtronic, Duluth, GA), using methodology previously described10, 11. Briefly, all studies were performed following an overnight fast, and medications such as anticholinergics, smooth muscle relaxants, and metoclopramide were held for at least 5-7 days whenever possible. After calibration, the HRM catheter was passed transnasally; topical anesthesia was applied to the nasal passages to minimize discomfort. The catheter was then taped to the nose and catheter position documented, ensuring uniform, fixed and stable catheter position for each set of 10 swallows in each patient. For this study, all subjects completing a 10 test swallow protocol (5 mL ambient temperature water swallows at least 20 seconds apart) were eligible for inclusion.
Dedicated software programs (Manoview, Medtronic, Duluth, GA) were utilized for data acquisition, display and standard analysis of esophageal motor function in both patients and controls using Chicago Classification version 3.03. HRM studies were characterized based on mean and median IRP (abnormal when >15 mmHg) from 10 water swallows into esophageal outflow obstruction or no outflow obstruction; when relevant, characterization into achalasia spectrum disorders was performed as per Chicago Classification. Elevated IRP with intact esophageal body peristalsis was designated esophagogastric junction outflow obstruction (EGJOO). Based on DCI values, studies without esophageal outflow obstruction and with DCI<450 mmHg.cm.s on ≥5 sequences were further characterized as ineffective esophageal motility (IEM). There were no diagnoses of hypercontractile disorder or absent contractility in the study cohorts. Abnormal DL in the context of normal IRP was not encountered in the study cohort, therefore DL was not further analyzed.
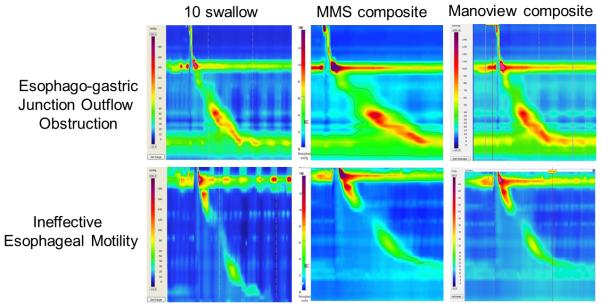
In preparation for export and further analysis, each HRM study was carefully evaluated to ensure that catheter position was stable, and swallow boxes started at the same precise interval from onset of upper esophageal sphincter (UES) relaxation by one study investigator (JD) to ensure uniformity of swallow coordinates. Then, for every patient and control, coordinates from each test swallow were exported as tab-delimited ASCII text files, and subsequently imported into Microsoft Excel. Each coordinate for the 10 swallow protocol was averaged to generate coordinates for a single composite sequence. The averaged coordinates for composite sequences were then imported back as Sierra ASCII files into Manoview (Medtronic, Duluth, GA), and both individual swallows and composite sequences imported into Medical Measurement Systems database reporter (MMS, Enchede, Netherlands). The composite sequences (one for every patient and control, Figure 1) were analyzed using standard software for each of the two HRM systems by a single study investigator (AR), using DCI and IRP. Comparisons were made between analyses of the full 10 swallow sequences using each HRM system.
Figure 1.
Examples of esophagogastric junction outflow obstruction and ineffective esophageal motility between 10-swallow and composite swallows. The 10-swallow analysis represents evaluation of 10 test swallows using the Manoview system (Medtronic, Duluth, GA). Swallow coordinates were exported, averaged, and reimported into the software system to generate composite swallows using Medical Measurement Systems software (MMS, Enchede, Netherlands) and Manoview.
Statistical Analysis
Data are reported as mean ± standard error of mean unless otherwise indicated. Comparisons were made between standard interpretation using 10-swallow averages, Manoview single composite swallow interpretation, and MMS single composite swallow interpretation. Paired Student’s t-tests were also used to compare the three different methods of measurement. In order to elucidate differences between these three methods of interpretation, Pearson correlation tests were performed. Concordance or discordance between methods was determined using the 10-swallow average interpretation as the gold standard for comparisons. In all instances, a p value of <0.05 was required for statistical significance. All statistics and plots were performed with Microsoft Excel and R-Studio v2.11.
Results
HRM studies from 86 patients referred for anti-reflux surgery (61.6±1.4 yrs., 70% F) and 20 healthy controls (27.9±0.7 yrs., 45% F) were available for analysis. Median IRP values were slightly lower overall than mean IRP values, but not significantly different either for the patient group or controls (p≥0.5 for each comparison, Table 1). Using the 10-swallow metrics, mean and median IRP values, and mean DCI values were numerically higher with MMS analysis of Manoview acquired data, but the differences were not statistically significant, both within patient groups and controls, and between patient groups and controls (p>0.4 in all instances, Table 1).
Table 1.
Baseline Characteristics of Cohorts
| Patient cohort | Control Cohort | |
|---|---|---|
| n=86 | n=20 | |
| Mean age (yr) | 61.6 ± 1.4 | 27.9 ± 0.7 |
| Sex (F) | 60 (70.0%) | 9 (45.0%) |
| 10-Swallow (Manoview) | ||
| Integrated relaxation pressure (IRP) | ||
| Mean IRP (mmHg) | 7.84 ± 0.64 | 7.24 ± 0.85 |
| Median IRP (mmHg, IQR) | 6.90 (3.50–10.30) | 6.55 (4.60–9.63) |
| Mean DCI (mmHg.cm.s) | 1425.35 ± 113.2 | 1649.13 ± 265.61 |
| 10-Swallow (MMS) | ||
| Integrated relaxation pressure (IRP) | ||
| Mean IRP (mmHg) | 9.70 ± 0.72 | 9.27 ± 1.18 |
| Median IRP (mmHg, IQR) | 9.10 (4.48–13.28) | 8.05 (5.88–13.1) |
| Mean DCI (mmHg.cm.s) | 1299.67 ± 102.77 | 1534.47 ± 259.71 |
|
Chicago Classification diagnoses
(Manoview) |
||
| Outflow obstruction* | 9 (10.5%) | 0 |
| Major Motor Disorders | 0 | 0 |
| Minor Motor Disorders | 22 (25.6%) | 0 |
Values are reported as mean ± standard error of mean unless otherwise indicated: IQR: interquartile range.
includes 3 patients with known achalasia
Correlation of 10-Swallow Metrics to Composite Swallows
In order to extract differences between the four analysis methods, correlation was assessed in terms of measured DCI and IRP (averaged from 10 swallows vs. values from composite swallow within each of two HRM software systems). Pearson’s correlate (r2) was ≥0.9 for each DCI comparison between (Manoview vs. MMS) and within (10 swallow vs. composite swallows) software systems in patient and control cohorts as well as overall (Table 2). For IRP comparisons, correlation was high between the 10-swallow average and composite within each software system, but less profound for comparisons between 10-swallow average or composite swallows between the two systems (r2=0.7, Table 2).
Table 2.
Correlation between HRM systems
| 10-Swallow mean Manoview vs. MMS composite Pearson’s r2 |
10-Swallow mean Manoview vs. Manoview composite Pearson’s r2 |
10-Swallow mean Manoview vs. vs. 10-Swallow mean MMS Pearson’s r2 |
|
|---|---|---|---|
| DCI (mmHg) | |||
| Patient Cohort | 0.924 | 0.948 | 0.932 |
| Control Cohort | 0.983 | 0.985 | 0.975 |
| All patients and controls | 0.939 | 0.955 | 0.942 |
| IRP (mmHg) | |||
| Patient Cohort | 0.717 | 0.824 | 0.671 |
| Control Cohort | 0.646 | 0.883 | 0.853 |
| All patients and controls | 0.705 | 0.827 | 0.657 |
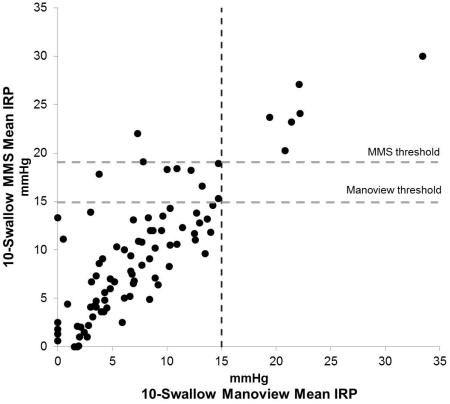
When analyzing IRP values, after excluding known achalasia, a total of 15 patients were diagnosed as having outflow obstruction using 10-swallow evaluation with both systems using a threshold of 15 mmHg, of which 6 patients had outflow obstruction with both systems, and 9 (10.5%) had outflow obstruction only on the MMS system. Of these, only 4 patients (4.7%) had MMS composite IRP values >15 mmHg (Figure 2), while an additional 5 patients had MMS 10-swallow IRP values > 15 mmHg (Figure 3), despite all having Manoview 10-swallow average IRP <15 mmHg. In contrast, IRP values were within the same category (i.e. normal or elevated, taking 15 mmHg as the threshold) when comparing 10 swallow Manoview mean or median IRP values to Manoview composite IRP in all instances in both patients and controls, despite numeric differences between recorded IRP values (Figure 2).
Figure 2.
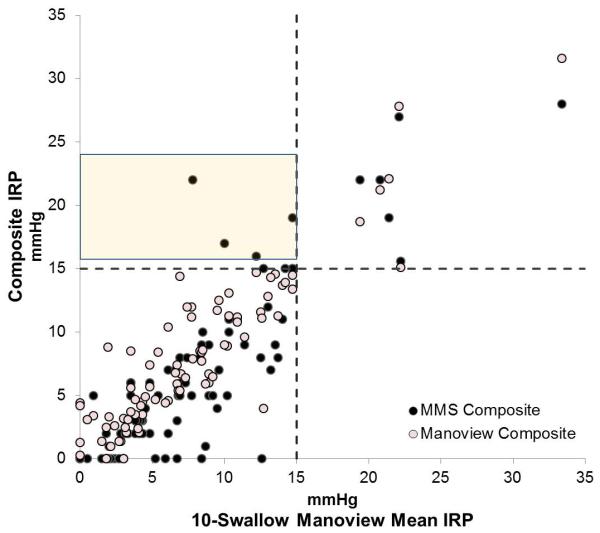
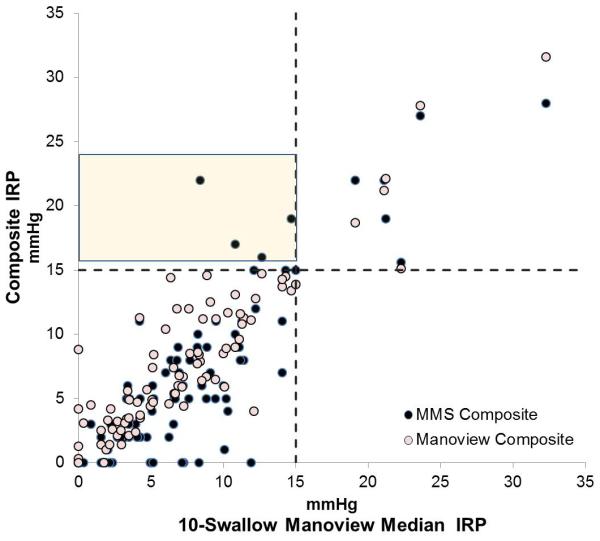
Comparison composite integrated relaxation pressure (IRP) between two software systems, MMS and Manoview to 10 swallow values from Manoview. A. 10-swallow mean IRP, and B. 10-swallow median IRP. The values in the shaded boxes indicate 4 instances IRP values recorded >15 mmHg on MMS composite swallow, in contrast to a mean or median value <15 mmHg using the 10 swallow analysis using Manoview. All these patients had IRP within normal limits using Manoview composite analysis despite minor shifts in recorded values.
Figure 3.
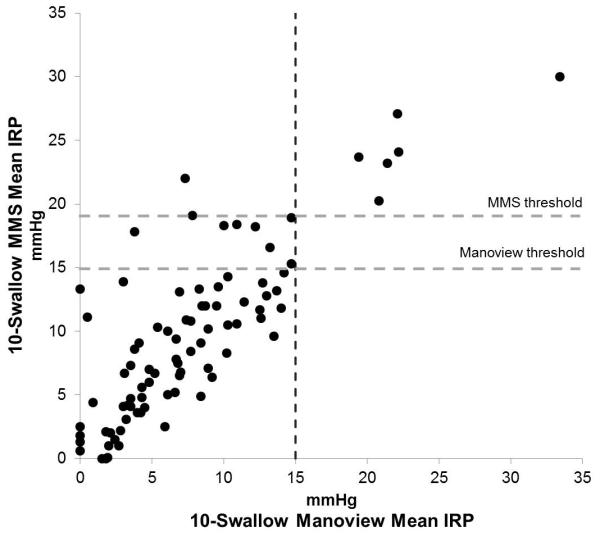
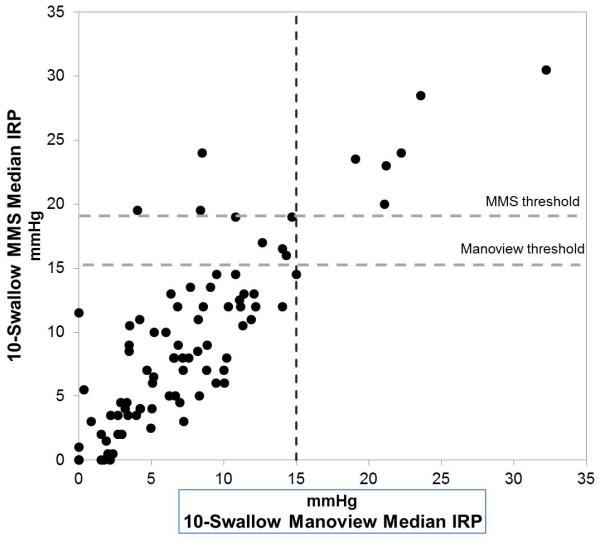
Comparison of 10-swallow integrated relaxation pressure (IRP) between two software systems. A. 10-swallow mean IRP, and B. 10-swallow median IRP. Horizontal lines indicate the Manoview threshold (15 mmHg) and MMS water perfused HRM system threshold (19 mmHg). All outflow obstruction diagnosed with both systems had values above the MMS threshold. Two patients had discordant mean IRP above the MMS threshold, while 3 patients had discordant median IRP values above the same threshold.
Outflow Obstruction
Based on 10-swallow metrics and Chicago Classification 3.0 definitions, outflow obstruction (achalasia and EGJOO) were identified and compared between the two HRM systems. There were no patients with hypercontractile esophagus, diffuse esophageal spasm, or absent contractility in the study cohort, hence major motor disorders could not be compared.
Three patients with achalasia were identified using both Manoview and MMS IRP thresholds. Excluding achalasia, a total of 6 patients of the patient cohort (7.0%) were diagnosed with EGJOO by the 10-swallow interpretation (mean IRP 23.2 ± 1.9 mmHg). Both MMS and Manoview 10 swallow and composite evaluations correctly identified these 6 patients; however MMS software identified an additional 9 patients as EGJOO, 4 of which were also identified using MMS composite swallows. This cohort effectively represents an overdiagnosis of outflow obstruction (EGJOO and achalasia) using Manoview metrics within MMS software, compared to 10-swallow average with Manoview. In the 9 discordant cases, mean and median IRP were significantly higher with MMS software using 10-swallow mean or median (p=0.001, 0.003 respectively, Table 3), but was not significantly higher using the MMS composite swallow (p=0.28, Table 3). Of these 9 patients, one had evidence of achalasia type II on inspection of Clouse plots and on alternate testing (MMS 10-swallow sequence IRP 18.9 mmHg, MMS composite IRP 19 mmHg, 10 swallow average IRP 14.7 mmHg), but the other 8 had no evidence of outflow obstruction on any other clinical testing. With the use of median rather than mean IRP with the Manoview 10 swallow interpretation, the patient with type 2 achalasia had a slightly higher IRP of 15.0 mmHg, at the upper threshold of normal; categorization of other patients did not change. Even if a 19 mmHg threshold (as reported for the MMS water perfused HRM system9) were to be utilized, two discordant patients would have been designated EGJOO using mean IRP, and five patients using median IRP (Figure 3). With a 28 mmHg threshold (as reported for MMS unisensor solid state system7), only one patient with achalasia would be identified among all patients with evidence of outflow obstruction.
Table 3.
Variation of HRM Metrics Between Software Systems
| EGJOO IRP (mmHg) |
IEM DCI (mmHg.cm.s) |
|||
|---|---|---|---|---|
|
|
||||
| Concordant n=6 |
Discordant n=9 |
Concordant n=13 |
Discordant n=6 | |
| 10-swallow Manoview mean | 23.2 ± 1.9 | 10.5 ± 1.2 | 394.9 ± 25 | 382.1 ± 84 |
| 10-swallow Manoview median | 21.8 (21.0-22.2) | 10.9 (7.8-13.2) | 400.2 (317-456) | 391.4 (236-552) |
| 10-swallow MMS mean | 24.7 ± 1.3 | 18.3 ± 0.6* | 380.5 ± 23 | 345.9 ± 80 |
| 10-swallow MMS median | 23.9 (23.3-26.4) | 18.3 (17.8-18.9)* | 388.7 (333-448) | 300.9 (220-457) |
| MMS Composite | 22.3 ± 1.8 | 12.8 ± 2.1 | 310.6 ± 22** | 427.5 ± 85 |
| Manoview Composite | 22.8 ± 2.2 | 10.7 ± 1.2 | 304.0 ± 20** | 301.8 ± 81** |
Values are reported as mean ± standard error of mean or median (interquartile range, IQR).
p<0.05 compared to 10-swallow Manoview
p<0.05 compared to 10-swallow mean
Minor Motor Disorders
There were three patients with fragmented peristalsis that were identified using both software systems. In contrast, IEM was diagnosed in 19 patients according to the 10-swallow interpretation according to the Chicago Classification v 3.03 using Manoview, compared to 20 patients using MMS to analyze the same 10-swallow sequence, 17 by the MMS composite and 21 by the Manoview composite (Table 3).
Concordance and Discordance of Diagnoses
With outflow obstruction, there were 9 concordant and 9 discordant patients across the two methods. There was one achalasia diagnosis missed with the Manoview IRP threshold, while all MMS discordant cases were overdiagnoses. With minor motor disorders, there were 16 concordant diagnoses across all four methods, and 6 discordant. Within the IEM concordant group (n=13), comparisons of the MMS composite (DCI 310.6 ± 22.7 mmHg.cm.s) and Manoview composite (DCI 304.0 ± 20.7 mmHg.cm.s) to the 10-swallow interpretation (394.9 ± 25.3 mmHg.cm.s) resulted in statistical significance (p = 0.0009 and 0.0004, respectively). However, these differences did not translate into a change in diagnosis.
Discussion
In this report, we demonstrate that composite swallow sequences, derived from averaging each of the 10-test swallows for a given patient, demonstrate the variability of interpretation using two manometry software systems, but do not add to the diagnosis of motor disorders. Further, we demonstrate that differences exist in computation of IRP between the two major HRM software systems, in that the MMS systems returns a higher IRP when data acquired from the Manoview system is imported into the system. This translates into over diagnosis of outflow obstruction if the Manoview IRP threshold is utilized with the MMS system. However, outflow obstruction (achalasia) can be missed with the Manoview IRP threshold as well, when values approximate but do not cross the accepted IRP threshold. While DCI values correlate much better between the systems, discordance remains in the identification of IEM. Our findings stress the importance of normative studies with each individual software system, such that thresholds for HRM metrics unique to each software system are generated to facilitate accurate interpretation of HRM.
The optimal approach to addressing variation between HRM systems would be to perform tandem studies on controls and patients using different software systems and their corresponding catheters, but such a study would be difficult to organize has not been performed to date. To approximate such comparison, we utilized the ‘import’ function incorporated into MMS software to upload HRM coordinates exported from Manoview studies. We utilized a labor intensive averaged composite set of coordinates for each patient so as to have the exact same data set imported into both Manoview and MMS systems, and to determine the impact of such averaging on motor diagnoses. Extreme care was taken to ensure that catheter position remained constant and that start times of exported coordinates from original sequences were precisely timed to UES relaxation, which ensured that coordinates (and peristaltic sequences) could be accurately superimposed on top of each other after averaging. HRM software converts these x, y, z coordinates (representing pressure, time, distance along esophagus) recorded at 1 cm intervals into 3-dimensional topographic Clouse plots by interpolating best fit data between recorded values, and assigning colors to different amplitudes1, 12. Therefore, the rendering of the Clouse plots should be unique to each software system but still comparable, assuming pressure, time and distance are constant. While recorded pressure can potentially vary according to the pressure sensor differences across HRM systems, we show in our report that the same pressure recording can generate different Clouse plot metrics when two different systems are utilized.
Averaging of swallows has been utilized with HRM coordinates in the past. Using topographic software used in geology, Clouse et al superimposed peristaltic sequences and demonstrated that esophageal contraction segments had constant architecture despite swallow to swallow variation in peristalsis13, 14. The presence of two smooth muscle contraction segments with individual peaks and troughs between segments were first recognized with such averaging. The Chicago group used exported averaged data to determine the utility of DCI measurements, and of peristaltic timing5, 15. However, our method of averaging exported coordinates followed by import back into software programs to our knowledge has not been performed in the past. The idea of using a composite sequence has been introduced in the HRM report function available with the Manoview software, but this has not been the subject of rigorous investigation. While our utilization of this methodology was to evaluate differences between software, the current trend of evaluating individual swallow sequences and using swallow based thresholds, especially with DCI and DL, provides more meaningful interpretation and diagnostic designation3. Even with IRP measurements, evaluating individual swallow IRP values rather than averaged IRP may have better diagnostic value, since individual high and low values from swallow to swallow variation may impact the final diagnosis. Our results support using software tools (DCI, IRP) applied to individual swallows rather than composite swallows by demonstrating variation between 10 swallow interpretation and composite swallow metrics even when using the same software system. Therefore, we conclude that composite swallows do not add to the diagnostic evaluation, and should not be used in the clinical realm.
Limited but growing literature exists on differences in normative values using different software systems. Of all the HRM metrics utilized, IRP is the most critical, as outflow obstruction identified by an abnormal IRP may trigger irreversible management decisions such as LES disruption or myotomy. Normative values for IRP have been rigorously evaluated with the Manoview system and the upper limit of normal has been established within the 11-17 mmHg range, with 15 mmHg used most commonly6, 8, 16, 17. As described in recent reports, outflow obstruction and achalasia can exist with lower IRP values3,18, a fact that was evident in our study as one patient with type II achalasia had mean Manoview IRP of 14.7 mmHg. The median IRP value was at the IRP threshold (15 mmHg) in this patient, which stresses the importance of looking at the clinical scenario, and perhaps reviewing both mean and median IRP values in borderline cases; however, further data is needed to solidify this concept. Limited studies have suggested that higher IRP thresholds are compatible with normal EGJ function with both the MMS unisensor solid state system (28 mmHg)7 and the MMS water perfused HRM system (19 mmHg)9. Although not addressed in our study, the Sandhill system also has been evaluated in the literature, with higher IRP thresholds (21 mmHg) compared to Manoview19. Our data stresses two points: a) the importance of manufacturer specific thresholds for IRP interpretation; and b) the need to carefully evaluate settings where IRP values approximate but do not cross accepted thresholds for diagnosis of outflow obstruction. The current Chicago Classification recommendation of utilizing median rather than mean IRP has started the process of moving further away from averaged values, even at the EGJ3. Our findings support these proposals.
Although variations in mean DCI values are reported between HRM systems7-9, 20, the overall implications of these DCI variations are not as profound, as these have diagnostic rather than management implications. The concept of individual swallow DCI thresholds for diagnosis of IEM in particular is relatively new and has not been rigorously evaluated3. It remains to be seen if the lower DCI threshold of normal (i.e. 450 mmHg.cm.s with the Medtronic system) is subject to similar variation, and further study is needed.
Our study has a few limitations. Our cohort represents a convenience cohort from previously collected and characterized HRM studies. Rather than evaluate all diagnostic indications for HRM, we chose to interrogate studies from patients referred for a single indication, evaluation of peristaltic function prior to planned antireflux surgery. This allowed uniformity in the cohort and eased the labor intensive process of export and averaging of coordinates; however, an expanded consecutive cohort of all patients presenting for HRM study may have provided more robust data. However, because of the nature of the cohort, while there were patients with outflow obstruction and minor motor disorders, there were no patients with major motor disorders for comparison between the software systems, and this represents a limitation of our analysis. As part of our experimental design, we evaluated alternate software performance with swallows imported from one software system, rather than the real world setting of obtaining 10 swallows in tandem using each of the two systems. Therefore, the performance of catheter sensors in data acquisition could not be factored into the analysis, and could have returned different conclusions; for such analysis, comparisons of the type we performed would have necessitated tandem HRM studies. Finally, while we attempted to be as accurate as possible in placing swallow boxes for export, even minute variations could have impacted the actual averaged values computed and subsequently imported and analyzed. Despite these limitations, we believe our results provide evidence towards differences in software systems in assimilating, displaying and interpreting HRM data.
In conclusion, we demonstrate that while overall software metrics correlate well across two HRM systems, variations in especially IRP computation can lead to false positive and less often, false negative diagnoses of outflow obstruction. Our findings stress the importance of developing normative HRM metric thresholds for each HRM software system, and of using individual sequence analysis rather than averaged or composite values or sequences for HRM interpretation. Further comparative studies, ideally tandem studies with different catheter and software systems, are needed to fully understand variations between HRM systems.
Key Points.
High resolution manometry (HRM) algorithms for interrogation of esophageal motor phenomena vary between software systems. We exported coordinates from HRM Clouse plots, and imported both single and composite sequences into alternate software programs for interrogation.
Integrated relaxation pressure (IRP) thresholds developed for the Manoview (Medtronic) system resulted in overdiagnosis of outflow obstruction on the Medical Measurement Systems (MMS) software.
Our findings show variability in software metrics between HRM systems, and support manufacturer specific thresholds for software metrics, particularly IRP.
ACKNOWLEDGEMENTS
This study was partially funded through NIH/NIDDK (T32 DK007130–AP). No funding was obtained from HRM manufacturers. CPG has research funding from Medtronic for a wireless pH project but not HRM; he participates in teaching and consulting for Medtronic. None of the other authors have any disclosures.
The authors wish to thank Mr. Sanket Khandelwal, software engineer with Medtronic, for his assistance in importing averaged composite coordinates back into Manoview software for the purpose of this study.
Footnotes
Presented in preliminary form at the Annual Meeting of the American Gastroenterological Association, Washington DC, May 2015
No conflicts of interest exist in relationship to this study.
Author roles: AR: study design, data collection and analysis, manuscript preparation and review: JD: data collection and analysis, critical review of manuscript; AP: data analysis, critical review of manuscript; CPG: study concept and design, data analysis, manuscript preparation, critical review and final approval of manuscript
REFERENCES
- 1.Gyawali CP, Bredenoord AJ, Conklin JL, et al. Evaluation of esophageal motor function in clinical practice. Neurogastroenterol Motil. 2013;25:99–133. doi: 10.1111/nmo.12071. [DOI] [PubMed] [Google Scholar]
- 2.Gyawali CP, Patel A. Esophageal Motor Function: Technical Aspects of Manometry. Gastrointest Endosc Clin N Am. 2014 doi: 10.1016/j.giec.2014.06.003. [DOI] [PubMed] [Google Scholar]
- 3.Kahrilas PJ, Bredenoord AJ, Fox M, et al. The Chicago Classification of esophageal motility disorders, v3.0. Neurogastroenterol Motil. 2015;27:160–74. doi: 10.1111/nmo.12477. [DOI] [PMC free article] [PubMed] [Google Scholar]
- 4.Ghosh SK, Pandolfino JE, Zhang Q, et al. Quantifying esophageal peristalsis with high-resolution manometry: a study of 75 asymptomatic volunteers. Am J Physiol Gastrointest Liver Physiol. 2006;290:G988–97. doi: 10.1152/ajpgi.00510.2005. [DOI] [PubMed] [Google Scholar]
- 5.Pandolfino JE, Roman S, Carlson D, et al. Distal esophageal spasm in high-resolution esophageal pressure topography: defining clinical phenotypes. Gastroenterology. 2011;141:469–75. doi: 10.1053/j.gastro.2011.04.058. [DOI] [PMC free article] [PubMed] [Google Scholar]
- 6.Ghosh SK, Pandolfino JE, Rice J, et al. Impaired deglutitive EGJ relaxation in clinical esophageal manometry: a quantitative analysis of 400 patients and 75 controls. Am J Physiol Gastrointest Liver Physiol. 2007;293:G878–85. doi: 10.1152/ajpgi.00252.2007. [DOI] [PubMed] [Google Scholar]
- 7.Bogte A, Bredenoord AJ, Oors J, et al. Normal values for esophageal high-resolution manometry. Neurogastroenterol Motil. 2013;25:762–e579. doi: 10.1111/nmo.12167. [DOI] [PubMed] [Google Scholar]
- 8.Weijenborg PW, Kessing BF, Smout AJ, et al. Normal values for solid-state esophageal high-resolution manometry in a European population; an overview of all current metrics. Neurogastroenterol Motil. 2014;26:654–9. doi: 10.1111/nmo.12314. [DOI] [PubMed] [Google Scholar]
- 9.Kessing BF, Weijenborg PW, Smout AJ, et al. Water-perfused esophageal high-resolution manometry: normal values and validation. Am J Physiol Gastrointest Liver Physiol. 2014;306:G491–5. doi: 10.1152/ajpgi.00447.2013. [DOI] [PubMed] [Google Scholar]
- 10.Shaker A, Stoikes N, Drapekin J, et al. Multiple rapid swallow responses during esophageal high-resolution manometry reflect esophageal body peristaltic reserve. Am J Gastroenterol. 2013;108:1706–12. doi: 10.1038/ajg.2013.289. [DOI] [PMC free article] [PubMed] [Google Scholar]
- 11.Stoikes N, Drapekin J, Kushnir V, et al. The value of multiple rapid swallows during preoperative esophageal manometry before laparoscopic antireflux surgery. Surg Endosc. 2012;26:3401–7. doi: 10.1007/s00464-012-2350-0. [DOI] [PMC free article] [PubMed] [Google Scholar]
- 12.Gyawali CP. High resolution manometry: the Ray Clouse legacy. Neurogastroenterol Motil. 2012;24(Suppl 1):2–4. doi: 10.1111/j.1365-2982.2011.01836.x. [DOI] [PubMed] [Google Scholar]
- 13.Clouse RE, Staiano A, Alrakawi A. Development of a topographic analysis system for manometric studies in the gastrointestinal tract. Gastrointest Endosc. 1998;48:395–401. doi: 10.1016/s0016-5107(98)70010-0. [DOI] [PubMed] [Google Scholar]
- 14.Clouse RE, Alrakawi A, Staiano A. Intersubject and interswallow variability in topography of esophageal motility. Dig Dis Sci. 1998;43:1978–85. doi: 10.1023/a:1018838710214. [DOI] [PubMed] [Google Scholar]
- 15.Roman S, Lin Z, Pandolfino JE, et al. Distal contraction latency: a measure of propagation velocity optimized for esophageal pressure topography studies. Am J Gastroenterol. 2011;106:443–51. doi: 10.1038/ajg.2010.414. [DOI] [PMC free article] [PubMed] [Google Scholar]
- 16.Sweis R, Anggiansah A, Wong T, et al. Normative values and inter-observer agreement for liquid and solid bolus swallows in upright and supine positions as assessed by esophageal high-resolution manometry. Neurogastroenterol Motil. 2011;23:509–e198. doi: 10.1111/j.1365-2982.2011.01682.x. [DOI] [PubMed] [Google Scholar]
- 17.Niebisch S, Wilshire CL, Peters JH. Systematic analysis of esophageal pressure topography in high-resolution manometry of 68 normal volunteers. Dis Esophagus. 2013;26:651–60. doi: 10.1111/dote.12027. [DOI] [PubMed] [Google Scholar]
- 18.Pandolfino JE, Kahrilas PJ. Presentation, diagnosis, and management of achalasia. Clin Gastroenterol Hepatol. 2013;11:887–97. doi: 10.1016/j.cgh.2013.01.032. [DOI] [PubMed] [Google Scholar]
- 19.Shi Y, Xiao Y, Peng S, et al. Normative data of high-resolution impedance manometry in the Chinese population. J Gastroenterol Hepatol. 2013;28:1611–5. doi: 10.1111/jgh.12285. [DOI] [PubMed] [Google Scholar]
- 20.Bogte A, Bredenoord AJ, Oors J, et al. Reproducibility of esophageal high-resolution manometry. Neurogastroenterol Motil. 2011;23:e271–6. doi: 10.1111/j.1365-2982.2011.01713.x. [DOI] [PubMed] [Google Scholar]


