Abstract
Objective
Higher traffic-related air pollution has been associated with higher body mass index (BMI) among children. However, few studies assessed the associations among adults.
Methods
2,372 participants from the Framingham Offspring and Third Generation cohorts who underwent multidetector computed tomography (MDCT) scans (2002-2005) were included. We estimated residential-based proximity to the nearest major roadway and one-year average levels of fine particulate matter (PM2.5) air pollution. BMI was measured at Offspring examination 7 (1998-2001) and Third Generation examination 1 (2002-2005), subcutaneous adipose tissue (SAT) and visceral adipose tissue (VAT) were measured using MDCT. We used linear regression models for continuous BMI, SAT, and VAT, and logistic models for the binary indicator of obesity (BMI≥30 kg/m2), adjusting for demographic variables, individual- and area-level measures of socio-economic position, and clinical and lifestyle factors.
Results
Participants who lived 60 m from a major roadway had 0.37 kg/m2 higher BMI (95% CI: 0.10, 0.65 kg/m2), 78.4 cm3 higher SAT (95% CI: 4.5, 152.3 cm3), and 41.8 cm3 higher VAT (95% CI: −4.7, 88.2 cm3) than those who lived 440 m away.
Conclusions
Living closer to a major roadway was associated with higher overall and abdominal adiposity.
Keywords: Environmental Risk, Body-Mass index, BMI, Subcutaneous Adipose Tissue, Visceral Fat, Computed Tomography
Introduction
In 2011-2012, more than one-third of adults (34.9%) in the United States were obese (1). As obesity is an important and modifiable risk factor for cardiovascular disease, studying the origin and development of obesity is of great interest. Other than overall obesity, both abdominal subcutaneous adipose tissue (SAT) and visceral adipose tissue (VAT) have been associated with adverse cardiometabolic risk profiles, with stronger associations seen for VAT than SAT (2-6).
In controlled animal studies, mice exposed to fine particulate matter (PM2.5; particles with aerodynamic diameter ≤ 2.5μm) had higher visceral fat or total abdominal fat compared with mice exposed to filtered air (7, 8). The hypothesized underlying biological mechanisms were the adverse effects of air pollution on inflammation, oxidative stress, and lipid metabolism (9-12). Although exposure to ambient air pollution has been linked to development of diabetes and cardiovascular disease in humans (13-16), few studies have examined the association between ambient air pollution and obesity (17-20), and little is known about the associations of ambient air pollution with abdominal adiposity among adults.
Therefore, we conducted the present investigation among participants from the multidetector computed tomography (MDCT) study, a sub-study of the Framingham Offspring and Third Generation cohorts. In the current study, we examined the associations of residential-based estimates of ambient PM2.5 exposure and proximity to the nearest major roadway with body mass index (BMI) and MDCT-based measures of abdominal adiposity. Our results may provide insight into the observed associations between air pollution and cardiovascular disease and diabetes.
Methods
Study population
We included participants from the Framingham Offspring cohort examination 7 (1998-2001) or Framingham Third Generation cohort examination 1 (2002-2005) who underwent the MDCT study. Selection criteria and study design of the two cohorts have been previously described (21, 22). For inclusion in the MDCT study, men were aged ≥35 years old, women were aged ≥40 years old and not pregnant, and because of physical constraints of the scanner, all participants weighed <350 lbs (160 kg) (3). Participants were scanned between 2002 and 2005. A total of 3,370 participants had either SAT or VAT measured, 520 were further excluded because of missing annual PM2.5 data. At each examination, physical examinations were performed following standardized protocols, and data on demographics, medication history, smoking history, and alcohol intake were collected by questionnaires. We further excluded participants with missing covariates data (N=478), leaving a total of 2,372 participants in the current analyses. All participants provided written informed consent, and Institutional Review Boards at Beth Israel Deaconess Medical Center, Boston University Medical Center, and Massachusetts General Hospital approved the study.
PM2.5 assessment
Participants’ self-reported residential addresses were collected during the exam visit and geocoded using ArcGIS software. We used a spatial-temporal model to estimate PM2.5 concentrations at a 1×1 km2 resolution based on residential addresses.
The satellite-based aerosol optical depth (AOD) is a measure of light attenuation in the atmospheric column, whereas the PM2.5 concentration is a measure of near surface dry mass (23). A number of statistical models have been developed in the past to estimate surface PM2.5 using satellite AOD retrieval, taking into account factors including vertical profile and meteorological parameters (24, 25). These models generally showed good correlations between AOD and surface PM2.5 in the eastern United States (25).
We used a novel hybrid spatial-temporal model that used AOD data from the Moderate Resolution Imaging Spectroradiometer (MODIS), spatial predictors (elevation, population density, traffic density, point and area emissions data for PM2.5, PM10, sulfur dioxide (SO2), and nitrogen oxides (NOx), and percentages of land use), and temporal predictors (meteorological parameters, MODIS Normalized Difference Vegetation Index, and the height of planetary boundary layer) (23). Furthermore, this hybrid model incorporated day-specific AOD calibration to ground level PM2.5, which improved our ability to predict PM2.5 across the study region (26, 27). This approach allowed us to predict PM2.5 on days when AOD data were not available. Moreover, compared to the standard MODIS AOD product that had a resolution of 10 × 10 km2, we used the advanced Multi-Angle Implementation of Atmospheric Correction (MAIAC) algorithms to achieve a higher resolution (1 × 1 km2) (23).
Briefly, we first fit a model regressing PM2.5 concentrations measured at local monitors against satellite-based AOD, adjusting for land use terms and meteorological predictors. Inverse probability weighting was used to address non-random missingness of daily AOD data. The predictions from this model (stage 1) have an excellent mean out-of-sample R2 of 0.88 (year-to-year variation 0.82-0.90 for the years 2003-2011), with an excellent fit when comparing predictions with observations (slope=0.99, year-to-year variation 0.98-1.01 for the years 2003-2011) (23). Second, we predicted grid cells with AOD measurement but not ground monitors measurement using the above fitted model. Third, for grid cells/days that had missing AOD measurements, we imputed data by a generalized additive model with spatial smoothing and a random intercept for each grid cell. The overall mean out-of-sample R2 for this stage of PM2.5 predictions was 0.88 with small year-to-year variation (0.84-0.91) (23). Last, we took the residuals (differences between monitor-based PM2.5 and predicted PM2.5 for each cell) and regressed them against monitor-specific spatial and temporal variables such as traffic density and distance to A1 roadways to generate local predictions for each residential address, which allowed us to improve the daily predictions to a finer scale that could better capture pollution from local sources. The total PM2.5 daily estimates were the sum of grid and localized predictions. We used annual average PM2.5 of the same index year (2003) for all participants, similar to our previous work (28, 29).
Distance to the nearest major roadway
We defined major roadways as primary highways with limited-access (A1), primary roads without limited-access (A2), or secondary and connecting roads (A3). And we estimated residential distance to the nearest major roadway based on the geocoded addresses. We restricted our analyses to participants who lived within 1,000 meters from the nearest major roadway (N=2,118) when roadway proximity was the exposure of interest, because distance may not be an informative surrogate of traffic-related air pollution in semirural or rural areas. As in our previous work (28, 29), we classified participants into five groups based on the distance of their residential address to the nearest major roadway (0-50, 50-100, 100-200, 200-400, and 400-1,000 m). The cutpoints reflect the decreasing pattern of traffic-related pollutants, such as particulate matter mass and elemental carbon, from mobile sources (30).
Overall and abdominal adiposity
Both standing height and weight were measured without shoes according to a standardized protocol. Height was recorded to the nearest ¼ inch, and weight was recorded to the nearest pound (rounded up if ≥ 0.5 pound). BMI was calculated as weight (kg) / height (m)2.
Participants underwent MDCT scan of the abdomen in the supine position by an eight-slice scanner (LightSpeed Ultra, General Electric, Milwaukee, WI) and 25 contiguous 5 mm thick slices (120 kVp, 400 mA, gantry rotation time 500 ms, table feed 3:1) were obtained above the S1 level. A semiautomatic segmentation technique that required manual definition of the abdominal muscular wall (Aquarius 3D Workstation, TeraRecon Inc., San Mateo, CA) was used to measure SAT and VAT. An image display window with width of −195 to −45 Hounsfield units was used to identify pixels containing fat. The MDCT-based volumetric measurements of abdominal adipose tissue have been shown to be reproducible with high intra-class correlation (ICC) for both intra-reader (ICC=0.99) and inter-reader (ICC=0.99) comparisons (31).
Statistical methods
We fit multivariable linear regression models for continuous BMI, SAT, and VAT, and multivariable logistic regression models for a binary indicator of obesity (BMI ≥ 30 kg/m2). We adjusted for age at examination, (age at examination)2, sex, smoking status (current, former, or never), pack years of smoking, alcohol intake (drinks/week; calculated based on self-reported questionnaires and standardized to 0.5 oz alcohol/drink) (32), educational level, physical activity index (estimated based on self-reported questionnaires) (33), anti-hypertensive medication use, statin use, quartile of median household income in the participant's census tract in 2000, cardiovascular disease, diabetes, and a cohort identifier. For MDCT analyses, we replaced age at examination with age at CT scan and additionally adjusted for height. Distance to the nearest major roadway was loge transformed to account for hypothesized air pollution dispersion pattern and the log-linear relationship between residential distance to major roadway and cardiovascular outcomes as in our previous work (34, 35).
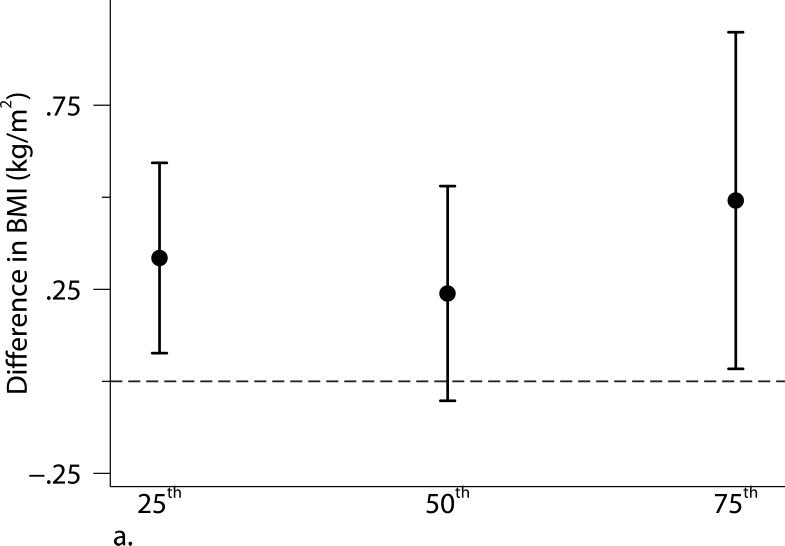
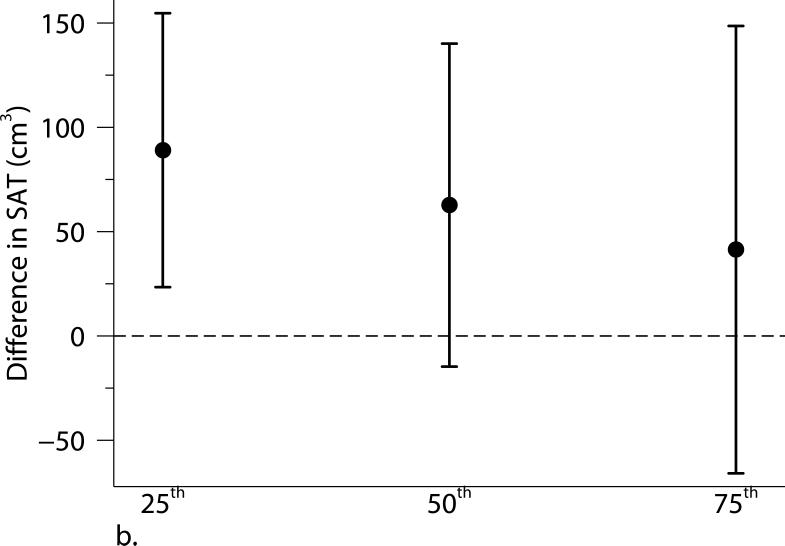
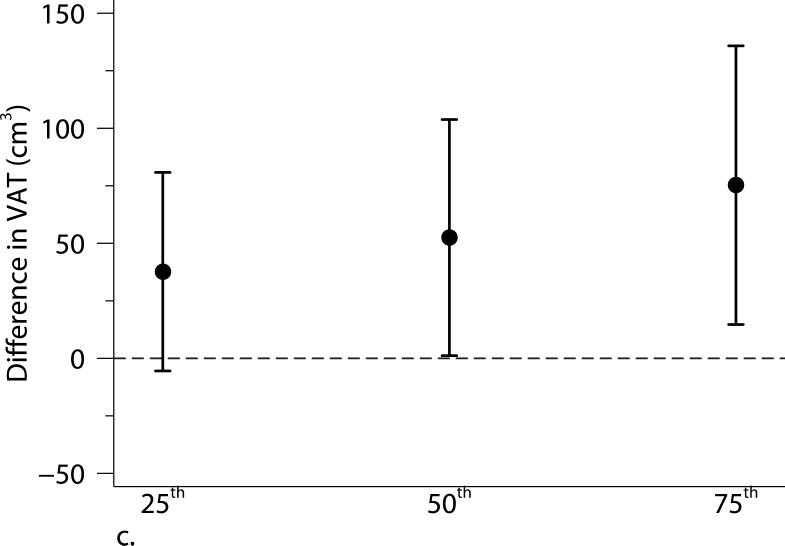
For sensitivity analyses, we excluded participants who were current smokers, or had previous cardiovascular disease or diabetes. We further examined the robustness of our findings by adjusting for additional measures of socioeconomic position, including individual-level self-reported usual occupation (laborer; sales/homemaker/clerical; professional/executive/supervisory/technical; and unspecified) (36), median value of owner occupied housing units in the census tract, and population density (population/km2) in the census tract. We additionally explored whether associations differed by median age (>/≤ 52 years old), sex, or a binary educational level indicator (high school or less vs. some college or higher) by adding interaction terms to the model. To estimate the influence of choosing the year 2003 as the index year, we assessed the associations between three-year average PM2.5 (2003-2005) and adiposity measures. We also evaluated the influence of adjusting for time by additionally including year of CT scan (categorical variable), date of CT scan (continuous variable), and days between CT scan and cohort examination visit for MDCT analyses. Additionally, we used quantile regression models to explore the associations at each quartile (25th, 50th, and 75th) of the distributions of these adiposity measures.
Results from the PM2.5 analyses were scaled to 1.5 μg/m3, which is approximately the interquartile range of the 2003 annual average of PM2.5 concentration. Results from the residential proximity analyses were scaled by a factor of −2, which corresponds to contrasting participants who lived 60 m from a major roadway to those who lived 440 m from a major roadway, an approximation of the interquartile range of loge-transformed distance. We examined the linear trend for road category analyses by assigning participants in each road category the median value of loge-transformed distance within that category and then replaced the road category variables with this continuous variable in the models.
Scaled regression coefficients and odds ratios (ORs) were reported with 95% confidence intervals (CIs). A two-tailed p-value < 0.05 was considered statistically significant. Analyses were performed using PROC GLM, PROC GENMOD, and PROC QUANTREG in SAS 9.4 (SAS Institute, Inc., Cary, NC). Figures were plotted using Stata 13 (StataCorp LP, College Station, TX).
Results
Table 1 shows the characteristics of the study population. The mean age at the time of MDCT scan was 53.9 (standard deviation (SD): 11.8) years old and 52.1% were women. Of all the participants, 12.4% were current smokers, 8.1% had cardiovascular disease, and 7.3% had diabetes. The 2003 annual average PM2.5 concentration was 10.6 μg/m3, which was lower than the current U.S. Environmental Protection Agency's National Ambient Air Quality Standard (annual average PM2.5: 12.0 μg/m3).
Table 1.
Characteristics of the 2,372 participants.
| N (%) or Mean [SD] | |
|---|---|
| Offspring cohort | 1,090 (46.0%) |
| Age*, years | 53.9 [11.8] |
| Women | 1,236 (47.9%) |
| Alcohol, drinks/week | 4.8 [7.2] |
| Current smoker | 294 (12.4%) |
| Former Smoker | 953 (40.2%) |
| Education | |
| < High school | 41 (1.7%) |
| High School | 521 (22.0%) |
| Some college | 771 (32.5%) |
| College graduate | 1,039 (43.8%) |
| Antihypertensive medication use | 541 (22.8%) |
| Statins use | 351 (14.8%) |
| Cardiovascular disease* | 192 (8.1%) |
| Diabetes | 173 (7.3%) |
| PM2.5 †, μg/m3 | 10.6 [1.4] |
| Distance ‡, m | 273 [254] |
| Distance categories ‡ | |
| 0-50 m | 487 (23.0%) |
| 50-100 m | 204 (9.6%) |
| 100-200 m | 373 (17.6%) |
| 200-400 m | 480 (22.7%) |
| 400-1000 m | 574 (27.1%) |
Abbreviation: SD, standard deviation; PM2.5, fine particulate matter.
At the time of CT scan.
2003 annual average.
254 participants lived more than 1,000 meters from the nearest major roadway.
Table 2 shows the characteristics of the adiposity measures and Spearman partial correlation coefficients adjusting for sex. Of the 2,372 participants, 27.7% (N=657) were obese (BMI ≥ 30 kg/m2). BMI was highly correlated with both SAT and VAT, and SAT was moderately correlated with VAT.
Table 2.
Characteristics of adiposity measures and the correlation between these measures.
| N | Mean [SD] | Interquartile range | Correlation coefficients* |
||
|---|---|---|---|---|---|
| SAT | VAT | ||||
| BMI, kg/m2 | 2,372 | 27.8 [5.3] | 6.4 | 0.83 | 0.73 |
| SAT, cm3 | 2,372 | 2,914 [1,391] | 1,704 | 0.66 | |
| VAT, cm3 | 2,372 | 1,828 [1,046] | 1,535 | ||
Abbreviation: SD, standard deviation; BMI, body mass index; SAT, subcutaneous adipose tissue; VAT, visceral adipose tissue.
Spearman partial correlation coefficients, adjusted for sex.
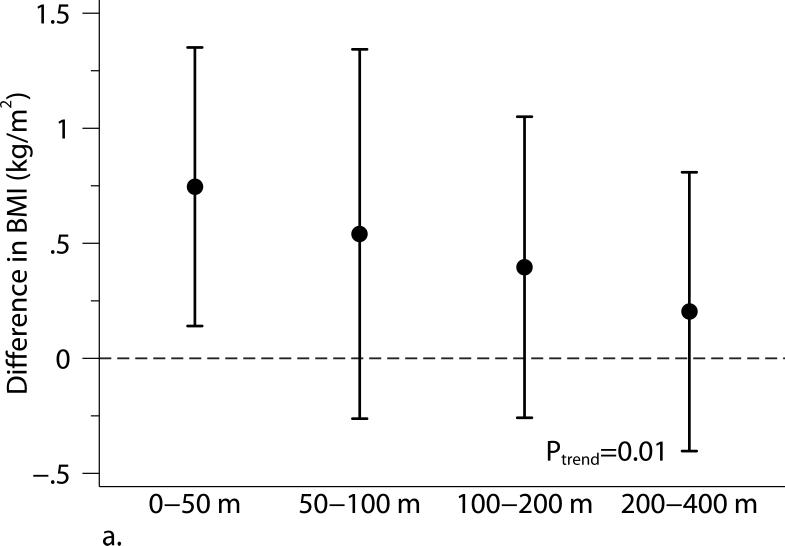
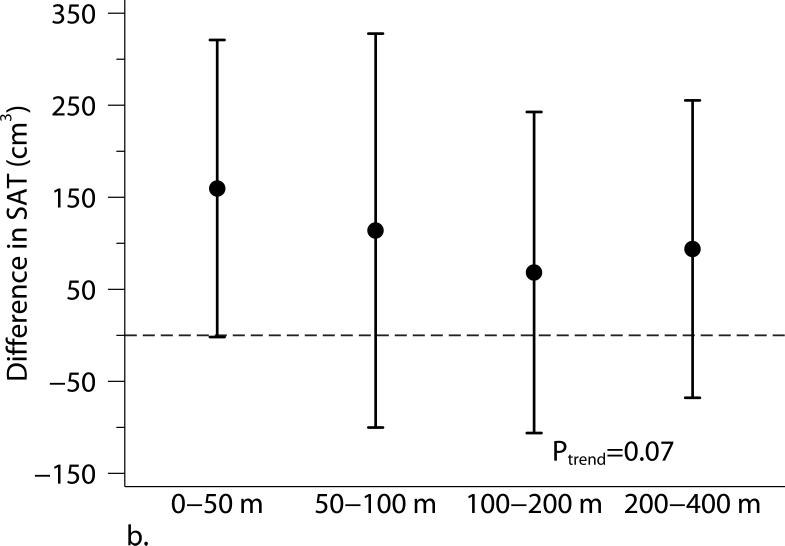
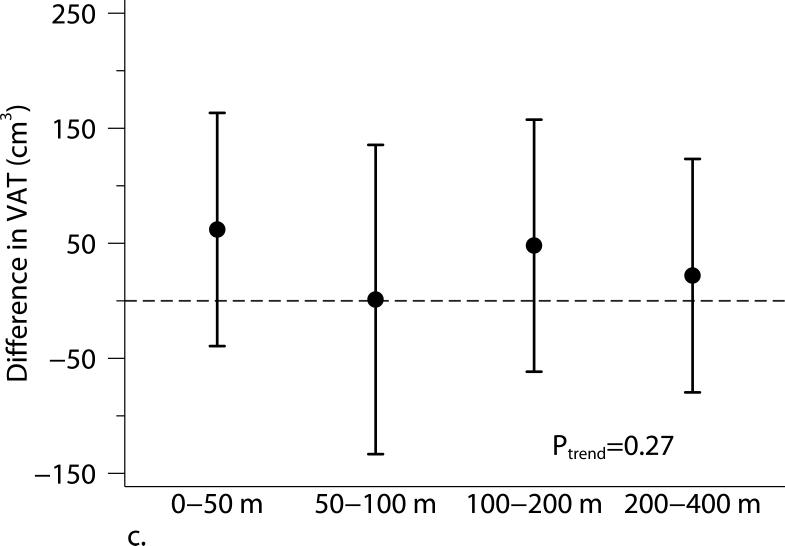
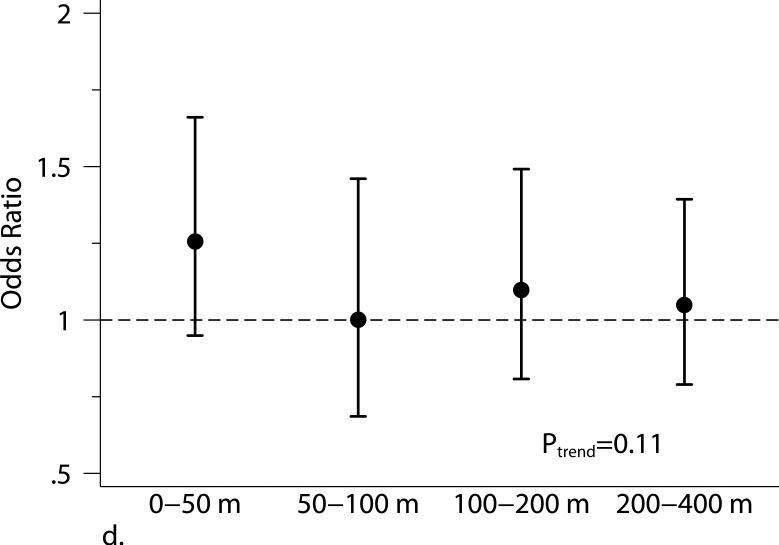
Living closer to a major roadway was associated with higher BMI and higher SAT (Table 3 and Figure 1). Compared with participants who lived 440 m from the major roadway, those who lived 60 m from the major roadway had higher BMI (β=0.37 kg/m2, 95% CI: 0.10, 0.65 kg/m2) and higher SAT (β=78.4 cm3, 95% CI: 4.5, 152.3 cm3). The positive association between living closer to a major roadway and higher VAT was weaker and the 95% CI overlapped the null (β= 41.8 cm3, 95% CI: −4.7, 88.2 cm3). The 2003 annual average PM2.5 was not associated with adiposity measures.
Table 3.
Associations of distance to a major roadway and PM2.5 with adiposity measures.
| Closer to a major roadway |
2003 annual average PM2.5 |
|||
|---|---|---|---|---|
| β * | 95% CI | β * | 95% CI | |
| BMI, kg/m2 | 0.37 | 0.10, 0.65 | 0.08 | −0.14, 0.30 |
| SAT, cm3 | 78.4 | 4.5, 152.3 | 33.0 | −25.3, 91.3 |
| VAT, cm3 | 41.8 | −4.7, 88.2 | −10.5 | −46.9, 25.9 |
| Odds Ratio* | 95% CI | Odds Ratio* | 95% CI | |
| Obesity † | 1.10 | 0.97, 1.25 | 1.01 | 0.92, 1.12 |
Abbreviation: BMI, body mass index; SAT, subcutaneous adipose tissue; VAT, visceral adipose tissue.
Models were adjusted for age at examination, and (age at examination)2; sex; smoking status (current, former, or never); pack years; alcohol intake; educational level; physical activity; anti-hypertensive medication use; statin use; quartile of median household income in the participant's census tract in 2000; cardiovascular disease; diabetes, and a cohort identifier. For MDCT analyses, we replaced age at examination with age at CT scan and additionally adjusted for height. Results from distance analyses were scaled to approximate comparing participants who lived 60 m from the nearest major roadway to those who lived 440 m from the nearest major roadway. Results from PM2.5 analyses were scaled to be as equivalent to per 1.5 μg/m3 increase in 2003 annual PM2.5 concentrations.
Defned as BMI ≥ 30 kg/m2.
Figure 1.
The associations between distance categories and (a) body mass index (BMI), (b) subcutaneous adipose tissue (SAT), (c) visceral adipose tissue (VAT), and (d) obesity (BMI ≥ 30 kg/m2). Models were adjusted for age at examination, and (age at examination)2; sex; smoking status (current, former, or never); pack years; alcohol intake; educational level; physical activity; anti-hypertensive medication use; statin use; quartile of median household income in the participant's census tract in 2000; cardiovascular disease; diabetes, and a cohort identifier. For MDCT analyses, we replaced age at examination with age at CT scan and additionally adjusted for height. P-values from trend tests are shown in the plots. Error bars indicate the 95% confidence intervals.
Excluding participants who were current smokers or participants who had cardiovascular disease or diabetes did not alter our results substantially. Adjusting for individual-level usual occupation, census tract median value of owner occupied housing units, and census tract population density did not materially alter our results (Supplemental Figure S1). The associations were not altered when using the 2003-2005 average PM2.5 or additionally adjusting for time covariates. We found some evidence of stronger associations of living closer to a major roadway with BMI and SAT among younger (≤ 52 years old) or female participants (Supplemental Table S2). Quantile regression analyses between proximity to the nearest major roadway and adiposity measures confirmed our findings in the primary analyses: participants who lived closer to a major roadway had higher BMI, SAT, and VAT than those who lived further away, and the associations were consistent across quartiles of the distribution of each adiposity measure. Additionally, the associations of distance to a major roadway with higher percentiles of VAT appeared stronger than the associations with lower percentiles of VAT (Figure 2).
Figure 2.
Associations between distance to the nearest major roadway and quartiles of the distributions of (a) body mass index (BMI), (b) subcutaneous adipose tissue (SAT), and (c) visceral adipose tissue (VAT). Models were adjusted for age at examination, and (age at examination)2; sex; smoking status (current, former, or never); pack years; alcohol intake; educational level; physical activity; anti-hypertensive medication use; statin use; quartile of median household income in the participant's census tract in 2000; cardiovascular disease; diabetes, and a cohort identifier. For MDCT analyses, we replaced age at examination with age at CT scan and additionally adjusted for height. Results were scaled to approximate comparing participants who lived 60 m from the nearest major roadway to those who lived 440 m from the nearest major roadway. Error bars indicate the 95% confidence intervals.
Discussion
In the present study, living closer to a major roadway was associated with higher BMI. We also observed similar associations between distance to the nearest major roadway and SAT but weaker for VAT. We found no association between annual average PM2.5 and BMI or measures of abdominal adiposity. We further found some evidence suggesting stronger associations among participants who had higher VAT.
Few studies have examined and reported the associations of residential proximity to the nearest roadway and ambient PM2.5 with BMI and abdominal adipose tissue measures among adults. Our results are consistent with findings from the Southern California Children's Health Study to some extent. In that study, higher levels of traffic-related pollution were associated with higher BMI growth and BMI after four (17) and eight years (18, 19) of follow-up. In a study conducted among adults, Ponticiello et al. found higher mean BMI among traffic policemen compared with indoor police workers (20). However, the authors did not adjust for any characteristics that may have differed between the policemen and indoor workers.
Controlled animal studies have reported that mice exposed to PM2.5 had more visceral adipose tissue than mice exposed to filtered air. Among male C57BL/6 mice (6-week old) fed with high-fat chow, after a 24-week PM2.5 exposure (72.7 μg/m3; 6 hours/day, 5 days/week), Sun et al. found significantly higher visceral fat mass but not subcutaneous fat mass, compared to mice exposed to filtered air (7). Among a group of 3-week old male C57BL/6 mice fed with normal diet, exposure to PM2.5 (111.0 μg/m3; 6 hours/day, 5 days/week) was associated with an increase in both visceral and subcutaneous fat content compared to mice exposed to filtered air (8). In both experiments, exposure to PM2.5 induced adipose tissue inflammation and metabolic dysfunction (7, 8). However, the exposure concentrations in those animal studies were higher than the annual average PM2.5 concentration in our study, and the relevance of animal data to assessing the association between ambient air pollution and abdominal adiposity in humans is unknown. In the current study, we observed no association between residential-based estimates of annual average PM2.5 with adiposity measures among adults.
This discrepancy between results for the residential proximity to the nearest major roadway and the satellite model-based annual average PM2.5 might be explained by differences between these two exposures. The proximity to a major roadway could be viewed as an integrated measure of near-road exposures. It captures information about traffic-related components besides PM2.5, such as traffic-related gaseous pollutants, road dust, traffic noise, traffic light, vibration, and possible psychological stress (17, 37). However, the satellite model-based PM2.5 estimation captures information about regional background pollution levels, local PM2.5 components that may be from emission sources far from major roadways, transported PM2.5 components from other regions, and local meteorology conditions (23). Residual confounding may also cause this discrepancy if there were some unmeasured variables that were consistently associated with living closer to a major roadway and higher adiposity measures but were not associated with satellite model-based PM2.5 predictions. However, this seems unlikely to be the explanation in our study because we have adjusted for a large set of potential confounders in our models, including neighborhood-level measures of socio-economic position that vary spatially, and the influence of residual confounding was expected to be small.
There are several limitations of our study that should be noted. First, participants enrolled in the MDCT study were a relatively healthy cohort and they were predominantly white individuals of European ancestry and middle-aged. Thus, our findings may not be generalizable to other ethnicities and age groups. Second, although we have adjusted for demographic factors, lifestyle factors, and socio-economic position, we cannot exclude the possibility of residual confounding. Third, the adipose tissue volumes were measured only once for each participant, we were not able to assess progression of adiposity. Last, we did not have statistical power to examine whether the observed associations differ by disease status, such as cardiovascular disease or diabetes. However, excluding participants with cardiovascular disease or diabetes did not materially change our results.
Our study also has several strengths. Our study population was from large well-characterized cohorts with standardized protocols for physical examinations and adipose deposition assessments. The large sample size in our study allowed us to adjust for demographic characteristics, lifestyle factors, and individual- and area-level of socioeconomic position.
Although we were not able to directly measure walkability, we have adjusted for individual-level physical activity in the models. We used a novel spatial-temporal model to estimate PM2.5 at a high resolution, and we precisely quantified abdominal adipose tissue volumes using MDCT. The technique has high inter- and intra-reader reliability. Last, assessment of air pollution and adiposity were performed independently of each other, which decreased potential differential measurement errors in exposure and outcome assessments.
Conclusion
Among this relatively large cohort of adults living predominantly in the Northeastern U.S., we found evidence that living closer to a major roadway was associated with higher overall and abdominal adiposity. However, we observed no association of annual PM2.5 with adiposity measures. Future longitudinal studies with repeated adiposity measures are necessary to confirm or refute our findings and to extend our findings by exploring changes in adiposity measures associated with traffic-related air pollution.
Supplementary Material
Provide 1 to 3 bullet point answers. Remember to also include these in your Main Document before your abstract.
- What is already known about this subject? (or for Review Proposals/ Reviews, what major reviews have already been published on this subject?)
Experimental studies have demonstrated that exposure to concentrated fine particulate matter air pollution is associated with increased abdominal adiposity in animal models.
Living in areas with high traffic density is associated with higher body mass index (BMI) growth among children, but few studies examined this association among adults. One study found higher BMI among outdoor traffic policemen than indoor office workers.
- What does this study add?
This study among participants from the Framingham Heart Study demonstrated that living closer to a major roadway is associated with higher BMI and subcutaneous and visceral fat volumes.
The associations persisted after adjusting for a wide range of social, demographic, and behavioral characteristics.
Spatial-temporal model-based estimates of 2003 annual PM2.5 concentrations were not associated with any of the adiposity measures, suggesting that factors other than PM2.5 may be at least partially responsible for the observed associations.
Acknowledgments
This publication was made possible by USEPA grant RD-83479801. Its contents are solely the responsibility of the grantee and do not necessarily represent the official views of the USEPA. Further, USEPA does not endorse the purchase of any commercial products or services mentioned in the publication. The views expressed in this manuscript are those of the authors and do not necessarily represent the views of the National Heart, Lung, and Blood Institute; the National Institutes of Health; or the U.S. Department of Health and Human Services. This work was further supported by the National Heart, Lung and Blood Institute of the National Institutes of Health contracts and grants HHSN268201500001I, T32HL007575, and National Institutes of Environmental Health Sciences grants P01 ES09825, K23ES026204, and P30ES000002.
Footnotes
Disclosure: Dr. Li has nothing to disclose; Dr. Dorans reports grants from National Institutes of Health (NIH); Dr. Wilker reports grants from NIH, and non-financial support from Servier outside the submitted work; Dr. Rice reports grants from National Institutes of Environmental Health Sciences (NIEHS); Dr. Schwartz reports grants from the United States Environmental Protection Agency (USEPA) and NIH; Dr. Coull reports grants from USEPA and NIH; Dr. Koutrakis reports grants from USEPA; Dr. Gold reports grants from USEPA; Dr. Fox reports personal fees from Merck after 12/15/2015; Dr. Mittleman reports grants from USEPA and NIH.
References
- 1.Ogden CL, Carroll MD, Kit BK, Flegal KM. Prevalence of childhood and adult obesity in the United States, 2011-2012. JAMA. 2014;311:806–814. doi: 10.1001/jama.2014.732. [DOI] [PMC free article] [PubMed] [Google Scholar]
- 2.Pou KM, Massaro JM, Hoffmann U, et al. Visceral and subcutaneous adipose tissue volumes are cross-sectionally related to markers of inflammation and oxidative stress: the Framingham Heart Study. Circulation. 2007;116:1234–1241. doi: 10.1161/CIRCULATIONAHA.107.710509. [DOI] [PubMed] [Google Scholar]
- 3.Fox CS, Massaro JM, Hoffmann U, et al. Abdominal visceral and subcutaneous adipose tissue compartments: association with metabolic risk factors in the Framingham Heart Study. Circulation. 2007;116:39–48. doi: 10.1161/CIRCULATIONAHA.106.675355. [DOI] [PubMed] [Google Scholar]
- 4.Jain SH, Massaro JM, Hoffmann U, et al. Cross-sectional associations between abdominal and thoracic adipose tissue compartments and adiponectin and resistin in the Framingham Heart Study. Diabetes Care. 2009;32:903–908. doi: 10.2337/dc08-1733. [DOI] [PMC free article] [PubMed] [Google Scholar]
- 5.Preis SR, Massaro JM, Robins SJ, et al. Abdominal subcutaneous and visceral adipose tissue and insulin resistance in the Framingham heart study. Obesity (Silver Spring) 2010;18:2191–2198. doi: 10.1038/oby.2010.59. [DOI] [PMC free article] [PubMed] [Google Scholar]
- 6.Rosenquist KJ, Pedley A, Massaro JM, et al. Visceral and subcutaneous fat quality and cardiometabolic risk. JACC Cardiovasc Imaging. 2013;6:762–771. doi: 10.1016/j.jcmg.2012.11.021. [DOI] [PMC free article] [PubMed] [Google Scholar]
- 7.Sun Q, Yue P, Deiuliis JA, et al. Ambient air pollution exaggerates adipose inflammation and insulin resistance in a mouse model of diet-induced obesity. Circulation. 2009;119:538–546. doi: 10.1161/CIRCULATIONAHA.108.799015. [DOI] [PMC free article] [PubMed] [Google Scholar]
- 8.Xu X, Yavar Z, Verdin M, et al. Effect of early particulate air pollution exposure on obesity in mice: role of p47phox. Arterioscler Thromb Vasc Biol. 2010;30:2518–2527. doi: 10.1161/ATVBAHA.110.215350. [DOI] [PMC free article] [PubMed] [Google Scholar]
- 9.Xu Z, Xu X, Zhong M, et al. Ambient particulate air pollution induces oxidative stress and alterations of mitochondria and gene expression in brown and white adipose tissues. Part Fibre Toxicol. 2011;8:20. doi: 10.1186/1743-8977-8-20. [DOI] [PMC free article] [PubMed] [Google Scholar]
- 10.Xu X, Liu C, Xu Z, et al. Long-term exposure to ambient fine particulate pollution induces insulin resistance and mitochondrial alteration in adipose tissue. Toxicol Sci. 2011;124:88–98. doi: 10.1093/toxsci/kfr211. [DOI] [PMC free article] [PubMed] [Google Scholar]
- 11.Mendez R, Zheng Z, Fan Z, Rajagopalan S, Sun Q, Zhang K. Exposure to fine airborne particulate matter induces macrophage infiltration, unfolded protein response, and lipid deposition in white adipose tissue. Am J Transl Res. 2013;5:224–234. [PMC free article] [PubMed] [Google Scholar]
- 12.Sun L, Liu C, Xu X, et al. Ambient fine particulate matter and ozone exposures induce inflammation in epicardial and perirenal adipose tissues in rats fed a high fructose diet. Part Fibre Toxicol. 2013;10:43. doi: 10.1186/1743-8977-10-43. [DOI] [PMC free article] [PubMed] [Google Scholar]
- 13.Brook RD, Franklin B, Cascio W, et al. Air pollution and cardiovascular disease: a statement for healthcare professionals from the Expert Panel on Population and Prevention Science of the American Heart Association. Circulation. 2004;109:2655–2671. doi: 10.1161/01.CIR.0000128587.30041.C8. [DOI] [PubMed] [Google Scholar]
- 14.Brook RD, Rajagopalan S, Pope CA, 3rd, et al. Particulate matter air pollution and cardiovascular disease: An update to the scientific statement from the American Heart Association. Circulation. 2010;121:2331–2378. doi: 10.1161/CIR.0b013e3181dbece1. [DOI] [PubMed] [Google Scholar]
- 15.Rao X, Montresor-Lopez J, Puett R, Rajagopalan S, Brook RD. Ambient air pollution: an emerging risk factor for diabetes mellitus. Curr Diab Rep. 2015;15:603. doi: 10.1007/s11892-015-0603-8. [DOI] [PubMed] [Google Scholar]
- 16.Thiering E, Heinrich J. Epidemiology of air pollution and diabetes. Trends Endocrinol Metab. 2015;26:384–394. doi: 10.1016/j.tem.2015.05.002. [DOI] [PubMed] [Google Scholar]
- 17.Jerrett M, McConnell R, Wolch J, et al. Traffic-related air pollution and obesity formation in children: a longitudinal, multilevel analysis. Environ Health. 2014;13:49. doi: 10.1186/1476-069X-13-49. [DOI] [PMC free article] [PubMed] [Google Scholar]
- 18.Jerrett M, McConnell R, Chang CC, et al. Automobile traffic around the home and attained body mass index: a longitudinal cohort study of children aged 10-18 years. Prev Med. 2010;50(Suppl 1):S50–58. doi: 10.1016/j.ypmed.2009.09.026. [DOI] [PMC free article] [PubMed] [Google Scholar]
- 19.McConnell R, Shen E, Gilliland FD, et al. A longitudinal cohort study of body mass index and childhood exposure to secondhand tobacco smoke and air pollution: the Southern California Children's Health Study. Environ Health Perspect. 2015;123:360–366. doi: 10.1289/ehp.1307031. [DOI] [PMC free article] [PubMed] [Google Scholar]
- 20.Ponticiello BG, Capozzella A, Di Giorgio V, et al. Overweight and urban pollution: preliminary results. Sci Total Environ. 2015;518-519:61–64. doi: 10.1016/j.scitotenv.2015.02.084. [DOI] [PubMed] [Google Scholar]
- 21.Kannel WB, Feinleib M, McNamara PM, Garrison RJ, Castelli WP. An investigation of coronary heart disease in families. The Framingham offspring study. Am J Epidemiol. 1979;110:281–290. doi: 10.1093/oxfordjournals.aje.a112813. [DOI] [PubMed] [Google Scholar]
- 22.Splansky GL, Corey D, Yang Q, et al. The Third Generation Cohort of the National Heart, Lung, and Blood Institute's Framingham Heart Study: design, recruitment, and initial examination. Am J Epidemiol. 2007;165:1328–1335. doi: 10.1093/aje/kwm021. [DOI] [PubMed] [Google Scholar]
- 23.Kloog I, Chudnovsky AA, Just AC, et al. A new hybrid spatio-temporal model for estimating daily multi-year PM2. 5 concentrations across northeastern USA using high resolution aerosol optical depth data. Atmospheric Environment. 2014;95:581–590. doi: 10.1016/j.atmosenv.2014.07.014. [DOI] [PMC free article] [PubMed] [Google Scholar]
- 24.van Donkelaar A, Martin RV, Park RJ. Estimating ground-level PM2. 5using aerosol optical depth determined from satellite remote sensing. J Geophys Res. 2006;111 doi: 10. 1029/2005jd006996. [Google Scholar]
- 25.Zhang H, Hoff RM, Engel-Cox JA. The Relation between Moderate Resolution Imaging Spectroradiometer (MODIS) Aerosol Optical Depth and PM2. 5over the United States: A Geographical Comparison by U. S. Environmental Protection Agency Regions. J Air & Waste Manage Assoc. 2009;59:1358–1369. doi: 10.3155/1047-3289.59.11.1358. [DOI] [PubMed] [Google Scholar]
- 26.Kloog I, Koutrakis P, Coull BA, Lee HJ, Schwartz J. Assessing temporally and spatially resolved PM2. 5 exposures for epidemiological studies using satellite aerosol optical depth measurements. Atmospheric Environment. 2011;45:6267–6275. [Google Scholar]
- 27.Lee HJ, Liu Y, Coull BA, Schwartz J, Koutrakis P. A novel calibration approach of MODIS AOD data to predict PM2. 5 concentrations. Atmos Chem Phys. 2011;11:7991–8002. [Google Scholar]
- 28.Rice MB, Ljungman PL, Wilker EH, et al. Long-term exposure to traffic emissions and fine particulate matter and lung function decline in the Framingham heart study. Am J Respir Crit Care Med. 2015;191:656–664. doi: 10.1164/rccm.201410-1875OC. [DOI] [PMC free article] [PubMed] [Google Scholar]
- 29.Wilker EH, Preis SR, Beiser AS, et al. Long-term exposure to fine particulate matter, residential proximity to major roads and measures of brain structure. Stroke. 2015;46:1161–1166. doi: 10.1161/STROKEAHA.114.008348. [DOI] [PMC free article] [PubMed] [Google Scholar]
- 30.Zhou Y, Levy JI. Factors influencing the spatial extent of mobile source air pollution impacts: a meta-analysis. BMC Public Health. 2007;7:89. doi: 10.1186/1471-2458-7-89. [DOI] [PMC free article] [PubMed] [Google Scholar]
- 31.Maurovich-Horvat P, Massaro J, Fox CS, Moselewski F, O'Donnell CJ, Hoffmann U. Comparison of anthropometric, area- and volume-based assessment of abdominal subcutaneous and visceral adipose tissue volumes using multi-detector computed tomography. Int J Obes (Lond) 2007;31:500–506. doi: 10.1038/sj.ijo.0803454. [DOI] [PubMed] [Google Scholar]
- 32.Elias PK, Elias MF, D'Agostino RB, Silbershatz H, Wolf PA. Alcohol consumption and cognitive performance in the Framingham Heart Study. Am J Epidemiol. 1999;150:580–589. doi: 10.1093/oxfordjournals.aje.a010056. [DOI] [PubMed] [Google Scholar]
- 33.Kannel WB, Sorlie P. Some health benefits of physical activity. The Framingham Study. Arch Intern Med. 1979;139:857–861. [PubMed] [Google Scholar]
- 34.Wilker EH, Mostofsky E, Lue SH, et al. Residential proximity to high-traffic roadways and poststroke mortality. J Stroke Cerebrovasc Dis. 2013;22:e366–372. doi: 10.1016/j.jstrokecerebrovasdis.2013.03.034. [DOI] [PMC free article] [PubMed] [Google Scholar]
- 35.Rosenbloom JI, Wilker EH, Mukamal KJ, Schwartz J, Mittleman MA. Residential proximity to major roadway and 10-year all-cause mortality after myocardial infarction. Circulation. 2012;125:2197–2203. doi: 10.1161/CIRCULATIONAHA.111.085811. [DOI] [PMC free article] [PubMed] [Google Scholar]
- 36.Loucks EB, Lynch JW, Pilote L, et al. Life-course socioeconomic position and incidence of coronary heart disease: the Framingham Offspring Study. Am J Epidemiol. 2009;169:829–836. doi: 10.1093/aje/kwn403. [DOI] [PMC free article] [PubMed] [Google Scholar]
- 37.McConnell R, Berhane K, Yao L, et al. Traffic, susceptibility, and childhood asthma. Environ Health Perspect. 2006;114:766–772. doi: 10.1289/ehp.8594. [DOI] [PMC free article] [PubMed] [Google Scholar]
Associated Data
This section collects any data citations, data availability statements, or supplementary materials included in this article.


