

Abstract
Purpose
Structural and compositional heterogeneity within drusen, composed of lipid, carbohydrates, and proteins, have been previously described. We sought to detect and define phenotypic patterns of drusen heterogeneity in the form of optical coherence tomography–reflective drusen substructures (ODS) and examine their associations with age-related macular degeneration (AMD)-related features and AMD progression.
Design
Retrospective analysis in a prospective study.
Participants
Patients with intermediate AMD (n = 349) enrolled in the multicenter Age-Related Eye Disease Study 2 (AREDS2) ancillary spectral domain optical coherence tomography (SD OCT) study.
Methods
Baseline SD OCT scans of 1 eye per patient were analyzed for presence of ODS. Cross-sectional and longitudinal associations of ODS presence with AMD-related features visible on SD OCT and color photographs, including drusen volume, geographic atrophy (GA), and preatrophic features, were evaluated for the entire macular region. Similar associations were also made locally within a 0.5-mm diameter region around individual ODS and corresponding control region without ODS in the same eye.
Main Outcome Measures
Preatrophy SD OCT changes and GA, central GA, and choroidal neovascularization (CNV) from color photographs.
Results
Four phenotypic subtypes of ODS were defined: low reflective cores, high reflective cores, conical debris, and split drusen. Of the 349 participants, there were 307 eligible eyes and 74 (24%) had at least 1 ODS. The ODS at baseline were associated with (1) greater macular drusen volume at baseline (P < 0.001), (2) development of preatrophic changes at year 2 (P = 0.001–0.01), and (3) development of macular GA (P = 0.005) and preatrophic changes at year 3 (P = 0.002–0.008), but not development of CNV. The ODS at baseline in a local region were associated with (1) presence of preatrophy changes at baseline (P = 0.02-0.03) and (2) development of preatrophy changes at years 2 and 3 within the region (P = 0.008-0.05).
Conclusions
Optical coherence tomography–reflective drusen substructures are optical coherence tomography–based biomarkers of progression to GA, but not to CNV, in eyes with intermediate AMD. Optical coherence tomography–reflective drusen substructures may be a clinical entity helpful in monitoring AMD progression and informing mechanisms in GA pathogenesis.
Central geographic atrophy (GA) and choroidal neovascularization (CNV) are associated with visual acuity loss and are hallmark findings of advanced age-related macular degeneration (AMD), the leading cause of irreversible blindness in developed countries.1–3 Biomarkers that can improve the prediction of progression from intermediate to late AMD will be useful in identifying patients at risk for vision loss from AMD.4
The hallmark of early and intermediate AMD is the presence of drusen, visible on clinical examination as yellowish deposits located in the macula.5 Drusen have been shown to be compositionally diverse, composed of a complex mixture of lipids and proteins.6 On histopathologic analyses, drusen have demonstrated heterogeneous staining patterns that reveal distinct substructures differentially composed of lipids, carbohydrates, and proteins.7–10 The functional significance of these drusen substructures and how they may be related to AMD progression are unclear.
Spectral-domain optical coherence tomography (SD OCT) enables in vivo evaluation of drusen substructures because it provides reflectance-based cross-sectional visualization of subretinal structures at high (<5 μm) axial resolution.11,12 We previously reported an association between hyperreflective and hyporeflective drusen and GA.13 Furthermore, we have shown that other drusen-related features, such as drusen volume and hyperreflective foci above drusen, predict progression to GA.14,15 We thus hypothesized that patterns within drusen, or optical coherence tomography–reflective drusen substructures (ODS), in eyes with AMD may confer risk of GA progression and would provide additional insight into individual risk of AMD progression.
In this study, we evaluated eyes with intermediate AMD from the prospective Age Related Eye Disease Study 2 (AREDS2) Ancillary SD OCT Study for the presence of ODS in the macula and classified each ODS into 4 phenotypic subtypes. We examined the relationships between ODS and AMD-related features visible on SD OCT and color photograph cross-sectionally and longitudinally. In addition, we sought to learn whether any apparent effect of ODS was exerted primarily in the local area of the ODS or found more generally across the entire macula.
Methods
All participants were enrolled in the AREDS2 (ClinicalTrials.gov identifier NCT00345176) and consented to participate in the AREDS2 Ancillary SD OCT (A2A SD OCT, ClinicalTrials.gov identifier NCT00734487) study. The study was approved by the Institutional Review Board at each of 4 clinical sites. Informed written research consent was obtained before participation from each study participant, and the research protocol followed tenets of human research as presented in the Declaration of Helsinki. Data were collected, stored, and managed in compliance with Health Insurance Portability and Accountability Act guidelines.
Study Design and Procedures
The A2A SD OCT study design has been described in previous work.13 The participating sites recruited 349 participants aged 50 to 85 years with at least 1 intermediate AMD eye. Intermediate AMD eyes were defined as eyes containing at least 1 large drusen (diameter ≥125 μm), but no central GA or neovascularization. The study eyes could contain GA that did not involve the foveal center, consistent with the AREDS2 definition of Category 3 AMD.16 At the time of baseline imaging in the A2A Study, 32 were excluded for bilateral advanced AMD and 10 were excluded for poor image quality. The remaining 307 eyes were enrolled in the study, and data on age, smoking status, and statin use for each participant were collected at study baseline.16 At baseline and each annual study visit, the participant received a comprehensive eye examination including best-corrected visual acuity and ocular imaging conducted by certified personnel using standardized protocol for color photographs and SD OCT.13 The SD OCT imaging was with the Bioptigen SD OCT imaging system (SDOIS; Bioptigen, Research Triangle Park, NC). As previously reported, 2 raster scans, consisting of 100 B-scan lines separated by 66 μm between lines and consisting of 1000 A-scans per line oriented at 0° and 90°, generated SD OCT volumes for each eye. Each scan volume covered an area of 6.7 × 6.7 mm2 and was centered on the fovea.
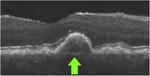
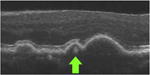
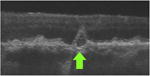
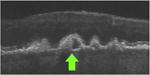
Certified graders analyzed SD OCT volume scans of study eyes for the presence of 1 or more ODS. For scans that were designated as having ODS, 4 graders (M.V., A-K.M.E-H.S., K.P.W., M.M.) independently scanned each frame to phenotypically categorize each ODS into 4 subtypes based on reflectivity patters within drusen: H-type (high-reflective core), L-type (low-reflective core), C-type (conical debris), and S-type (split drusen) (Table 1). In cases of grading disagreement, the A2A SD OCT Chair (CAT) provided arbitration and final assignment. Although ODS as optical coherence tomography (OCT) findings were part of the original study design and grading, the 4 subtypes of ODS were designated and graded subsequent to that. This analysis was thus retrospective although in a prospective group.
Table 1. Optical Coherence Tomography Reflective Drusen Substructures Grading Criteria.
| ODS Type | Grading Criteria | SD OCT Image |
|---|---|---|
| L-type Low reflective cores | Consists of a focal, well-circumscribed subvolume of
distinct reflectivity (i.e., a “core”) within the druse (<1000
μm in diameter) Not contiguous with Bruch's or RPE >2 pixels on a single B-scan Hyporeflective relative to surrounding druse material |
|
| H-type High reflective cores | Consists of a focal, well-circumscribed subvolume of
distinct reflectivity (i.e., a “core”) within the druse (<1000
μm in diameter) Not contiguous with Bruch's or RPE >2 pixels on a single B-scan Hyperreflective relative to surrounding druse material |
|
| C-type Conical debris | Druse (<1000 μm in diameter) has a conical
shape Contains ≥3 focal, well-circumscribed cores Cores are not contiguous with Bruch's or RPE Cores are each >2 pixels on a single B-scan Cores are hyperreflective relative to surrounding druse material |
|
| S-type Split reflective drusen | Entire druse (<1000 μm in diameter) is
split into 2 subvolumes (in any proportion) of distinct levels of reflectivity (low
and high) Each subvolume is >2 pixels on a single B-scan |
|
| None | Druse (<1000 μm in diameter) of homogenous reflectivity |
|
ODS = optical coherence tomography–reflective drusen substructures; RPE = retinal pigment epithelium; SD OCT = spectral-domain optical coherence tomography.
Macula-wide Analysis
Eyes were divided into 2 main groups: those with and those without ODS at baseline. Further, eyes with each particular subtype of ODS were tabulated separately; eyes with more than 1 subtype of ODS were represented multiple times in subtype analyses. Study eyes with any ODS, as well as eyes with H-type, L-type, C-type, and S-type ODS, were each compared with the eyes without ODS with respect to AMD-related features within the central 5-mm diameter macular region of each study eye at baseline, year 2, and year 3.
Regional Analysis
Within eyes with ODS, a region of interest (ROI) was defined as a circular area of 500 μm diameter around each individual ODS and positioned with the ODS at its center. In the same eye, a custom-designed program defined a control ROI of equal diameter for comparison, which was matched as closely as possible in distance from the foveal center and retinal pigment epithelium-drusen complex (RPEDC) volume. All control ROIs were at least 200 μm from each other and from ODS ROIs in the same eye. It was possible to have more than 1 ODS ROI per eye. For eyes with only 1 ODS, 1 ODS ROI and 1 control ROI were defined. For eyes with 2 or more ODS, only 2 ODS ROIs and 2 matching control ROIs were defined; these 2 pairs of ROIs were selected among candidate lesions on the basis of the closest match with respect to foveal distance and RPEDC volume. We used MATLAB software (MathWorks, Natick, MA) to register all ROIs from baseline onto the corresponding location in the SD OCT scan of each study eye at years 2 and 3, using the foveal center for alignment. The ROIs with any ODS, as well as ROIs with H-type, L-type, C-type, and S-type ODS, were each compared with corresponding ROIs without any ODS with respect to AMD-related features at baseline, year 2, and year 3. Individual ROIs whose limits extended beyond the 5-mm diameter macular region SD OCT scanning field under consideration were excluded in calculation of outcomes based on SD OCT segmentation, but included in the calculation of all other outcomes. This same regional analysis was repeated for control ROIs selected from eyes without ODS. In addition, we used the regional methods to study ROIs 2 years before new-onset ODS to determine any precursor lesions in the location of new-onset ODS.
To evaluate for AMD-related features in color photographs within ODS, we registered ODS ROIs at baseline from SD OCT to their corresponding location on color photographs using a customized MATLAB software program. We graded each region for 1 or more of the following: hyperpigmentation, hypopigmentation (calcific drusen, crystalline drusen, or retinal pigment epithelium [RPE] atrophy), normal RPE, and normal drusen using the Wisconsin age-related maculopathy grading system.17
Outcomes
The primary outcomes for the macula-wide analysis were GA, central GA and CNV on color photograph, and measures of preatrophy on SD OCT for the regional analysis, and these definitions are detailed in Table 2.16–19,22–26 Secondary outcomes were measures of drusen load and features associated with neovascularization, with definitions also detailed in Table 2. Other subretinal lesions, hyperreflective foci above drusen, visual acuity, and neurosensory retina were also studied and detailed in Table 2.15,20,21 In an effort to study the evolution of ODS over time, ROIs at years 2 and 3 in the regional analysis were evaluated for persistence of baseline ODS and transformation of persistent ODS into different subtypes.
Table 2a. Study Outcomes for Macula-wide Analysis.
| Outcome | Source Modality† | Definition | Variable Type‡ | |
|---|---|---|---|---|
| Drusen Load | RPE drusen complex volume (RPEDC, mm3) | SD OCT | Drusen-RPE combined volume; volume between the inner border of the RPE and outer border of Bruch's membrane14 | Continuous |
| OCT drusen volume (mm3) | SD OCT | Volume of RPEDC abnormal thickening ≥3 SD from the mean of a normative dataset for each pixel location in non-AMD eyes14,18 | Continuous | |
| Drusen area (DA) | Color photo | Total drusen area in the macula | Continuous | |
| GA and Preatrophy | RPEDC abnormal thinning volume (RAT, ×10−3, mm3) | SD OCT | Volume of RPEDC abnormal thinning ≤2 SD from the mean of a normative dataset for each pixel location in non-AMD eyes14,18 | Continuous |
| GA area (DA) | Color photo | Total GA area in the macula | Continuous | |
| GA* | Color photo | Circular area >433 μm in diameter of partial or complete depigmentation of the RPE in any part of the macula,19 equivalent to circle I-1 in Wisconsin Age-Related Maculopathy Grading System17 | Binary | |
| Central GA* | Color photo | GA involving the center of the macula16 | Binary | |
| PRL thinning | SD OCT | Loss of volume of region between inner aspect of the outer plexiform layer and inner border of RPEDC compared with adjacent tissue | Binary | |
| RPE disruption | SD OCT | A clear degradation of the reflectivity and thickness of the RPE layer, with persisting outer retinal layers | Binary | |
| RPE atrophy | SD OCT | A complete absence of RPE or contour break with PRL loss | Binary | |
| RPE atrophy, foveal | SD OCT | RPE atrophy in the location 660 μm around the fovea | Binary | |
| Neovascular | IRF | SD OCT | Round or oval hyporeflective areas within the retinal layers usually located within the nuclear layers | Binary |
| SRF | SD OCT | Area of low reflectivity (less than or comparable to the vitreous gel) between the outer surface of the retina and the RPE | Binary | |
| CNV* | Color photo | CNV determined as present by ≥2 of the following criteria: (1) serous detachment of the sensory retina, (2) hemorrhage, (3) RPE detachment, (4) fibrous tissue, or (5) hard exudate; or disciform scarring or history of treatment for neovascular AMD also was sufficient to label CNV | Binary | |
| Other | Subretinal lesions | SD OCT | Pathology occurring beneath the layers of neurosensory retina and anterior to the RPE, including reticular pseudodrusen, subretinal hyperreflective material, presumed vitelliform lesion, scar, and hemorrhage20,21 | Binary |
| Hyperreflective foci | SD OCT | Focal, well-circumscribed hyperreflective lesions within the neurosensory retina overlying drusen not associated with intraretinal vessels15 | Binary | |
| Visual acuity | ETDRS | Visual acuity scored by letters using ETDRS chart | Continuous | |
| Neurosensory retina volume (mm3) | SD OCT | Volume between internal limiting membrane and outer border of PRL | Continuous |
AMD = age-related macular degeneration; CNV = choroidal neovascularization; DA = disc area; ETDRS = Early Treatment Diabetic Retinopathy Study; GA = geographic atrophy; IRF = intraretinal fluid; RAT = retinal pigment epithelium drusen complex abnormal thinning; RPE = retinal pigment epithelium; RPEDC = retinal pigment epithelium drusen complex; SD = standard deviation; SD OCT = spectral domain optical coherence tomography; SRF = subretinal fluid.
Primary study outcomes.
Derived from SD OCT imaging; color photo = derived from color fundus photo using Wisconsin Age-Related Maculopathy Grading System.1
Table 2b. Study Outcomes for Regional Analysis.
| Outcome | Source Modality† | Definition | Variable Type‡ | |
|---|---|---|---|---|
| Drusen Load | RPE drusen complex volume (RPEDC, mm3) | SD OCT | Drusen-RPE combined volume; volume between the inner border of the RPE and outer border of Bruchs membrane14 | Continuous |
| OCT drusen volume (mm3) | SD OCT | Volume of RPEDC abnormal thickening ≥3 SD from the mean of a normative dataset for each pixel location in non-AMD eyes14,18 | Continuous | |
| Preatrophy* | RPEDC abnormal thinning volume (RAT, ×10−3, mm3) | SD OCT | Volume of RPEDC abnormal thinning ≤2 SD from the mean of a normative dataset for each pixel location in non-AMD eyes14,18 | Continuous |
| PRL thinning above drusen | SD OCT | Loss of volume of region between inner aspect of the outer plexiform layer and inner border of RPEDC above drusen compared with adjacent tissue; measured by outer plexiform layer dipping toward RPE | Binary | |
| PRL thinning without drusen | SD OCT | Loss of volume of region between inner aspect of the outer plexiform layer and inner border of RPEDC not associated with drusen compared with adjacent tissue; measured by outer plexiform layer dipping toward RPE | Binary | |
| Ellipsoid zone loss | SD OCT | Ellipsoid zone loss or disruption in the presence or absence of other pathologies | Binary | |
| RPE atrophy | SD OCT | A complete absence of RPE or contour break with PRL loss | Binary | |
| Choroidal increased signal | SD OCT | Increased choroidal signal relative to adjacent areas | Binary | |
| Neovascular | IRF | SD OCT | Round or oval hyporeflective areas within the retinal layers usually located within the nuclear layers | Binary |
| SRF | SD OCT | Area of low reflectivity (less than or comparable to the vitreous gel) between the outer surface of the retina and the RPE | Binary | |
| Other | Subretinal lesions | SD OCT | CNV and pathology occurring beneath the layers of neurosensory retina and anterior to the RPE, including reticular pseudodrusen, subretinal hyperreflective material, presumed vitelliform lesion, scar, and hemorrhage20,21 | Binary |
| Hyperreflective foci | SD OCT | Focal, well-circumscribed hyperreflective lesions within the neurosensory retina overlying drusen not associated with intraretinal vessels15 | Binary |
AMD = age-related macular degeneration; CNV = choroidal neovascularization; DA = disc area; ETDRS = Early Treatment Diabetic Retinopathy Study; IRF = intraretinal fluid; RAT = retinal pigment epithelium drusen complex abnormal thinning; RPE = retinal pigment epithelium; RPEDC = retinal pigment epithelium drusen complex; SD = standard deviation; SD OCT = spectral-domain optical coherence tomography; SRF = subretinal fluid.
Primary study outcomes.
Derived from SD OCT imaging; color photo = derived from color fundus photo using Wisconsin Age-Related Maculopathy Grading System.1
Data Analysis
Macula-wide Analysis
In a cross-sectional analysis, we compared outcomes at baseline in eyes with versus without ODS at baseline. Continuous outcomes were compared using the Wilcoxon rank-sum test, and binary outcomes were compared using the Fisher exact test. In a longitudinal analysis, changes in the continuous outcomes from baseline to year 2 and baseline to year 3 were compared between eyes with and without ODS at baseline using the Wilcoxon rank-sum test, whereas new onset of binary outcomes (defined as occurrence of the outcome in an eye that did not have it at baseline) from baseline to year 2 and baseline to year 3 were compared using the Fisher exact test.
Regional Analysis
In a cross-sectional analysis, we compared outcomes within ODS ROIs with those within paired control ROIs at baseline. Continuous variables were compared using the paired t test with generalized estimating equations (GEEs) to account for multiple regions in each eye, whereas binary variables were compared using the test for difference in proportions for matched pairs (McNemar's test). In a longitudinal analysis, changes in continuous outcomes from baseline to year 2 and baseline to year 3 were compared between ODS ROIs and paired control ROIs defined at baseline using the paired t test with GEE, whereas new onset of binary outcomes from baseline to year 2 and baseline to year 3 were compared using the McNemar's test. In the binary outcome analyses, we assumed for simplicity that the presence of 1 ODS is not linked to the presence of another. Thus, regions were treated independently, although some occurred in the same eye. In the regional analysis in which control ROIs were in non-ODS eyes, the ROIs were not paired. Thus, we used the GEE comparison of means for continuous variables and GEE comparison of proportions for binary variables to account for multiple regions in each eye.
Results
Among the 349 eyes enrolled in the A2A SD OCT Study, 307 eyes met the present study's inclusion criteria. The mean age of patients was 74.5 years (standard deviation, 7.5). Seventy-four eyes (24%) had at least 1 ODS in the macula, and 233 eyes (76%) had none. In the ODS group, mean age of patients was 75 years; 36% had never smoked, 57% were former smokers, and 7% were current smokers; 45% were using statins. In the non-ODS group, the mean age was 74 years; 44% had never smoked, 50% were former smokers, and 6% were current smokers; 52% were using statins. There were no significant differences in age, smoking, or statin use between the ODS and non-ODS groups.
Of the 74 ODS eyes, the mean number of ODS per eye at baseline was 2.7 (standard deviation, 2.5; min 1, med 2, max 17), and 29 (39%) had 1 ODS, 16 (22%) had 2 ODS, and 29 (39%) had 3+ ODS. The distribution of ODS subtypes in the 74 eyes was as follows: 49 (66%) had H-type cores, 41 (55%) had L-type cores, 16 (22%) had C-type debris, and 11 (15%) had S-type drusen.
Macula-wide Analysis
Cross-sectional analysis of AMD disease features at baseline with respect to baseline presence of ODS and ODS subtypes is shown in Table 3. The ODS were associated with multiple SD OCT measures of greater drusen load: higher RPEDC volume on SD OCT (mean, 0.74 ODS vs. 0.67 no ODS, P < 0.001), higher OCT drusen volume on SD OCT (mean, 0.10 ODS vs. 0.08 no ODS, P < 0.001), and higher drusen area on color photograph (mean, 6.47 ODS vs. 6.01 no ODS, P < 0.001). The ODS were associated with RPE atrophy on SD OCT (43.24% ODS vs. 16.38% no ODS, P < 0.001), especially within 660 μm of the foveal center (20.27% ODS vs. 7.33% no ODS, P = 0.004), but not with GA and preatrophy measures at baseline. None of the eyes had central GA or CNV at baseline (these were exclusion criteria). The ODS were not associated with typically neovascular SD OCT features at baseline, except intraretinal fluid (IRF) (24.32% ODS vs. 13.91% no ODS, P = 0.047).
Table 3. Cross-sectional Study: Baseline Variables in 5-mm Maculae of Eyes with versus without Optical Coherence Tomography–Reflective Drusen Substructures at Baseline.
| Overall Comparison | Subtype Comparison: Eyes with ODS Subtype versus Eyes with No ODS | |||||||||||
|---|---|---|---|---|---|---|---|---|---|---|---|---|
|
|
|
|||||||||||
| BL Eyes with ODS | BL Eyes with No ODS | L-type | H-type | C-type | S-type | |||||||
|
|
|
|
|
|
|
|
||||||
| No. of Eyes | 74 | 233 | 41 | 49 | 16 | 11 | ||||||
|
|
|
|
|
|
|
|
|
|||||
| Mean (SD) | Mean (SD) | P Value* | Mean (SD) | P Value | Mean (SD) | P Value | Mean (SD) | P Value | Mean (SD) | P Value | ||
| Drusen Load | RPE drusen complex (mm3) | 0.74 (0.18) | 0.67 (0.22) | <0.0001 | 0.77 (0.18) | <0.0001 | 0.74 (0.17) | 0.0004 | 0.68 (0.11) | 0.1504 | 0.78 (0.22) | 0.0119 |
| OCT drusen (mm3) | 0.10 (0.12) | 0.08 (0.17) | <0.0001 | 0.12 (0.12) | <0.0001 | 0.10 (0.11) | <0.0001 | 0.06 (0.05) | 0.0836 | 0.13 (0.15) | 0.0071 | |
| Drusen area (DA)† | 6.47 (0.88) | 6.01 (1.17) | 0.0009 | 6.56 (0.87) | 0.0012 | 6.33 (0.99) | 0.0572 | 6.75 (0.58) | 0.0059 | 6.91 (0.30) | 0.0041 | |
| GA and Preatrophy | RAT (×10−3) (mm3) | 1.15 (2.26) | 0.69 (2.00) | 0.0943 | 0.54 (0.93) | 0.9673 | 1.28 (2.45) | 0.1304 | 1.53 (2.23) | 0.0501 | 1.35 (3.42) | 0.7839 |
| GA area (DA) † | 0.17 (0.64) | 0.10 (0.55) | 0.0827 | 0.00 (0.01) | 0.2552 | 0.18 (0.69) | 0.2187 | 0.26 (0.68) | 0.0626 | 0.18 (0.51) | 0.2079 | |
| Prop‡(%) | Prop (%) | Prop (%) | Prop (%) | Prop (%) | Prop (%) | |||||||
| Any GA† | 9/70 (12.86) | 17/229 (7.42) | 0.2228 | 1/39 (2.56) | 0.4861 | 6/47 (12.77) | 0.2461 | 2/14 (14.29) | 0.3004 | 2/11 (18.18) | 0.2127 | |
| PRL thinning | 8/73 (10.96) | 12/230 (5.22) | 0.1039 | 4/41 (9.76) | 0.2764 | 6/48 (12.50) | 0.0979 | 3/16 (18.75) | 0.0635 | 2/11 (18.18) | 0.1276 | |
| Other RPE changes | 3/73 (4.11) | 5/231 (2.16) | 0.4036 | 1/41 (2.44) | 1.00 | 3/48 (6.25) | 0.1423 | 1/16 (6.25) | 0.3338 | 0/11 (0.00) | 1.00 | |
| RPE atrophy | 32/74 (43.24) | 38/232 (16.38) | <0.0001 | 15/41 (36.59) | 0.0048 | 21/49 (42.86) | 0.0001 | 11/16 (68.75) | <0.0001 | 7/11 (63.64) | 0.0009 | |
| RPE atrophy (foveal) | 15/74 (20.27) | 17/232 (7.33) | 0.0036 | 6/41 (14.63) | 0.1298 | 8/49 (16.33) | 0.0545 | 5/16 (31.25) | 0.0079 | 3/11 (27.27) | 0.0515 | |
| Neovascular | IRF | 18/74 (24.32) | 32/230 (13.91) | 0.0466 | 10/41 (24.39) | 0.1014 | 13/49 (26.53) | 0.0516 | 7/16 (43.75) | 0.0057 | 3/11 (27.27) | 0.2033 |
| SRF | 7/74 (9.46) | 18/230 (7.83) | 0.6321 | 5/41 (12.20) | 0.3622 | 5/49 (10.20) | 0.5704 | 1/16 (6.25) | 1.00 | 1/11 (9.09) | 0.6029 | |
| Other | Subretinal lesion | 2/74 (2.70) | 23/231 (9.96) | 0.0519 | 1/41 (2.44) | 0.1437 | 1/49 (2.04) | 0.0911 | 0/16 (0.00) | 0.3753 | 0/11 (0.00) | 0.6063 |
| Hyperreflective foci | 59/74 (79.73) | 121/233 (51.93) | <0.0001 | 33/41 (80.49) | 0.0006 | 41/49 (83.67) | <0.0001 | 12/16 (75.00) | 0.1179 | 9/11 (81.82) | 0.0657 | |
| Mean (SD) | Mean (SD) | P Value* | Mean (SD) | P Value | Mean (SD) | P Value | Mean (SD) | P Value | Mean (SD) | P Value | ||
| Visual acuity | 79.74 (8.79) | 80.50 (9.11) | 0.3902 | 82.02 (7.91) | 0.3576 | 78.88 (8.76) | 0.1747 | 76.25 (8.69) | 0.0287 | 78.18 (8.75) | 0.3535 | |
| Neurosensory retina | 5.19 (0.42) | 5.23 (0.41) | 0.5294 | 5.19 (0.37) | 0.7243 | 5.20 (0.46) | 0.6252 | 4.96 (0.57) | 0.1325 | 5.27 (0.42) | 0.8899 | |
BL = baseline; DA = disc area; GA = geographic atrophy; IRF = intraretinal fluid; OCT = optical coherence tomography; ODS = optical coherence tomography–reflective drusen substructures; RPE = retinal pigment epithelium; SD = standard deviation; SRF = subretinal fluid.
Alpha value = 0.05.
Derived from color fundus photo grading. All other outcomes were derived from SD OCT imaging.
Prop = number of eyes with outcome over number of eyes gradable for that outcome.
Other subretinal lesions (reticular pseudodrusen, subretinal hyperreflective material, vitelliform lesion, scar, and hemorrhage), hyperreflective foci, visual acuity, and neurosensory retina were additional outcomes studied. The ODS were not associated with lower visual acuity at baseline. However, among subtypes, C-type lesions were associated with lower visual acuity (P = 0.03) at baseline. Last, 59 of 74 ODS eyes (79.7%) had hyperreflective foci at baseline versus 121 of 233 non-ODS eyes (51.9%) with this feature (P < 0.001).
Table 4 summarizes the longitudinal analyses of outcomes at year 2, with respect to baseline presence of ODS and ODS subtypes. The ODS at baseline were not associated with drusen load outcomes at year 2. With regard to GA and preatrophy outcomes, ODS at baseline were associated with increase in retinal pigment epithelium drusen complex abnormal thinning (RAT) volume on SD OCT (mean, 1.91 ODS vs. 0.55 no ODS, P = 0.01) and increase in area of GA on color photographs (mean, 0.41 ODS vs. 0.08 no ODS, P = 0.006) at year 2. The ODS at baseline also were associated with new-onset photoreceptor layer (PRL) thinning (28.07% ODS vs. 9.79% no ODS, P = 0.002), RPE disruption (20.97% ODS vs. 9.80% no ODS, P = 0.03), and RPE atrophy (28.21% ODS vs. 8.99% no ODS, P = 0.003), especially within 660 μm of the foveal center (P = 0.03), all on SD OCT at year 2. Although ODS presence at baseline was associated with multiple SD OCT measures of GA and atrophy, ODS presence at baseline was not associated with new onset of central GA or any GA on color photograph (primary study outcomes) at year 2. However, among subtypes, C-type at baseline was associated with new-onset GA at year 2 (P = 0.009). The ODS at baseline were not associated with new onset of CNV (primary study outcome) or of typically neovascular SD OCT outcomes, namely, IRF and subretinal fluid (SRF), at year 2. The ODS at baseline were not associated with new onset of other subretinal lesions, hyperreflective foci, or change in visual acuity at year 2, and were associated with a smaller decrease in neurosensory retina volume (P = 0.003).
Table 4. Longitudinal Study: Change or New Onset of Outcomes at Year 2 in 5-mm Diameter Maculae of Eyes with versus without Optical Coherence Tomography–Reflective Drusen Substructures at Baseline.
| Overall Comparison | Subtype Comparison: Eyes with ODS Subtype versus Eyes with No ODS | |||||||||||
|---|---|---|---|---|---|---|---|---|---|---|---|---|
|
|
|
|||||||||||
| BL Eyes with ODS | BL Eyes with No ODS | L-type | H-type | C-type | S-type | |||||||
|
|
|
|
|
|
|
|
||||||
| No. of Eyes | 63 | 199 | 35 | 41 | 14 | 9 | ||||||
|
|
|
|
|
|
|
|
|
|||||
| Mean (SD) | Mean (SD) | P Value* | Mean (SD) | P Value | Mean (SD) | P Value | Mean (SD) | P Value | Mean (SD) | P Value | ||
| Drusen Load | ΔRPE drusen complex (mm3) | 0.01 (0.20) | 0.03 (0.21) | 0.0688 | 0.04 (0.22) | 0.9873 | 0.00 (0.20) | 0.0852 | −0.01 (0.095) | 0.0689 | 0.06 (0.21) | 0.9572 |
| ΔOCT drusen (mm3) | 0.02 (0.17) | 0.03 (0.19) | 0.2479 | 0.05 (0.19) | 0.4368 | 0.01 (0.15) | 0.1366 | 0.02 (0.061) | 0.3194 | 0.06 (0.18) | 0.3753 | |
| ΔDrusen area (DA)† | 0.07 (0.74) | −0.04 (0.85) | 0.8630 | 0.03 (0.63) | 0.9056 | 0.15 (0.89) | 0.5613 | −0.08 (0.49) | 0.6108 | −0.13 (0.35) | 0.5257 | |
| GA and Preatrophy | ΔRAT (×10−3) (mm3) | 1.91 (4.14) | 0.55 (2.11) | 0.0111 | 0.52 (1.67) | 0.4891 | 1.98 (4.05) | 0.0098 | 3.94 (5.23) | 0.0010 | 1.28 (3.22) | 0.3121 |
| ΔGA area (DA)† | 0.41 (1.12) | 0.08 (0.36) | 0.0056 | 0.17 (0.77) | 0.8078 | 0.34 (0.90) | 0.0295 | 0.94 (1.79) | <0.0001 | 0.16 (0.29) | 0.0194 | |
| Prop‡(%) | Prop (%) | Prop (%) | Prop (%) | Prop (%) | Prop (%) | |||||||
| New GA† | 5/42 (11.90) | 8/163 (4.91) | 0.1465 | 3/27 (11.11) | 0.1929 | 3/27 (11.11) | 0.1929 | 3/8 (37.50) | 0.0094 | 1/6 (16.67) | 0.2836 | |
| New central GA† | 2/49 (4.08) | 9/180 (5.00) | 1.00 | 0/27 (0.00) | 0.6090 | 1/31 (3.23) | 1.00 | 2/11 (18.18) | 0.1248 | 0/6 (0.00) | 1.00 | |
| New PRL thinning | 16/57 (28.07) | 19/194 (9.79) | 0.0017 | 10/33 (30.30) | 0.0031 | 12/36 (33.33) | 0.0006 | 4/12 (33.33) | 0.0321 | 3/8 (37.50) | 0.0440 | |
| New RPE disruption | 13/62 (20.97) | 20/204 (9.80) | 0.0271 | 7/36 (19.44) | 0.1464 | 8/39 (20.51) | 0.0949 | 5/14 (35.71) | 0.0130 | 3/10 (30.00) | 0.0790 | |
| New RPE atrophy | 11/39 (28.21) | 16/178 (8.99) | 0.0025 | 7/24 (29.17) | 0.0094 | 8/26 (30.77) | 0.0044 | 3/5 (60.00) | 0.0084 | 0/4 (0.00) | 1.00 | |
| New RPE atrophy (foveal) | 7/196 (3.57) | 6/52 (11.54) | 0.0332 | 2/31 (6.45) | 0.3543 | 6/35 (17.14) | 0.0062 | 3/10 (30.00) | 0.0083 | 1/7 (14.29) | 0.2486 | |
| Neovascular | New IRF | 15/50 (30.00) | 41/177 (23.16) | 0.3544 | 9/28 (32.14) | 0.3444 | 14/32 (43.75) | 0.0272 | 2/8 (25.00) | 1.00 | 3/8 (37.50) | 0.3976 |
| New SRF | 4/62 (6.45) | 15/195 (7.69) | 1.00 | 3/34 (8.82) | 0.7361 | 4/40 (10.00) | 0.5405 | 1/15 (6.67) | 1.00 | 1/9 (11.11) | 0.5279 | |
| New CNV† | 9/61 (14.75) | 25/198 (12.63) | 0.6675 | 7/35 (20.00) | 0.2844 | 7/40 (17.50) | 0.4459 | 1/12 (8.33) | 1.00 | 2/10 (20.00) | 0.6220 | |
| Other | New subretinal lesion | 5/64 (7.81) | 15/192 (7.81) | 1.00 | 4/36 (11.11) | 0.5126 | 4/42 (9.52) | 0.750 | 1/15 (6.67) | 1.00 | 1/10 (10.00) | 0.5705 |
| Hyperreflective foci | 12/66 (18.18) | 58/212 (27.36) | 0.1468 | 6/37 (16.22) | 0.2201 | 6/43 (13.95) | 0.0818 | 3/15 (20.00) | 0.7645 | 2/10 (20.00) | 1.00 | |
| Mean (SD) | Mean (SD) | Mean (SD) | Mean (SD) | Mean (SD) | Mean (SD) | |||||||
| Visual acuity | −4.18 (8.08) | −3.83 (12.61) | 0.1044 | −5.39 (8.92) | 0.0392 | −3.67 (8.75) | 0.4752 | −6.71 (12.67) | 0.2578 | −2.60 (5.38) | 0.8538 | |
| Neurosensory retina | −0.08 (0.47) | −0.08 (0.18) | 0.0033 | 0.00 (0.59) | 0.2125 | −0.03 (0.57) | 0.0604 | −0.15 (0.17) | 0.0744 | −0.12 (0.27) | 0.4203 | |
BL = baseline; CNV = choroidal neovascularization; DA = disc area; GA = geographic atrophy; IRF = intraretinal fluid; OCT = optical coherence tomography; ODS = optical coherence tomography–reflective drusen substructures; RAT = retinal pigment epithelium drusen complex abnormal thinning; RPE = retinal pigment epithelium; SD = standard deviation; SRF = subretinal fluid.
Alpha value = 0.05.
Derived from color fundus photo grading. All other outcomes were derived from SD OCT imaging.
Prop = number of eyes with new onset of outcome over number of eyes that did not have outcome at baseline.
Table 5 (available at www.aaojournal.org) summarizes the longitudinal analysis of outcomes at year 3 with respect to baseline presence of ODS and ODS subtypes. The ODS at baseline were not associated with drusen load outcomes at year 3. However, among subtypes, C-type at baseline were associated with a decrease in RPEDC volume (P = 0.009) and decrease in OCT drusen volume (P = 0.04) at year 3. With regard to GA and preatrophy outcomes, ODS at baseline were associated with increase in RAT on SD OCT (mean, 2.52 ODS vs. 0.87 no ODS, P = 0.002), increase in area of GA on color photographs (mean, 0.51 ODS vs. 0.15 no ODS, P = 0.008), new-onset GA (25.71% ODS vs. 7.59% no ODS, P = 0.005) on color photographs, and new-onset PRL thinning on SD OCT at year 3 (27.45% ODS vs. 11.70% no ODS, P = 0.008). The ODS at baseline were not associated with new onset of central GA at year 3. However, among subtypes, C-type at baseline were associated with new-onset central GA at year 3 (44.44% vs. 6.29%, P = 0.003). The ODS at baseline were not associated with new onset of CNV or of typically neovascular SD OCT outcomes at year 3, except IRF (38.64% ODS vs. 19.53% no ODS, P = 0.02). The ODS at baseline were also not associated with a change in visual acuity at year 3.
In examining the subtypes, conical debris were associated with lower average RPEDC and OCT drusen volumes at baseline and greater decrease in RPEDC at year 2, suggesting collapse and subsequent atrophy. Although all 4 subtypes were associated with RPE atrophy at baseline, conical debris were additionally trending toward larger RAT volume and GA size. At year 2, conical debris was associated with the highest number of atrophic measures, followed by high-reflective cores, split drusen, and low-reflective cores. The results were similar in the year 3 data.
Analysis of Covariance
Retinal pigment epithelium drusen complex volume, OCT drusen volume, and drusen area were associated with ODS as baseline. Thus, we conducted an analysis of covariance for these outcomes and found that none were significantly associated with year 2 and year 3 outcomes, except drusen area with new GA at year 3. The ODS remained significantly associated with outcomes in years 2 and 3 after adjustment for covariates. We did not adjust for age, statin, or smoking in the longitudinal portion of the study because we found no significant difference between the ODS group and no ODS group with regard to these variables at baseline.
Regional Analysis
Within the 74 eyes designated to have ODS at baseline, we chose 114 ODS containing ROIs and 114 non-ODS control ROIs. Ninety-eight of the 114 ODS ROIs were located entirely inside the 5-mm macular ring and could be registered to color photograph for analysis. Normal RPE was observed in 65 (66.3%) ODS ROIs on color photograph, normal drusen were observed in 55 (56.1%), hypopigmentation was observed in 18 (18.4%), and hyperpigmentation was observed in 13 (13.3%). Among those with hypopigmentation, 8 (8.16%) were characterized as having calcific drusen, 8 (8.16%) were characterized as RPE atrophy, and 2 (2.04%) were characterized as crystalline drusen. Four ODS ROIs had both hyperpigmentation and hypopigmentation. Because of a question as to whether C-type might represent calcific or crystalline drusen on color photographs, we performed a post hoc (Appendix 1, available at www.aaojournal.org) analysis of the C-type ROIs on color photograph, which were 15 of the 98 ODS ROIs studied. Normal RPE was observed in 10 of 15 (66.7%), normal drusen were observed in 10 of 15 (66.7%), hyperpigmentation was observed in 2 of 15 (13.3%), and hypopigmentation was observed in 4 of 15 (26.7%).
In an examination of autofluorescence images (7 eyes), the locations corresponding to 31 randomly selected ODS were found to lack a particularly distinct appearance compared with the background surrounding pattern of fluorescence. The most common finding in ODS locations was an absence of hyper-autofluorescence, fluorescence patterns, and hypofluorescence. The prevailing mottled pattern of background autofluorescence contributed to difficulties in identifying the patterns at ODS locations. On infrared images (3 eyes), we were unable to determine whether there exists a correlation because ODS locations did not appear to have distinct features compared with surrounding areas.
Cross-sectional analysis of baseline regions with respect to the presence or absence of ODS and ODS subtypes is shown in Table 6. The ODS were not associated with regional OCT-derived drusen load outcomes. With regard to preatrophy outcomes (primary study outcomes) at baseline, ODS were associated with regional PRL thinning without drusen (12.28% ODS vs. 4.39% no ODS, P = 0.02) and increased choroidal signal (23.68% ODS vs. 13.16% no ODS, P = 0.03), with a trend toward PRL thinning above drusen and ellipsoid zone loss. The ODS were not associated with typically neovascular regional outcomes IRF, SRF, and other subretinal lesions (reticular pseudodrusen, subretinal hyperreflective material, vitelliform lesion, scar, hemorrhage) at baseline. The ODS were associated with baseline presence of hyperreflective foci above drusen (45.61% ODS vs. 16.67% no ODS, P < 0.001).
Table 6. Cross-sectional Study: Baseline Variables in 0.5-mm Diameter Region of Interest with Optical Coherence Tomography–Reflective Drusen Substructures Compared with Matched Region of Interest without Optical Coherence Tomography–Reflective Drusen Substructures in Same Eye at Baseline.
| Overall Comparison | Subtype Comparison: Regions with ODS Subtype versus Regions with No ODS | |||||||||||
|---|---|---|---|---|---|---|---|---|---|---|---|---|
|
|
|
|||||||||||
| Regions with ODS | Regions with No ODS | L-type | H-type | C-type | S-type | |||||||
|
|
|
|
|
|
|
|
||||||
| No. of ROIs | 114 | 114 | 35 | 52 | 20 | 7 | ||||||
|
|
|
|
|
|
|
|
|
|||||
| Mean (SD) | Mean (SD) | P Value* | Mean (SD) | P Value | Mean (SD) | P Value | Mean (SD) | P Value | Mean (SD) | P Value | ||
| Drusen Load | RPE drusen complex (mm3)† | 0.0088 (0.0047) | 0.0086 (0.0047) | 0.563 | 0.0087 (0.0052) | 0.022 | 0.0087 (0.0047) | 0.041 | 0.0086 (0.0028) | 0.005 | 0.0100 (0.0054) | 0.397 |
| OCT drusen (mm3) | 0.0018 (0.0038) | 0.0017 (0.0038) | 0.930 | 0.0019 (0.0043) | 0.105 | 0.0018 (0.0040) | 0.503 | 0.0013 (0.0014) | 0.010 | 0.0028 (0.0045) | 0.419 | |
| Preatrophy | RAT (× 10−3) (mm3) | 0.0100 (0.0200) | 0.0100 (0.0300) | 0.576 | 0.0051 (0.0158) | 0.085 | 0.0088 (0.0226) | 0.134 | 0.0059 (0.0227) | 0.298 | 0.00 (0.00) | 0.280 |
| Prop (%) | Prop (%) | Prop (%) | Prop (%) | Prop (%) | Prop (%) | |||||||
| PRL thinning above drusen | 23/114 (20.17) | 36/114 (31.58) | 0.053 | 4/35 (11.43) | 0.052 | 11/52 (21.15) | 0.180 | 7/20 (35.00) | 0.480 | 1/7 (14.29) | 0.317 | |
| PRL thinning without drusen | 14/114 (12.28) | 5/114 (4.39) | 0.020 | 3/35 (8.57) | – | 6/52 (11.54) | 0.480 | 5/20 (25.00) | 0.046 | 0/7 (0.00) | – | |
| Ellipsoid zone loss | 89/114 (78.07) | 78/114 (68.42) | 0.056 | 27/35 (77.14) | 0.058 | 39/52 (75.00) | 0.346 | 16/20 (80.00) | 1.00 | 7/7 (100.00) | – | |
| RPE atrophy | 16/114 (14.04) | 16/114 (14.04) | 0.275 | 5/35 (14.29) | 0.564 | 5/52 (9.62) | 0.052 | 5/20 (25.00) | 1.00 | 1/7 (14.29) | – | |
| Choroidal increased signal | 27/114 (23.68) | 15/114 (13.16) | 0.029 | 8/35 (22.86) | 0.103 | 11/52 (21.15) | 0.439 | 6/20 (30.00) | 0.257 | 2/7 (28.57) | 0.380 | |
| Neovascular | IRF | 0/114 (0.00) | 0/114 (0.00) | – | 0/35 (0.00) | – | 0/52 (0.00) | – | 0/20 (0.00) | – | 0/7 (0.00) | – |
| SRF | 5/114 (4.39) | 4/114 (3.51) | 0.317 | 2/35 (5.71) | – | 1/52 (1.92) | – | 2/20 (10.00) | – | 0/7 (0.00) | – | |
| Other | Subretinal lesion | 0/114 (0.00) | 0/114 (0.00) | – | 0/35 (0.00) | – | 0/52 (0.00) | – | 0/20 (0.00) | – | 0/7 (0.00) | – |
| Hyperreflective foci | 52/114 (45.61) | 19/114 (16.67) | <0.0001 | 15/35 (42.86) | 0.1336 | 27/52 (51.92) | <0.0001 | 7/20 (35.00) | 0.2568 | 3/7 (42.86) | 0.3173 | |
IRF = intraretinal fluid; OCT = optical coherence tomography; ODS = optical coherence tomography–reflective drusen substructures; PRL = photoreceptor layer; RAT = retinal pigment epithelium drusen complex abnormal thinning; ROI = region of interest; RPE = retinal pigment epithelium; SD = standard deviation; SRF = subretinal fluid.
Paired t test using generalized estimating equations (GEEs) and simple McNemar's test with alpha value = 0.05; “–” means test could not be carried out due to asymmetric table.
The RPEDC volume was 1 criteria used to match each ODS ROI with corresponding control ROI.
Substructures demonstrated a dynamic nature, disappearing, persisting as the same subtype, or spontaneously converting into a different subtype. Of 114 ODS within ROIs at baseline, 31 (27.2%) persisted at year 2 and 17 (14.9%) persisted at year 3. Figure 1 summarizes their evolution over time. In contrast, of the 114 control ROIs, 5 had ODS at year 2 and 9 had ODS at year 3, with an assortment of subtypes.
Figure 1.
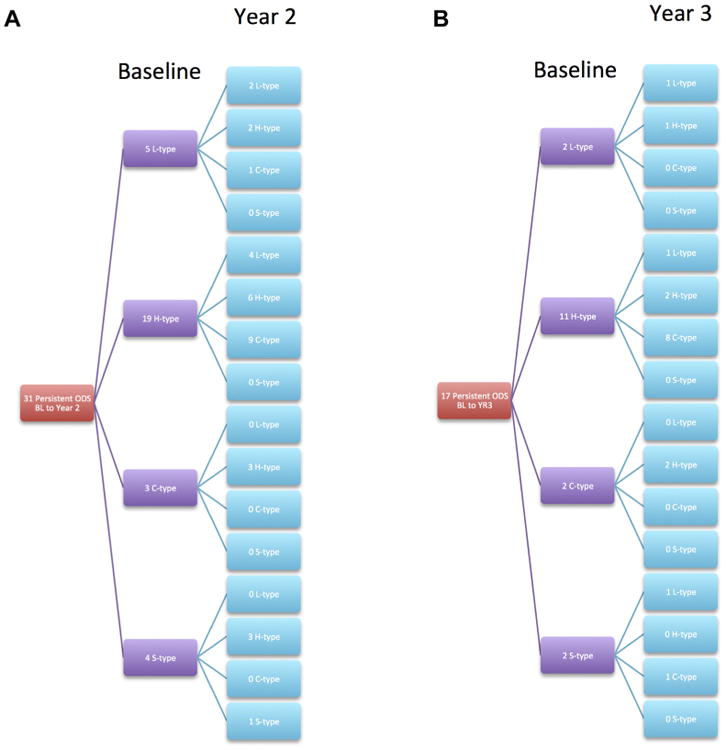
A, Evolution with respect to subtype of the 31 (of 114, 27%) optical coherence tomography—reflective drusen substructures (ODS) that persisted from baseline to year 2. B, Evolution with respect to subtype of the 17 (of 114, 15%) ODS that persisted from baseline to year 3.
Longitudinal analysis of regional AMD disease progression at year 2 with respect to baseline presence or absence of ODS and ODS subtypes is shown in Table 7. With respect to preatrophy outcomes at year 2, new onset of regional PRL thinning without drusen (16.87% ODS vs. 7.23% no ODS, P = 0.02) and ellipsoid zone loss (66.67% ODS vs. 33.33% no ODS, P = 0.046) were both greater in ROIs with ODS versus without ODS at baseline. The ODS were not associated with regional OCT-derived drusen load outcomes or with new onset of typically neovascular regional outcomes IRF, SRF, and other subretinal lesions at year 2.
Table 7. Longitudinal Study: Change or New Onset of Outcomes at Year 2 in 0.5-mm Diameter Region of Interest with Optical Coherence Tomography–Reflective Drusen Substructures Compared with Matched Region of Interest without Optical Coherence Tomography–Reflective Drusen Substructures in Same Eye at Baseline.
| Overall Comparison | Subtype Comparison: Regions with ODS Subtype versus Regions with No ODS | |||||||||||
|---|---|---|---|---|---|---|---|---|---|---|---|---|
|
|
|
|||||||||||
| Regions with ODS | Regions with No ODS | L-type | H-type | C-type | S-type | |||||||
|
|
|
|
|
|
|
|
||||||
| No.of ROIs | 95 | 95 | 29 | 44 | 15 | 7 | ||||||
|
|
|
|
|
|
|
|
|
|||||
| Mean (SD) | Mean (SD) | P Value* | Mean (SD) | P Value | Mean (SD) | P Value | Mean (SD) | P Value | Mean (SD) | P Value | ||
| Drusen Load | ΔRPE drusen complex (mm3) | 0.0011 (0.0061) | 0.0004 (0.0050) | 0.193 | 0.0011 (0.0039) | 0.628 | 0.0006 (0.0058) | 0.317 | 0.0035 (0.0108) | 0.167 | −0.0003 (0.0025) | 0.523 |
| ΔOCT drusen (mm3) | 0.0011 (0.0055) | 0.0005 (0.0046) | 0.219 | 0.0011 (0.0034) | 0.979 | 0.0007 (0.0050) | 0.272 | 0.0033 (0.0103) | 0.145 | −0.0005 (0.0019) | 0.340 | |
| Preatrophy | ΔRAT (×10−3) (mm3) | 0.0045 (0.0329) | 0.0168 (0.0761) | 0.057 | 0.0069 (0.0282) | 0.066 | 0.0029 (0.0329) | 0.198 | 0.0080 (0.0505) | 0.121 | 0.00 (0.00) | 0.280 |
| Prop†(%) | Prop (%) | Prop (%) | Prop (%) | Prop (%) | Prop (%) | |||||||
| New PRL thinning above drusen | 16/54 (29.63) | 11/54 (20.37) | 0.447 | 2/17 (11.76) | 0.655 | 11/26 (42.31) | 0.096 | 2/8 (25.00) | 1.00 | 1/3 (33.33) | – | |
| New PRL thinning without drusen | 14/83 (16.87) | 6/83 (7.23) | 0.021 | 3/27 (11.11) | 0.564 | 7/37 (18.92) | 0.025 | 4/12 (33.33) | 0.083 | 0/7 (0.00) | – | |
| New ellipsoid zone loss | 8/12 (66.67) | 4/12 (33.33) | 0.046 | 3/5 (60.00) | 0.822 | 5/6 (83.33) | 0.157 | 0/1 (0.00) | – | 0/0 (0.00) | – | |
| New RPE atrophy | 14/71 (19.72) | 8/71 (11.27) | 0.083 | 3/24 (12.50) | 0.157 | 8/32 (25.00) | 0.103 | 3/9 (33.33) | 0.987 | 0/6 (0.00) | – | |
| New choroidal increased signal | 13/67 (19.40) | 11/67 (16.42) | 0.564 | 2/21 (9.52) | 0.564 | 7/32 (21.88) | 0.655 | 3/9 (33.33) | 0.564 | 1/5 (20.00) | 0.317 | |
| Neovascular | New IRF | 3/95 (3.16) | 6/95 (6.32) | 0.257 | 1/29 (3.45) | 0.564 | 0/44 (0.00) | – | 1/15 (6.67) | 0.317 | 1/7 (14.29) | – |
| New SRF | 2/92 (2.17) | 1/92 (1.09) | 0.564 | 1/28 (3.57) | – | 1/43 (2.33) | 1.00 | 0/14 (0.00) | – | 0/7 (0.00) | – | |
| Other | New subretinal lesion | 0/95 (0.00) | 3/95 (3.16) | – | 0/29 (0.00) | – | 0/44 (0.00) | – | 0/15 (0.00) | – | 0/7 (0.00) | – |
| New hyperreflective foci | 7/44 (15.91) | 2/44 (4.55) | 0.0956 | 0/14 (0.00) | – | 5/18 (27.78) | 0.1025 | 1/9 (11.11) | 1.00 | 1/3 (33.33) | – | |
IRF = intraretinal fluid; OCT = optical coherence tomography; ODS = optical coherence tomography–reflective drusen substructures; PRL = photoreceptor layer; RAT = retinal pigment epithelium drusen complex abnormal thinning; ROI = region of interest; RPE = retinal pigment epithelium; SD = standard deviation; SRF = subretinal fluid.
Paired t test using GEEs and simple McNemar's test with alpha value = 0.05; “–” means test could not be carried out because of asymmetric table.
Prop = number of eyes with new onset of outcome over number of eyes that did not have outcome at baseline.
Longitudinal analysis of regional AMD disease progression at year 3 with respect to baseline presence or absence of ODS and ODS subtypes is shown in Table 8 (available at www.aaojournal.org). With respect to preatrophy outcomes at year 3, new onset of regional PRL thinning without drusen (27.03% ODS vs. 13.51% no ODS, P = 0.008) and RPE atrophy (20.97% ODS vs. 9.68% no ODS, P = 0.04) were both greater in ROIs with ODS versus without ODS at baseline. The ODS were not associated with regional OCT-derived drusen load outcomes or with new onset of typically neovascular regional outcomes IRF, SRF, and other subretinal lesions at year 3.
Results for the unpaired regional analysis in which control ROIs were selected in non-ODS eyes are presented in Tables 9 to 11 (available at www.aaojournal.org). In our additional study of precursor lesions in the location 2 years before new-onset ODS, we compared 71 ODS precursor regions with 71 control precursor regions. New-onset ODS was preceded only by RPE elevation (86.59% ODS vs. 63.41% no ODS, P < 0.001) and RPE atrophy (58.54% ODS vs. 36.59% no ODS, P = 0.001).
Discussion
In this study, we introduce ODS as an OCT-based clinical entity in intermediate AMD and report its association with disease progression. Although ODS are visible on SD OCT, the retinal positions that they occupy cannot be distinguished from surrounding areas on color fundus photography and are typically located amidst drusen and normal RPE. We demonstrate that ODS are lesions predictive of accelerated progression to advanced stages of atrophic AMD identifiable on SD OCT over 3 years. The presence of ODS at baseline was not found to be associated with change in visual acuity or development of CNV. The association with the development of atrophic changes was shared between multiple forms of ODS but was largest for the conical debris subtype of ODS.
In the analysis of outcomes related to drusen load, we found that ODS tended to present in maculae with greater total drusen volume and drusen area, relative to maculae that lack ODS. However, the ODS themselves were not located in individual drusen of larger volume. In the macula-wide analysis of outcomes associated with atrophic features, eyes with ODS at baseline were significantly associated with new onset of PRL thinning, greater increase in RAT, and faster growth of existing GA at years 2 and 3, and new onset of GA at year 3. In the regional analysis of atrophy, ODS were associated with local preatrophic features at baseline (PRL thinning, increased choroidal signal). Longitudinally, ODS were also associated locally with new onset of PRL thinning and ellipsoid zone loss at year 2 and new onset of PRL thinning and RPE atrophy at year 3. Taken together, the occurrence of ODS on a macula-wide scale appears to emerge in the later “life cycle” stages of non-neovascular AMD in which drusen accumulation is followed by drusen regression and subsequent atrophy (Fig 2).27 On a regional scale, the ODS themselves may be located in areas of regressing drusen and nearby atrophy (Fig 3). As such, ODS may represent a phenotype manifest in drusen just before, or are in the initial phase of, overt regression.
Figure 2.
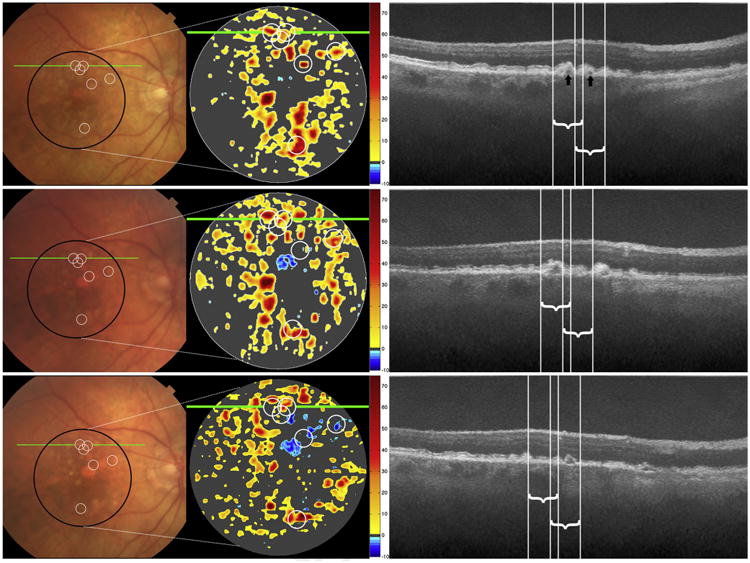
Color photographs, spectral-domain optical coherence tomography (SD OCT)—derived retinal pigment epithelium-drusen complex (RPEDC) thickness maps for the area of the black circle on color photograph, and SD OCT B-scans at the site of the green line, at baseline (top row), year 2 (middle row), and year 3 (bottom row) for a single study eye. On thickness maps, the dark gray areas designate RPEDC that is in the normal range of thickness in contrast to red and orange tones that designate areas of RPEDC abnormal thickening volume (optical coherence tomography [OCT] drusen) and blue tones that designate RPEDC abnormal thinning volume (RAT).14 Six optical coherence tomography—reflective drusen substructures (ODS)-centered regions of interest (ROIs) are shown on the color photograph and SD OCT—derived thickness map at baseline (white circles, top row) and project to the white lines on the B-scan. The white circles in the middle and bottom rows track the locations of these ROIs (not new ODS) at years 2 and 3. The ODS locations at baseline are not distinguishable on color photograph and are typically located amidst drusen and normal RPE, whereas on the thickness map they are in regions of OCT drusen. The RPEDC thicknesses of these ODS-centered ROIs follow the classic trajectory of persistence (possibly early increase) in drusen volume followed by collapse into atrophy. On the B-scans, the baseline low reflective core (ODS subtype, black arrow) on the left persists at year 2 and collapses at year 3. The low-reflective core on the right (black arrow) disappears at year 2 and transforms into another subtype of ODS, conical debris, at year 3. Although we only marked and followed ODS from baseline, the new appearance on the B-scan at year 2 of a split drusen ODS (right of the white lines) demonstrates the dynamic nature of ODS.
Figure 3.
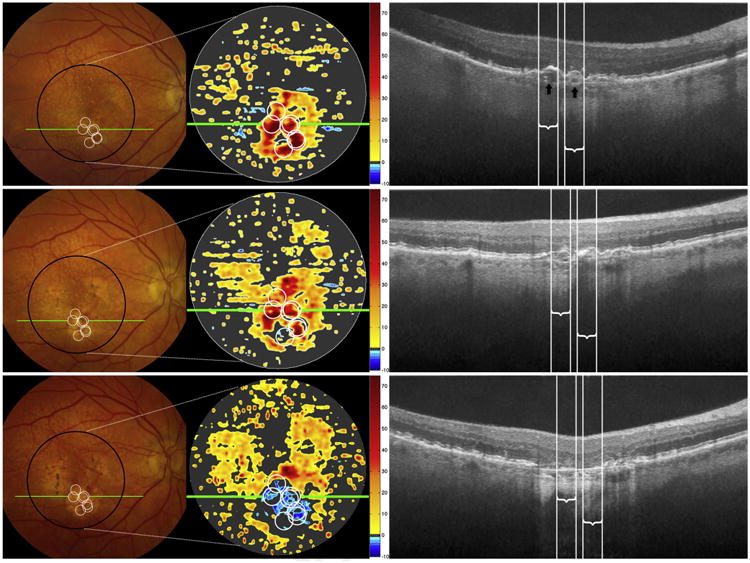
Color photographs, spectral-domain optical coherence tomography (SD OCT)—derived retinal pigment epithelium-drusen complex (RPEDC) thickness maps, and SD OCT B-scans for baseline (top row), year 2 (middle row), and year 3 (bottom row) for a single study eye. The markings follow the same designations as for Figure 1. Seven optical coherence tomography—reflective drusen substructures (ODS)-centered regions of interest (ROIs) are shown on the color photograph and SD OCT—derived thickness map at baseline (white circles, top row) and project to the white lines on the B-scan. The white circles in the middle and bottom rows track the locations of these ROIs (not new ODS) at years 2 and 3. The ODS locations at baseline are amidst drusen and some pigment clumping in this eye, without a unique characteristic on color photograph. Two low-reflective cores (ODS subtype, black arrows) are visible on the B-scan at baseline. Note that baseline positions of these ODS on the thickness maps and B-scans rapidly progress to drusen collapse at year 2 and geographic atrophy (GA) at year 3.
Optical coherence tomography—reflective drusen substructures are relatively rare (24% of intermediate AMD eyes), do not appear to constitute permanent or long-term features, and are not preceded by any unique lesions. Longitudinal observation of ODS found that a majority of ODS that were present at baseline were no longer apparent at years 2 and 3 at the same locus. Even among persisting ODS lesions, the morphologic features of the ODS were observed to change with time and often resulted in reclassification into a different subtype from that scored at baseline. Most split drusen and low-reflective core ODS subtypes transitioned to high-reflective cores, and most high-reflective cores, the most commonly persistent among the 4 subtypes, transformed into conical debris. It is possible that ODS subtype transitions tend to follow the above order and then disappear with drusen regression, and represent progressive change in drusen substructure leading to drusen regression. Consistent with this, an analysis of subtypes revealed that the conical debris is associated with the most rapid progression to atrophy, followed by high-reflective cores, split drusen, and low-reflective cores. The difference in disease impact between the conical debris and the remaining subtypes was significant, whereas the differences within the remaining subtypes were minor. A post hoc analysis did not reveal any focal color photographic correlates for conical debris.
One question that arises as a result of this study relates to the structural basis of ODS. In a prior study, we reported that hyperreflective foci on SD OCT at the inner margin and above RPE predict progression to GA.15 This study demonstrated a significant macula-wide and regional cooccurrence of ODS and hyperreflective foci (79.7% of ODS eyes had hyperreflective foci at baseline vs. 51.9% non-ODS eyes, P < 0.001, and 45.61% ODS ROIs had hyperreflective foci at baseline vs. 16.67% non-ODS ROIs, P < 0.001). However, it is unlikely that ODS and hyperreflective foci are manifestations of the same type of cellular change. We previously speculated that hyperreflective foci represent RPE cells migrating into the inner nuclear and inner plexiform layers of the retina, or alternatively, microglial cells. Optical coherence tomography—reflective drusen substructures, in contrast, do not appear to originate from the RPE layer, are located below the RPE monolayer within drusen themselves, and do not progress to hyperreflective foci at the same location. They are also more transient than hyperreflective foci, which often persist over 2 or more years. Optical coherence tomography—reflective drusen substructures are variable in size and shape and more likely a reflection of heterogeneity in drusen composition and architecture observed in histologic studies. As such, although hyperreflective foci and ODS tend to be found together, they relate to distinct cellular and morphologic features in the AMD eye.
Previous histopathologic studies have described the presence of spherules within drusen, which in size and shape closely resemble the low-reflective and high-reflective core ODS subtypes observed in our study. Mullins and Hageman9 first described “cores” as localized carbohydrate moieties within drusen, composed of glycoproteins with O-glycosidically linked carbohydrate chains.28 Johnson et al8 later demonstrated spherical vesicles within drusen that contain concentric ring or coiled structures on immunohistochemical analysis with amyloid β and amyloid precursor protein localized on the outer shell of the vesicle. Furthermore, they showed that these vesicles were immunopositive for immunoglobulin G, complement components C3b/5/C5b-9, and RPE pigment granules.8,29,30 Anderson et al7 found that the small spherules within drusen are immunoreactive for apolipoprotein E, which is upregulated by Müller glia cells in the degenerating human retina affected by AMD.31 The existence of both immunomodulators and molecules from inside RPE cells in these drusen spherules strongly suggests their formation is a result of immune-mediated RPE cell pathology in AMD and that they are biologically active sites in atrophy pathogenesis.31,32
The striking association between ODS and advancement of AMD leads us to suggest that these ODS could be the spherules described in these previous AMD histopathologic studies. Because SD OCT is an imaging modality based on reflectivity of light, the heterogeneous and nonuniform composition of drusen may give rise to patterns of different reflectivity that constitute ODS. Low reflective cores may consist primarily of lipids, whereas high reflective cores may consist primarily of proteins and hydroxyapatite (calcium derivative).33 Conical debris may be calcific deposits throughout drusen caused by a shattering of high reflective cores. Split drusen may simply be a heterogeneously composed drusen, with disease-associated molecules that have not seeded onto spherules.
Two previous studies reported on drusen substructures on OCT. In a cross-sectional study of 25 eyes, Schlanitz et al34 used polarization-sensitive OCT to demonstrate the existence of cores within drusen and their association with drusen of larger diameter. Suzuki et al35 identified refractile drusen on SD OCT, defined as drusenoid material with small refractile spherules and similar in appearance to the conical debris we have described in this study. In a cross-sectional analysis, it was found that the 14 study eyes with refractile drusen were associated with loss of RPE on autofluorescence.35 Our study is unique in its robust size, analysis of different subtypes of drusen substructures, number of AMD outcomes studied, and analysis of the longitudinal impact of ODS on disease progression.
Study Limitations
Study limitations included a small number of eyes with ODS, especially for within each group of ODS subtypes; however, this should be expected for a relatively rare OCT feature. We were limited to 3 years of follow-up. Registration of ROIs from baseline to follow-up years may have introduced error due to varying orientations of SD OCT volumes for the same subject across different years and location limitations due to fixed B-scan increments. Last, the grading of ODS described in this study on high density (67 μm/B-scan) volume scans was compared with independent repeat grading for 44 randomly selected ODS registered on ultra-high density (16.5 μm/B-scan) volume scans (13 eyes) captured on the same day as the high-density scans. For regional presence of ODS, the 2 scans agreed in 89% of drusen and the agreement was substantial (Cohen's kappa κ = 0.601, P < 0.001).36 With the exception of split drusen with fair agreement (κ=0.39, P = 0.006) at 89%, the ODS subtypes had moderate agreement at 91% for conical debris (κ = 0.55, P < 0.001), 77% for high-reflective cores (κ=0.54, P < 0.001), and 86% for low-reflective cores (κ = 0.55, P < 0.001). Reasons for disagreement may include the inability to capture the same location of ODS on ultra-high density scans.
Optical coherence tomography—reflective drusen substructures are biomarkers of AMD disease progression. The exact pathogenesis of AMD is unknown, so precise characterization of early lesions and their evolution over time can provide insight into pathophysiology and guide research on treatments.2,3,27,37 Follow-up studies will include an analysis of precursors to ODS, which may help us identify earlier lesions that are predictive of disease progression. Previous studies have reported that hyporeflective and hyperreflective drusen, as well as hyperreflective foci, may play an important role in predicting AMD disease progression.13,15 These SD OCT features along with the ODS described in this article represent a family of clinical characteristics that play an important role in predicting GA. We plan to conduct an analysis of this family of SD OCT features to determine their association with each other and compare their predictive power in AMD progression. It would also be worthwhile to explore the relationship between this SD OCT family of features and known AMD susceptibility genes, such as age-related maculopathy susceptibility 2 and a previously studied library of single nucleotide polymorphisms.28,38,39
Supplementary Material
Acknowledgments
The authors thank Dr. Francisco Folgar for his input on study outcomes and statistical considerations.
Financial Disclosure(s): The author(s) have made the following disclosure(s): A-K.M.E-H.S., V.T., K.P.W., S.S.S., T.S.H., G.B.H., M.M., R.G., W.T.W., and E.Y.C.: Grants – National Eye Institute, Genentech, Alcon, and Bioptigen during the conduct of the study.
S.J.C.: Grants – National Eye Institute, Genentech, Alcon, and Bioptigen during the conduct of the study; and segmentation and identification of layered structures in images US 20110182517 A1 (patent).
C.A.T.: Royalties – Alcon; Research grants for this study – Alcon, Bioptigen, and Genentech.
The AREDS2 was supported by the National Eye Institute of the National Institutes of Health, Bethesda, Maryland (National Institutes of Health 1R01EY023039 grant). The following sponsors supported the AREDS2 Ancillary SD OCT Study and had no role in the design or conduct of this research: Genentech, San Francisco, California (research grant); Alcon, Fort Worth, Texas (research grant); and Bioptigen, Morrisville, North Carolina (research grant).
Abbreviations and Acronyms
- AMD
age-related macular degeneration
- AREDS2
Age-Related Eye Disease Study 2
- A2A SD OCT
AREDS2 Ancillary SD OCT
- CNV
choroidal neovascularization
- GA
geographic atrophy
- GEE
generalized estimating equation
- IRF
intraretinal fluid
- OCT
optical coherence tomography
- ODS
optical coherence tomography—reflective drusen substructures
- PRL
photoreceptor layer
- RAT
retinal pigment epithelium drusen complex abnormal thinning
- ROI
region of interest
- RPE
retinal pigment epithelium
- RPEDC
retinal pigment epithelium drusen complex
- SD OCT
spectral domain optical coherence tomography
- SRF
subretinal fluid
Footnotes
*Supplemental material is available at www.aaojournal.org.
Presented in part at the Association for Research in Vision and Ophthalmology Annual Meeting, May 3–7, 2015, Denver, Colorado; and the American Academy of Ophthalmology Annual Meeting, November 14–17, 2015, Las Vegas, Nevada.
Author Contributions: Conception and design: Veerappan, El-Hage Sleiman, Tai, Chiu, Winter, Stinnett, Hwang, Hubbard, Michelson, Gunther, Wong, Chew, Toth
Data collection: Veerappan, El-Hage Sleiman, Tai, Chiu, Winter, Stinnett, Hwang, Hubbard, Michelson, Gunther, Wong, Chew, Toth
Analysis and interpretation: Veerappan, El-Hage Sleiman, Tai, Chiu, Winter, Stinnett, Hwang, Hubbard, Michelson, Gunther, Wong, Chew, Toth
Obtained funding: Not applicable
Overall responsibility: Veerappan, El-Hage Sleiman, Tai, Chiu, Winter, Stinnett, Hwang, Hubbard, Michelson, Gunther, Wong, Chew, Toth
References
- 1.Sunness JS, Rubin GS, Applegate CA, et al. Visual function abnormalities and prognosis in eyes with age-related geographic atrophy of the macula and good visual acuity. Ophthalmology. 1997;104:1677–1691. doi: 10.1016/s0161-6420(97)30079-7. [DOI] [PMC free article] [PubMed] [Google Scholar]
- 2.Tomany SC, Wang JJ, Van Leeuwen R, et al. Risk factors for incident age-related macular degeneration: pooled findings from 3 continents. Ophthalmology. 2004;111:1280–1287. doi: 10.1016/j.ophtha.2003.11.010. [DOI] [PubMed] [Google Scholar]
- 3.Klein R, Klein BE, Knudtson MD, et al. Fifteen-year cumulative incidence of age-related macular degeneration: the Beaver Dam Eye Study. Ophthalmology. 2007;114:253–262. doi: 10.1016/j.ophtha.2006.10.040. [DOI] [PubMed] [Google Scholar]
- 4.Loewenstein A. The significance of early detection of age-related macular degeneration: Richard & Hinda Rosenthal Foundation lecture, The Macula Society 29th annual meeting. Retina. 2007;27:873–878. doi: 10.1097/IAE.0b013e318050d2ec. [DOI] [PubMed] [Google Scholar]
- 5.Spaide RF, Curcio CA, Zweifel SA. Drusen, an old but new frontier. Retina. 2010;30:1163–1165. doi: 10.1097/IAE.0b013e3181ed8d05. [DOI] [PMC free article] [PubMed] [Google Scholar]
- 6.Wang L, Clark ME, Crossman DK, et al. Abundant lipid and protein components of drusen. PLoS One. 2010;5:e10329. doi: 10.1371/journal.pone.0010329. [DOI] [PMC free article] [PubMed] [Google Scholar]
- 7.Anderson DH, Ozaki S, Nealon M, et al. Local cellular sources of apolipoprotein E in the human retina and retinal pigmented epithelium: implications for the process of drusen formation. Am J Ophthalmol. 2001;131:767–781. doi: 10.1016/s0002-9394(00)00961-2. [DOI] [PubMed] [Google Scholar]
- 8.Johnson LV, Leitner WP, Rivest AJ, et al. The Alzheimer's A beta -peptide is deposited at sites of complement activation in pathologic deposits associated with aging and age-related macular degeneration. Proc Natl Acad Sci U S A. 2002;99:11830–11835. doi: 10.1073/pnas.192203399. [DOI] [PMC free article] [PubMed] [Google Scholar]
- 9.Mullins RF, Hageman GS. Human ocular drusen possess novel core domains with a distinct carbohydrate composition. J Histochem Cytochem. 1999;47:1533–1539. doi: 10.1177/002215549904701205. [DOI] [PubMed] [Google Scholar]
- 10.Mullins RF, Russell SR, Anderson DH, Hageman GS. Drusen associated with aging and age-related macular degeneration contain proteins common to extracellular deposits associated with atherosclerosis, elastosis, amyloidosis, and dense deposit disease. FASEB J. 2000;14:835–846. [PubMed] [Google Scholar]
- 11.Stopa M, Bower BA, Davies E, et al. Correlation of pathologic features in spectral domain optical coherence tomography with conventional retinal studies. Retina. 2008;28:298–308. doi: 10.1097/IAE.0b013e3181567798. [DOI] [PubMed] [Google Scholar]
- 12.Khanifar AA, Koreishi AF, Izatt JA, Toth CA. Drusen ultra-structure imaging with spectral domain optical coherence tomography in age-related macular degeneration. Ophthalmology. 2008;115:1883–1890. doi: 10.1016/j.ophtha.2008.04.041. [DOI] [PMC free article] [PubMed] [Google Scholar]
- 13.Leuschen JN, Schuman SG, Winter KP, et al. Spectral-domain optical coherence tomography characteristics of intermediate age-related macular degeneration. Ophthalmology. 2013;120:140–150. doi: 10.1016/j.ophtha.2012.07.004. [DOI] [PMC free article] [PubMed] [Google Scholar]
- 14.Folgar FA, Yuan EL, Sevilla MB, et al. Drusen volume and retinal pigment epithelium abnormal thinning volume predict 2-year progression of age-related macular degeneration. Ophthalmology. 2016;123:39–50.e1. doi: 10.1016/j.ophtha.2015.09.016. [DOI] [PubMed] [Google Scholar]
- 15.Christenbury JG, Folgar FA, O'Connell RV, et al. Progression of intermediate age-related macular degeneration with proliferation and inner retinal migration of hyperreflective foci. Ophthalmology. 2013;120:1038–1045. doi: 10.1016/j.ophtha.2012.10.018. [DOI] [PMC free article] [PubMed] [Google Scholar]
- 16.Chew EY, Clemons T, SanGiovanni JP, et al. The Age-Related Eye Disease Study 2 (AREDS2): study design and baseline characteristics (AREDS2 report number 1) Ophthalmology. 2012;119:2282–2289. doi: 10.1016/j.ophtha.2012.05.027. [DOI] [PMC free article] [PubMed] [Google Scholar]
- 17.Klein R, Davis MD, Magli YL, et al. The Wisconsin age-related maculopathy grading system. Ophthalmology. 1991;98:1128–1134. doi: 10.1016/s0161-6420(91)32186-9. [DOI] [PubMed] [Google Scholar]
- 18.Farsiu S, Chiu SJ, O'Connell RV, et al. Quantitative classification of eyes with and without intermediate age-related macular degeneration using optical coherence tomography. Ophthalmology. 2014;121:162–172. doi: 10.1016/j.ophtha.2013.07.013. [DOI] [PMC free article] [PubMed] [Google Scholar]
- 19.Danis RP, Domalpally A, Chew EY, et al. Methods and reproducibility of grading optimized digital color fundus photographs in the Age-Related Eye Disease Study 2 (AREDS2 Report Number 2) Invest Ophthalmol Vis Sci. 2013;54:4548–4554. doi: 10.1167/iovs.13-11804. [DOI] [PMC free article] [PubMed] [Google Scholar]
- 20.Daniel E, Toth CA, Grunwald JE, et al. Risk of scar in the comparison of age-related macular degeneration treatments trials. Ophthalmology. 2014;121:656–666. doi: 10.1016/j.ophtha.2013.10.019. [DOI] [PMC free article] [PubMed] [Google Scholar]
- 21.Querques G, Forte R, Querques L, et al. Natural course of adult-onset foveomacular vitelliform dystrophy: a spectral-domain optical coherence tomography analysis. Am J Ophthalmol. 2011;152:304–313. doi: 10.1016/j.ajo.2011.01.047. [DOI] [PubMed] [Google Scholar]
- 22.Folgar FA, Chow JH, Farsiu S, et al. Spatial correlation between hyperpigmentary changes on color fundus photography and hyperreflective foci on SDOCT in intermediate AMD. Invest Ophthalmol Vis Sci. 2012;53:4626–4633. doi: 10.1167/iovs.12-9813. [DOI] [PubMed] [Google Scholar]
- 23.Chiu SJ, Izatt JA, O'Connell RV, et al. Validated automatic segmentation of AMD pathology including drusen and geographic atrophy in SD OCT images. Invest Ophthalmol Vis Sci. 2012;53:53–61. doi: 10.1167/iovs.11-7640. [DOI] [PubMed] [Google Scholar]
- 24.Davis MD, Gangnon RE, Lee LY, et al. The Age-Related Eye Disease Study severity scale for age-related macular degeneration: AREDS Report No. 17. Arch Ophthalmol. 2005;123:1484–1498. doi: 10.1001/archopht.123.11.1484. [DOI] [PMC free article] [PubMed] [Google Scholar]
- 25.Chiu SJ, Li XT, Nicholas P, et al. Automatic segmentation of seven retinal layers in SDOCT images congruent with expert manual segmentation. Opt Express. 2010;18:19413–19428. doi: 10.1364/OE.18.019413. [DOI] [PMC free article] [PubMed] [Google Scholar]
- 26.The Age-Related Eye Disease Study system for classifying age-related macular degeneration from stereoscopic color fundus photographs: the Age-Related Eye Disease Study Report Number 6. Am J Ophthalmol. 2001;132:668–681. doi: 10.1016/s0002-9394(01)01218-1. [DOI] [PubMed] [Google Scholar]
- 27.Klein ML, Ferris FL, 3rd, Armstrong J, et al. Retinal precursors and the development of geographic atrophy in age-related macular degeneration. Ophthalmology. 2008;115:1026–1031. doi: 10.1016/j.ophtha.2007.08.030. [DOI] [PubMed] [Google Scholar]
- 28.Mullins RF, Skeie JM, Folk JC, et al. Evaluation of variants in the selectin genes in age-related macular degeneration. BMC Med Genet. 2011;12:58. doi: 10.1186/1471-2350-12-58. [DOI] [PMC free article] [PubMed] [Google Scholar]
- 29.Johnson LV, Ozaki S, Staples MK, et al. A potential role for immune complex pathogenesis in drusen formation. Exp Eye Res. 2000;70:441–449. doi: 10.1006/exer.1999.0798. [DOI] [PubMed] [Google Scholar]
- 30.Johnson LV, Leitner WP, Staples MK, Anderson DH. Complement activation and inflammatory processes in Drusen formation and age related macular degeneration. Exp Eye Res. 2001;73:887–896. doi: 10.1006/exer.2001.1094. [DOI] [PubMed] [Google Scholar]
- 31.Kuhrt H, Hartig W, Grimm D, et al. Changes in CD44 and ApoE immunoreactivities due to retinal pathology of man and rat. J Hirnforsch. 1997;38:223–229. [PubMed] [Google Scholar]
- 32.Ambati J, Atkinson JP, Gelfand BD. Immunology of age-related macular degeneration. Nat Rev Immunol. 2013;13:438–451. doi: 10.1038/nri3459. [DOI] [PMC free article] [PubMed] [Google Scholar]
- 33.Thompson RB, Reffatto V, Bundy JG, et al. Identification of hydroxyapatite spherules provides new insight into subretinal pigment epithelial deposit formation in the aging eye. Proc Natl Acad Sci U S A. 2015;112:1565–1570. doi: 10.1073/pnas.1413347112. [DOI] [PMC free article] [PubMed] [Google Scholar]
- 34.Schlanitz FG, Sacu S, Baumann B, et al. Identification of drusen characteristics in age-related macular degeneration by polarization-sensitive optical coherence tomography. Am J Ophthalmol. 2015;160:335–344.e1. doi: 10.1016/j.ajo.2015.05.008. [DOI] [PMC free article] [PubMed] [Google Scholar]
- 35.Suzuki M, Curcio CA, Mullins RF, Spaide RF. Refractile drusen: clinical imaging and candidate histology. Retina. 2015;35:859–865. doi: 10.1097/IAE.0000000000000503. [DOI] [PubMed] [Google Scholar]
- 36.Landis JR, Koch GG. The measurement of observer agreement for categorical data. Biometrics. 1977;33:159–174. [PubMed] [Google Scholar]
- 37.Wang JJ, Rochtchina E, Lee AJ, et al. Ten-year incidence and progression of age-related maculopathy: the blue Mountains Eye Study. Ophthalmology. 2007;114:92–98. doi: 10.1016/j.ophtha.2006.07.017. [DOI] [PubMed] [Google Scholar]
- 38.Grassmann F, Fleckenstein M, Chew EY, et al. Clinical and genetic factors associated with progression of geographic atrophy lesions in age-related macular degeneration. PLoS One. 2015;10:e0126636. doi: 10.1371/journal.pone.0126636. [DOI] [PMC free article] [PubMed] [Google Scholar]
- 39.Horie-Inoue K, Inoue S. Genomic aspects of age-related macular degeneration. Biochem Biophys Res Commun. 2014;452:263–275. doi: 10.1016/j.bbrc.2014.08.013. [DOI] [PubMed] [Google Scholar]
Associated Data
This section collects any data citations, data availability statements, or supplementary materials included in this article.