Abstract
Purpose
Macular development is a complex process that starts by mid-gestation and continues several years after birth. A preterm birth could affect this development, causing increased thickness in the central macula, but the effect of the macular function remains uncertain. The aim of this study was to investigate the macular function measured with multifocal electroretinography (mfERG), in former preterm children and compare with healthy controls. A second aim was to correlate central macular function with central macular thickness measured with optical coherent tomography (OCT), in the preterm group.
Methods
Fifteen former preterm children born before 32 weeks of gestation were included in the study. MfERG results from 12 children acted as controls. Visual acuity, refraction in cycloplegia and mfERG were carried out in all children, and optical coherent tomography (OCT) was performed in the preterm children. Main outcomes were P1 amplitudes and implicit times for Rings 1–5 and “sum of groups” of the mfERG, and central macula thickness in area A1 measured with OCT.
Results
The P1 amplitudes were reduced in Rings 1–5 and “Sum of groups” in the preterm children compared to controls. There were no significant correlation between P1 amplitude or implicit times in Ring 1 and central macular thickness in the preterm group.
Conclusions
Macular function is reduced in former preterm children compared to children born at term. This suggests that the structural changes with a thicker central retina can have an effect on function and may be one, of probably several, explanations for visual dysfunction in preterm children at school age.
Keywords: Macula, Multifocal electroretinogram (mfERG), Optical coherent tomography (OCT), Preterm children
Introduction
The macular region is the last part of the retina to develop, and the development is not completed until several years after birth [1]. However, major processes in macular development take place during the second half of pregnancy. Histological studies show how the ganglion cells and inner retinal cells migrate peripherally, and the cone photoreceptors migrate centrally, elongate and become packed tightly together to form the foveal dimple [2]. More recent studies with hand-held optical coherent tomography (OCT) performed in children born preterm and at term have confirmed these developmental processes [3–5].
Normal development of the macular region seems to be disturbed in children born prematurely. When measured with optical coherent tomography (OCT), the innermost area of the macula is thicker in children born preterm compared to children born at term and children with the lowest gestational age have the thickest central maculae [6]. Further, the visual functions of preterm children are affected at school age, including reduced visual acuity and affected contrast vision [7, 8]. In some children, this can be explained by neonatal complications such as retinopathy of prematurity (ROP) and neurological complications such as intraventricular haemorrhages and periventricular leukomalacia, However, even in the absence of ROP and evident neurological complications, visual functions can still be affected and the reason for this is not clear [9].
The aim of this study was to evaluate central macular function with multifocal electroretinography (mfERG) in former preterm children and compare the findings with those of children born at term. A second aim was to correlate central macular function with central macular thickness measured with OCT, in the preterm group.
Materials and methods
Former preterm children born before 32 weeks of gestation were asked together with their caregivers, to participate in this study, and 15 children gave their informed consent. During the neonatal period, the children were screened for ROP at Uppsala University Hospital. Six children had no ROP detected at screening, seven had mild ROP (stage 1–2), and two had severe ROP (stage 3) and were treated previously with laser photocoagulation.
MfERG results from 12 healthy children between 8 and 19 years of age, with normal visual acuity, acted as controls.
Descriptive data of the children in the preterm group are presented in Table 1.
Table 1.
Descriptive data for the preterm group, with and without ROP
| Age (years) Median (range) | Gender ♀/♂ | GA (weeks) Median (range) | BW (g) Median (range) | VA (Snellen) Median (range) | Spherical equivalent Median (range) | |
|---|---|---|---|---|---|---|
| Total n = 15 | 13 (9–17) | 11/4 | 30.0 (24–32) | 1231 (611–2030) | 1.0 (0.6–1.3) | +0.63 (−1.5–+2.38) |
| No ROP n = 6 | 14.0 (10–17) | 5/1 | 31.0 (29–32) | 1700 (1231–2030) | 1.0 (0.6–1.25) | +0.31 (−1.5–+0.88) |
| ROP n = 9 | 13.0 (9–14) | 6/3 | 27.5 (24–30) | 901 (611–1614) | 1.0 (1.0–1.3) | +0.81 (0.0–+2.38) |
Visual acuity and spherical equivalent in right eyes
GA gestational age at birth, BW birth weight, VA visual acuity
The mfERG examinations took place at the Department of Ophthalmology at Lund University Hospital and were performed by two experienced technicians.
Best-corrected visual acuity was assessed, and the pupils were dilated with topical 1% cyclopentolate. MfERG was recorded using the visual evoked response imaging system (VERIS 6 EDI, San Mateo, CA, USA). After applying topical anaesthesia in the eye, a Burian-Allen bipolar contact lens was applied on the cornea of one eye and the other eye was covered with an eye patch. A ground electrode was placed on the forehead. A protocol with 103 black and white hexagonal elements displayed in a cathode ray tube (CRT) monitor was used. Hexagons were scaled to eccentricity and were altered in a pseudorandomized sequence at 75 Hz frame rate, and ERG responses were recorded in periods of 30 s, 16 times for each eye. The stimulation parameters were in accordance with recommendations of the ISCEV [10]. Fixation was continually monitored with a camera using infrared light at the edge of the corneal electrode to illuminate the fundus.
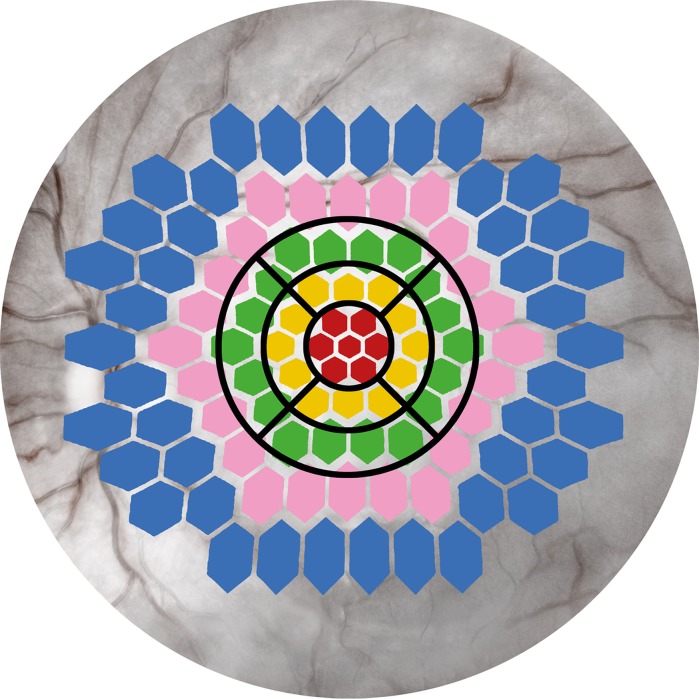
Results from right eyes in the preterm group and right or left eyes in the control group were used. The amplitudes and implicit times of the first-order component, P1, were analysed, and the results were presented in five concentric rings and as a “sum of all groups”, see Fig. 1.
Fig. 1.
Schematic drawing of the 103 hexagons of the multifocal ERG, with Rings 1–5 marked with different colours, and the ETDRS map of the optical coherent tomography (OCT)
OCT measurements of the central macula of the former preterm children were performed using a SD-Cirrus HD OCT 4000 (Carl Zeiss Meditec, Dublin, CA, USA). The Macular Cube 512 × 128 was used to scan a 6 × 6 mm area with 512 horizontal A-scans and 128 vertical B-scans. The retinal thickness results are presented in three concentric circular regions: The most central region is 1 mm in diameter, the middle region is 3 mm in diameter; and the outer region is 6 mm in diameter. The circular regions were divided into nine regions according to the Early Treatment for Diabetic Retinopathy Study (ETDRS) as shown in Fig. 1.
The ETDRS map approximately corresponds with the four innermost concentric circles (14°) of the mfERG, and the central area (A1) corresponds to the central ring of the mfERG (4°) as shown in Fig. 1 [11].
Statistical methods
SPSS 21 (IBM Corporation, Armonk, NY, USA) was used for the statistical analyses. In accordance with ISCEV recommendations, nonparametric tests were used throughout for analysis of mfERG results. The Mann-Whitey U test was used to compare the preterm group with the control group. No correction for multiple tests was performed, and p values should be interpreted with caution. Correlations were analysed with the Spearman correlation test. A p value less than 0.05 was considered statistically significant.
Results
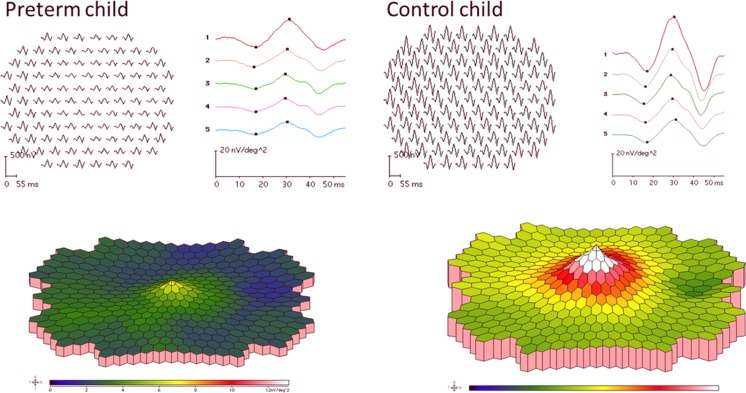
The trace array, colour map and results for Rings 1–5 as well as “Sum of groups” of mfERG from one former preterm child with ROP in the neonatal period, and one control, are shown in Fig. 2.
Fig. 2.
Multifocal ERG results as trace arrays and colour-coded maps, from one child in the preterm group, who had ROP grade 2 in the neonatal period, and one child in the control group
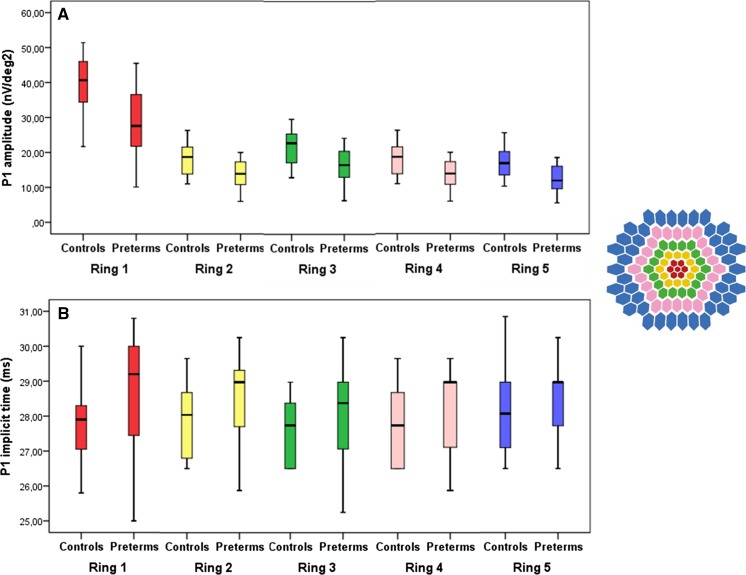
Median and range for amplitudes and implicit times of the P1 response in Rings 1–5 and “Sum of groups” are presented in Table 2.
Table 2.
Implicit times and amplitudes of the multifocal ERG P1 response in Rings 1–5 and “Sum of groups” in the right eyes in the preterm group and in right or left eyes in the control group
| Preterm group n = 15 | Control group n = 12 | p value | |
|---|---|---|---|
| P1 implicit time (ms) median (range) | |||
| Ring 1 | 29.2 (25.0–30.8) | 27.9 (25.8–30.0) | 0.26 |
| Ring 2 | 28.3 (24.2–30.0) | 27.1 (25.0–29.2) | 0.14 |
| Ring 3 | 27.5 (23.3–30.0) | 26.7 (25.0–28.3) | 0.18 |
| Ring 4 | 28.3 (24.2–29.2) | 26.7 (25.0–29.2) | 0.26 |
| Ring 5 | 28.3 (25.0–30.0) | 27.1 (25.0–30.8) | 0.50 |
| Sum of groups | 28.3 (24.2–30.0) | 27.1 (25.0–30.0) | 0.37 |
| P1 amplitude (nV/deg2) median (range) | |||
| Ring 1 | 27.6 (10.1–45.5) | 40.7 (21.7–51.4) | 0.01 |
| Ring 2 | 19.1 (7.6–31.4) | 27.8 (16.3–35.8) | 0.02 |
| Ring 3 | 16.5 (6.3–24.2) | 22.8 (12.9–29.6) | 0.02 |
| Ring 4 | 13.9 (6.0–20.0) | 18.7 (11.0–26.3) | 0.01 |
| Ring 5 | 11.9 (5.5–18.5) | 16.9 (10.3–25.6) | 0.01 |
| Sum of groups (uV) | 19.2 (8.2–38.3) | 24.7 (13.5–31.5) | 0.05 |
Bold values indicate statistically significant p-values
Compared to controls, P1 amplitude was significantly smaller in the preterm group. There was no significant difference in implicit times between groups (Fig. 3).
Fig. 3.
a Amplitudes of the P1 response in Ring 1–5 of the multifocal ERG in right eyes in the control group and in right or left eyes in the preterm group. b Implicit times of the P1 response in Ring 1–5 of the multifocal ERG in the control group and preterm group. Each box shows the median and interquartile range, bars show range
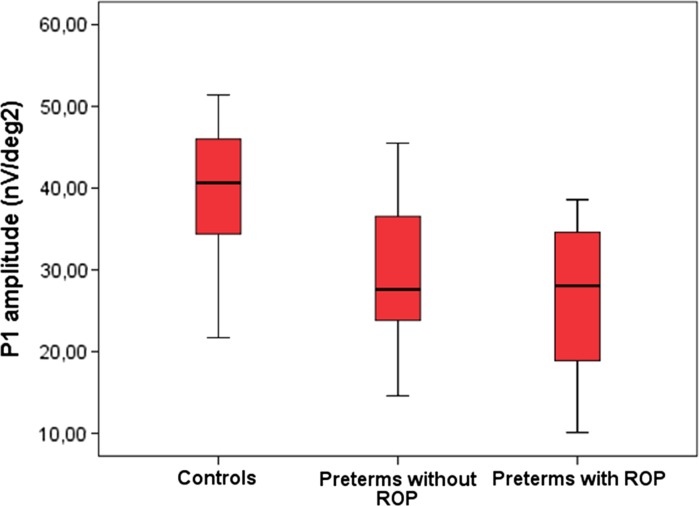
In the preterm group, there was no significant difference between children with or without ROP according to amplitudes or implicit times in any of the rings. In Fig. 4, we present the result of the P1 amplitude in Ring 1, for preterm with and without ROP and controls.
Fig. 4.
P1 amplitude of the responses in Ring 1 in multifocal ERG in right or left eyes in the controls, in right eyes in the preterm children without retinopathy of prematurity (ROP) and the preterm children with ROP in the neonatal period. Each box shows the median and interquartile range; bars show range
In the preterm group, OCT measurements were available in 14 of the 15 children. Median values of the central macular thickness (area A1) for the right eyes were 278 um (range 252–318). There was no significant correlation between P1 amplitude or implicit times in Ring 1 and central macular thickness. There were no significant correlations with any of the mfERG responses for age at investigation, GA, ROP or VA.
Conclusions
Former preterm children have various visual dysfunctions, but the reason for this is not totally clear. In the present study, we have shown that the macular function measured with mfERG is reduced in prematurely born children compared to controls. Studies with mfERG in former preterm children are few, but Fulton et al. [12] have described reduced amplitudes and prolonged implicit times in preterm children with mild ROP. The amplitude reduction was greatest in the central rings and decreased in the peripheral rings, while the implicit times did not change as much with eccentricity. These results are essentially in line with the results of the present study. In the present study, we had a number of children that did not have ROP during the neonatal period. A limitation of both studies, however, is the small number of study subjects, and future studies with larger numbers of children with and without ROP in the neonatal period are needed to confirm our results.
Myopia is common in children with ROP, especially if they have been treated with laser photocoagulation or cryotherapy. Myopia is also a known reason for reduced macular function [13]. In the present study, however, most former preterm children were not myopic, and thus, the refraction cannot be an explanation for the difference between the groups.
In macular diseases such as diabetic retinopathy and macular degeneration, mfERG recordings show reduced P1 amplitudes and prolonged P1 implicit times [11, 14]. ROP is also a disease affecting the retinal vessels resulting in retinal ischaemia. It has been shown with hand-held OCT devices that preterm children with ROP can have macular cysts, oedema and subretinal fluid in the neonatal period, and although these changes resolve in time, it is not known whether the effects on macular function can persist in the future [15, 16]. Studies comparing macular morphology and macular function in older children with and without macular changes during the neonatal period could elucidate this further.
We have previously shown that central macular thickness measured with OCT is increased in former preterm children, suggesting a disturbance in the normal development of the macular region [6]. Further studies with spectral domain OCT (SD-OCT) has shown that the inner retinal cells have not completed their peripheral migration and that seems to be associated with the increased thickness [17, 18]. A recent study by Vajzovic et al. [19] using hand-held OCT showed a delayed photoreceptor development in preterm children compared to children born at term when investigated at 37 weeks of gestation and onward. It is not known whether this delay in maturation affects the photoreceptors later in life. In the present study, we could not show significant correlation between structure and function. We can only speculate that increased macular thickness in former preterm children not only is a sign of immaturity but also an indication of altered neural retinal function even if this is not confirmed by decreased visual acuity whether there is a correlation between structure and function also in healthy subjects cannot be concluded from the present study, where OCT was only performed in the children born prematurely. However, in a recent study of normal children aged 5–15 years, we also found a correlation between P1 implicit time in the inner ring of the mfERG and OCT measurements of the macular area [20].
The macular region is affected in prematurely born children regarding both morphology and function. In this small study, we could not find a correlation between macular function and visual acuity and this is probably because reduced macular function is one of the several explanations of reduced visual acuity seen in former preterm children. A larger study including children with and without ROP might give us more information about how macular function affects vision in former preterm children.
Acknowledgements
We would like to thank Boel Nilsson and Ing-Marie Holst at the Department of Ophthalmology, Lund University Hospital, for conducting the examinations of the children. The study was supported by “Carmen and Bertil Regner´s fund” and “Crown Princess Margareta’s Foundation for the visually impaired”.
Compliance with ethical standards
Conflict of interest
The authors declare that they have no conflict of interest.
Ethical approval
All procedures performed in studies involving human participants were in accordance with the ethical standards of the institutional and/or national research committee and with the 1964 Helsinki Declaration and its later amendments or comparable ethical standards. Ethical approval was obtained from the ethical committee of Uppsala University.
Informed consent
Informed consent was obtained from all individual participants included in the study.
Statement on the welfare of animals
All applicable international, national, and/or institutional guidelines for the care and use of animals were followed.
References
- 1.Hendrickson A, Possin D, Vajzovic L, Toth CA. Histologic development of the human fovea from midgestation to maturity. Am J Ophthalmol. 2012;154(5):767–778. doi: 10.1016/j.ajo.2012.05.007. [DOI] [PMC free article] [PubMed] [Google Scholar]
- 2.Hendrickson AE, Yuodelis C. The morphological development of the human fovea. Ophthalmology. 1984;91(6):603–612. doi: 10.1016/S0161-6420(84)34247-6. [DOI] [PubMed] [Google Scholar]
- 3.Dubis AM, Costakos DM, Subramaniam CD, Godara P, Wirostko WJ, Carroll J, Provis JM. Evaluation of normal human foveal development using optical coherence tomography and histologic examination. Arch Ophthalmol. 2012;130(10):1291–1300. doi: 10.1001/archophthalmol.2012.2270. [DOI] [PMC free article] [PubMed] [Google Scholar]
- 4.Maldonado RS, O’Connell RV, Sarin N, Freedman SF, Wallace DK, Cotten CM, Winter KP, Stinnett S, Chiu SJ, Izatt JA, Farsiu S, Toth CA. Dynamics of human foveal development after premature birth. Ophthalmology. 2011;118(12):2315–2325. doi: 10.1016/j.ophtha.2011.05.028. [DOI] [PMC free article] [PubMed] [Google Scholar]
- 5.Yanni SE, Wang J, Chan M, Carroll J, Farsiu S, Leffler JN, Spencer R, Birch EE. Foveal avascular zone and foveal pit formation after preterm birth. Br J Ophthalmol. 2012;96(7):961–966. doi: 10.1136/bjophthalmol-2012-301612. [DOI] [PubMed] [Google Scholar]
- 6.Akerblom H, Larsson E, Eriksson U, Holmstrom G. Central macular thickness is correlated with gestational age at birth in prematurely born children. Br J Ophthalmol. 2011;95(6):799–803. doi: 10.1136/bjo.2010.184747. [DOI] [PubMed] [Google Scholar]
- 7.Holmstrom G, Larsson E. Long-term follow-up of visual functions in prematurely born children—a prospective population-based study up to 10 years of age. J AAPOS: Off Publ Am Assoc Pediatr Ophthalmol Strabismus/Am Assoc Pediatr Ophthalmol Strabismus. 2008;12(2):157–162. doi: 10.1016/j.jaapos.2007.08.012. [DOI] [PubMed] [Google Scholar]
- 8.O’Connor AR, Wilson CM, Fielder AR. Ophthalmological problems associated with preterm birth. Eye. 2007;21(10):1254–1260. doi: 10.1038/sj.eye.6702838. [DOI] [PubMed] [Google Scholar]
- 9.Larsson EK, Rydberg AC, Holmstrom GE. A population-based study on the visual outcome in 10-year-old preterm and full-term children. Arch Ophthalmol. 2005;123(6):825–832. doi: 10.1001/archopht.123.6.825. [DOI] [PubMed] [Google Scholar]
- 10.Hood DC, Bach M, Brigell M, Keating D, Kondo M, Lyons JS, Marmor MF, McCulloch DL, Palmowski-Wolfe AM, Vision ISFCEo ISCEV standard for clinical multifocal electroretinography (mfERG) (2011 edition) Doc Ophthalmol Adv Ophthalmol. 2012;124(1):1–13. doi: 10.1007/s10633-011-9296-8. [DOI] [PMC free article] [PubMed] [Google Scholar]
- 11.Holm K, Larsson J, Lovestam-Adrian M. In diabetic retinopathy, foveal thickness of 300 um seems to correlate with functionally significant loss of vision. Doc Ophthalmol Adv Ophthalmol. 2007;114(3):117–124. doi: 10.1007/s10633-006-9044-7. [DOI] [PubMed] [Google Scholar]
- 12.Fulton AB, Hansen RM, Moskowitz A, Barnaby AM. Multifocal ERG in subjects with a history of retinopathy of prematurity. Doc Ophthalmol Adv Ophthalmol. 2005;111(1):7–13. doi: 10.1007/s10633-005-2621-3. [DOI] [PubMed] [Google Scholar]
- 13.Kawabata H, Adachi-Usami E. Multifocal electroretinogram in myopia. Investig Ophthalmol Vis Sci. 1997;38(13):2844–2851. [PubMed] [Google Scholar]
- 14.Garcia-Garcia JG, Ruiz-Moreno JM, Holm K, Andreasson S, Lovestam-Adrian M. Macular dysfunction in drusen maculopathy assessed with multifocal electroretinogram and optical coherence tomography. Clin Ophthalmol. 2013;7:1303–1309. doi: 10.2147/OPTH.S39258. [DOI] [PMC free article] [PubMed] [Google Scholar]
- 15.Dubis AM, Subramaniam CD, Godara P, Carroll J, Costakos DM. Subclinical macular findings in infants screened for retinopathy of prematurity with spectral-domain optical coherence tomography. Ophthalmology. 2013;120(8):1665–1671. doi: 10.1016/j.ophtha.2013.01.028. [DOI] [PMC free article] [PubMed] [Google Scholar]
- 16.Vinekar A, Avadhani K, Sivakumar M, Mahendradas P, Kurian M, Braganza S, Shetty R, Shetty BK. Understanding clinically undetected macular changes in early retinopathy of prematurity on spectral domain optical coherence tomography. Investig Ophthalmol Vis Sci. 2011;52(8):5183–5188. doi: 10.1167/iovs.10-7155. [DOI] [PubMed] [Google Scholar]
- 17.Hammer DX, Iftimia NV, Ferguson RD, Bigelow CE, Ustun TE, Barnaby AM, Fulton AB. Foveal fine structure in retinopathy of prematurity: an adaptive optics Fourier domain optical coherence tomography study. Investig Ophthalmol Vis Sci. 2008;49(5):2061–2070. doi: 10.1167/iovs.07-1228. [DOI] [PMC free article] [PubMed] [Google Scholar]
- 18.Villegas VM, Capo H, Cavuoto K, McKeown CA, Berrocal AM. Foveal structure-function correlation in children with history of retinopathy of prematurity. Am J Ophthalmol. 2014;158(3):508–512. doi: 10.1016/j.ajo.2014.05.017. [DOI] [PubMed] [Google Scholar]
- 19.Vajzovic L, Rothman AL, Tran-Viet D, Cabrera MT, Freedman SF, Toth CA. Delay in retinal photoreceptor development in very preterm compared to term infants. Investig Ophthalmol Vis Sci. 2015;56(2):908–913. doi: 10.1167/iovs.14-16021. [DOI] [PMC free article] [PubMed] [Google Scholar]
- 20.Molnar AE, Andreasson SO, Larsson EK, Akerblom HM, Holmstrom GE. Macular function measured by binocular mfERG and compared with macular structure in healthy children. Doc Ophthalmol Adv Ophthalmol. 2015;131(3):169–176. doi: 10.1007/s10633-015-9513-y. [DOI] [PubMed] [Google Scholar]


