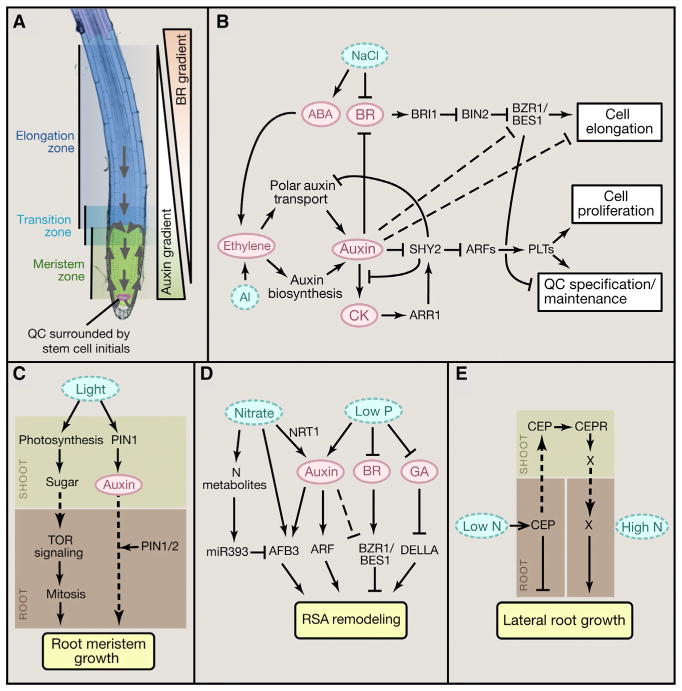
Figure 4. Signaling Networks Regulating Root Growth.
(A) Image of Arabidopsis root tip showing meristem zone, transition zone, and elongation zone. Arrows indicate the auxin reflux loop. PIN1 mediates polar auxin transport from shoot to the root tip. Auxin is then transported shootward by PIN2, creating auxin maximum in the QC and auxin gradient along the root developmental zones. BR distribution shows an opposite gradient with high BR levels in the elongation zone and low levels in the QC.
(B–E) Diagrams summarizing cross-regulation of root growth and development by hormones and environmental stimuli.
Arrows indicate positive regulation; bars indicate negative regulation; solid lines indicate direct regulation, dashed lines indicate indirect regulation; dotted arrows indicate movement of signals.

