Abstract
The family with sequence similarity 83, member D (FAM83D) gene is upregulated in hepatocellular carcinoma and ovarian cancer, and its overexpression has been reported to positively correlate with tumor progression. However, the clinical significance and biological function of FAM83D in lung adenocarcinoma has not been investigated. We determined the expression profile and clinical significance of FAM83D using The Cancer Genome Atlas (TCGA) and immunohistochemistry (IHC) analysis. Considerable upregulation of FAM83D was observed in LUAD tissues compared with adjacent normal tissues, and its overexpression was significantly associated with more advanced clinicopathological characteristics. Importantly, multivariate Cox regression analysis indicated that a high level of FAM83D expression was an independent risk factor for worse overall survival in LUAD patients (HR = 1.692, P = 0.006). Inhibition of FAM83D suppressed the proliferation of LUAD cells via G1 phase arrest by downregulating cyclin D1 (CCND1) and cyclin E1 (CCNE1). The oncogenic role of FAM83D was also confirmed in vivo. In conclusion, our study demonstrated that FAM83D might exert its oncogenic activity in LUAD by regulating cell cycle, and that it could serve as a novel biomarker and a potential therapeutic target for LUAD.
Keywords: FAM83D, TCGA, lung adenocarcinoma, cell cycle
Introduction
Lung cancer remains the leading cause of cancer-related death worldwide, and lung adenocarcinoma (LUAD) has been the most common subtype of lung cancer in recent years [1]. Despite diagnostic and therapeutic advances in lung cancer in recent decades, the prognosis is still unfavorable, with an overall 5-year survival of less than 15% [2]. Therefore, further investigation to identify prognostic biomarkers and potential drug targets is urgently needed to provide a better prognosis and individualized treatment.
The family with sequence similarity 83, member D (FAM83D) gene is located on chromosome 20q, a region that is frequently amplified in various types of human cancer [3-6]. FAM83D was first identified as a mitotic spindle component in a mass spectrometry study [7] and was reported to interact with chromokinesin KID to guide correct chromosome congression during metaphase [8]. Dysfunction of mitotic spindle may result in aneuploidy in both daughter cells, which is closely correlated with carcinogenesis and differentiation [9-11]. Some microarray studies have suggested that FAM83D expression is elevated in hepatocellular carcinoma [12] and ovarian cancer [3]. Additionally, FAM83D has been reported to exert its oncogenic activity by downregulating tumor suppressor gene FBXW7 in breast cancer [13], and by activating the MEK/ERK signaling pathway in hepatocellular carcinoma [14]. However, the clinical significance and biological function of FAM83D in lung adenocarcinoma has not yet been investigated.
In this study, for the first time we show aberrant expression and clinical significance of FAM83D in LUAD using The Cancer Genome Atlas (TCGA) dataset and immunohistochemistry analysis; furthermore, we found that high expression level of FAM83D predicts poor survival in LUAD patients. In addition, we show the biological role of FAM83D in vitro and in vivo. Our findings suggest that FAM83D might play a significant role in the malignant progression of LUAD.
Materials and methods
Data source and bioinformatics analysis
A TCGA dataset named TCGA_LUAD_exp_HiSeqV2-2015-02-24 was downloaded from UCSC cancer browser (https://genome-cancer.ucsc.edu/) [15]. The dataset contains a list of 511 LUAD samples and 58 adjacent normal tissue samples. Expression values for FAM83D were obtained from the “genomicMatrix” file, and all values were normalized. Student’s t-test was used to evaluate FAM83D expression in tumor and para-tumor tissues. Chi-square test was used to analyze the association between clinical characteristics and FAM83D expression. Kaplan-Meier analysis, log-rank test and Cox regression analysis were used to evaluate the prognostic value of FAM83D in LUAD patients.
A list of 191 genes (details shown in Table S1) with highest co-expression correlation (Pearson r value >0.6) with FAM83D in the TCGA LUAD dataset were submitted to DAVID Bioinformatics Resources 6.7 (http://david.abcc.ncifcrf.gov/) [16,17] for Kyoto Encyclopedia of Genes and Genomes (KEGG) and Gene Ontology (GO) pathway enrichment analysis.
Cell lines, cell culture, siRNA and lentivirus-based RNA interference transfection
H1299, H1975 and A549 cells were obtained from American Type Culture Collection (ATCC, USA), while human bronchial epithelial cell (HBE) and SPC-A-1 cells were gifted by Dr. Zhibin Hu. All the cells were grown in RPMI1640 media (KeyGEN, Nanjing, China) supplemented with 10% fetal bovine serum and penicillin/streptomycin and cultured at 37°C in a humidified incubator containing 5% CO2. Transfection was performed according to the small-interfering RNA (siRNA) sequences transfection protocol for Lipofectamine RNAi MAX (Invitrogen, USA). Nonsense RNAi (nsRNA) was used as a negative control for FAM83D siRNA. Transfection efficiency was evaluated using quantitative real-time RT-PCR and western blot. Two siRNAs were designed: the sequences were as follows: siRNA-1 for FAM83D: 5’-GCAGUAACUUGGUAAUUCUTT-3’ (sense), 5’-AGAAUUACCAAGUUACUGCTT-3’ (antisense); siRNA-2 for FAM83D: 5’-CGGACUAUCACAGGAAAUATT-3’ (sense), 5’-UAUUUCCUGUGAUAGUCCGTT-3’ (antisense). And the following Nonsense siRNA was used as negative control: 5’-UUCUCCGAACGUGUCACGUTT-3’ (sense), 5’-ACGUGACACGUUCGGAGAATT-3’ (antisense). The human FAM83D-targeting small hairpin RNA sequence was designed based on siRNA-1 and nsRNA. We generated recombinant lentiviral particles and cells were transfected with FAM83D or negative control recombinant lentivirus (sh-FAM83D or sh-NC, respectively) as described in our previous article [18]. CCND1 and CCNE1 cDNA were cloned into a pEGFP-N1 vector (purchased from Genechem) to construct overexpression plasmid, and an empty vector was used as a negative control.
RNA extraction, reverse transcription and quantitative real-time PCR(qRT-PCR)
Total RNA was extracted from cultured cells using TRIzol reagent (Invitrogen, Carlsbad, CA, USA). For RT-PCR, 1000 ng total RNA was reverse-transcribed to a final volume of 20 μl cDNA using a Reverse Transcription Kit (Takara, cat: RR036A). qRT-PCR analyses were performed with SYBR Select Master Mix (Applied Biosystems, Cat: 4472908). The qRT-PCR primers for FAM83D, p21, p27, CCND1, CCNE1 and β-actin are shown in Table 1. The qRT-PCR data collection was performed using a QuantStudioTM 6 Flex Real-Time PCR System. The qRT-PCR reaction included an initial denaturation step at 95°C for 10 min, followed by 40 cycles of 92°C for 15 sec and 60°C for 1 min. Each sample was run in triplicate, and the relative expression was calculated and normalized using the 2-ΔΔCt method relative to β-actin.
Table 1.
Sequences of qRT-PCR primers
| Gene | Sense | Anti-sense |
|---|---|---|
| FAM83D | CTCTTCGGGCACCTACTTCC | ACCACTGCAATCACCTCTCG |
| CCND1 | GCGCTTCCAACCCACCCTCCATG | GCGCCGCAGGCTTGACTCCAGAA |
| CCNE1 | TTCTTGAGCAACACCCTCTTCTGCAGCC | TCGCCATATACCGGTCAAAGAAATCTTGTGCC |
| P21 | GCAGACCAGCATGACAGATTT | GGATTAGGGCTTCCTCTTGGA |
| P27 | TGGAGAAGCACTGCAGAGAC | GCGTGTCCTCAGAGTTAGCC |
| β-actin | GAAATCGTGCGTGACATTAA | AAGGAAGGCTGGAAGAGTG |
Protein preparation and western blot
Cells were harvested and treated with lysis buffer on ice (KeyGEN, Nanjing, China), and a BCA kit (KeyGEN, Nanjing, China) was used to quantify the protein concentration. Equal amounts of protein were loaded onto SDS-PAGE gels. After separation on the gel, the protein was transferred to a PVDF membrane. The membranes were blocked in 2% BSA in TBS-T for 1 h, and then incubated overnight (4°C) with antibodies against p21 (Santa Cruz, sc-397 1:500), p27 (Santa Cruz, sc-528 1:200), cyclin D1 (CST, 2978 1:1000), cyclin E1 (Abcam, ab7959 1:200) or β-actin (Cell Signaling, 8H10D10 1:1000). After being washed in TBS-T, membranes were incubated with goat anti-rabbit HRP-conjugated secondary antibody (1:10,000; Abcam) or goat anti-mouse HRP-conjugated secondary antibody (1:10,000; Abcam) for 2 h at room temperature. The blots were visualized using ECL detection (Thermo Scientific). All experiments were repeated at least three times independently.
Cell proliferation assays
The cell proliferation was monitored using a Cell Counting Kit-8 (KeyGEN, Nanjing, China) or the xCELLigence system. For Cell Counting Kit-8, cells were plated in 96-well plates at a density of 2000 cells in 100 µl per well, and the absorbance was measured at 450 nm with an ELx-800 universal microplate reader. Each experiment was repeated independently in quadruplicate. For colony formation assays, a total of 100 transfected cells were placed in a fresh six-well plate and maintained in medium containing 10% FBS; the medium was replaced every 3 or 4 days. After two weeks, cells were fixed with 4% paraformaldehyde and stained with 0.1% crystal violet. Visible colonies were then counted. For each treatment group, wells were assessed in triplicate. For the xCELLigence system, exponentially growing cells with corresponding treatment in complete media were seeded in E-plates at a density of 20,000 per well. The plates were then locked into the RTCA DP device in the incubator. The proliferative ability in each well was automatically monitored by the xCELLigence system and expressed as a “cell index” value. The cell growth was recorded in real-time for 90 h.
Cell migration and invasion assay
For the migration assay, transfected cells (40000 cells in 100 µl per well) were plated in the upper chamber of trans-well assay inserts (8-mm pores, Millipore, Billerica, MA) containing 200 µl of serum-free RPMI1640 media. The lower chambers were filled with RPMI1640 containing 10% FBS. After 24 h of incubation, cells on the filter surface were fixed with methanol, stained with crystal violet, and photographed. Migration ability was assessed by counting the number of stained cell nuclei in 5 random fields per filter in each group.
For the invasion assay, transfected cells (40,000 cells in 100 µl per well) were plated in the top chamber with a matrigel-coated membrane (BD Biosciences) in 300 µl serum-free RPMI1640. The bottom chambers were filled with RPMI1640 containing 10% FBS. The invasion ability was determined after 48 h incubation. Each experiment was repeated three times.
Flow cytometry analysis
Flow cytometry analysis was performed to detect cell cycle distribution. Cells were transferred and fixed in centrifuge tubes containing 4.5 mL of 70% ethanol on ice. The cells were kept in ethanol for at least 2 h at 4°C. Then, the ethanol-suspended cells were centrifuged for 5 min at 300 g. Cell pellets were resuspended in 5 mL of PBS for approximately 30 s and centrifuged at 300 g for 5 min, then resuspended in 1 mL of PI staining solution and kept in the dark at 37°C for 10 min. Samples were analyzed using a FACSCalibur flow cytometer. The percentage of the cells in G0-G1, S, and G2-M phases were counted and compared. All the samples were assayed in triplicate.
Xenograft experiment
All animal studies were conducted in accordance with NIH animal use guidelines, and the protocols were approved by Nanjing Medical University Animal Care Committee. Six female nude mice (ages 4-6 weeks) were purchased from Nanjing Medical University School of Medicine’s accredited animal facility. Briefly, 1.0×10⁶ exponentially growing A549 cells transfected with sh-FAM83D or sh-NC were injected subcutaneously in the mice’s axilla. Tumor volume was estimated as length × width2 ×0.5 every ten days using calipers. On the fortieth day after injection, the mice were sacrificed, and the tumors were weighed and collected for further analysis.
Tissue collection and immunohistochemistry
In this study, we collected 60 paired samples of LUAD and adjacent normal tissues from patients who underwent surgical resection at the Affiliated Cancer Hospital of Nanjing Medical University (Nanjing, China) from 2013 to 2015. Informed written consent for scientific use of biological material was obtained from each patient, and this study was approved by the Ethics Committee of Cancer Institute of Jiangsu Province. All patients’ clinical parameters, including age, gender, primary tumor size, lymph node status, TNM stage and histological differentiation were collected from their medical records.
Immunohistochemistry was performed to evaluate the clinical significance of FAM83D protein expression. Briefly, formalin-fixed, paraffin-embedded archival tissue from the 60 paired tissue samples were used. Staining was scored independently by two observers (including a pathologist) according to intensity and percentage of positive cells. The staining intensity was scored according to 4 grades: 0 (no staining), 1 (weak staining), 2 (moderate staining), or 3 (intense staining). The product (percentage of positive cells and respective intensity scores) was used as the final staining score (a minimum value of 0 and a maximum value of 300).
Statistical analysis
Student’s t test, chi-square test, log-rank test and Cox regression analysis were used to analyze the data using SPSS Statistics software (version 20.0, Chicago, Ill). P<0.05 was considered statistically significant.
Results
TCGA indicates that FAM83D is upregulated in LUAD and correlates with more aggressive clinical characteristics
According to an analysis of the TCGA_LUAD_exp_HiSeqV2-2015-02-24 dataset, the mean expression values of FAM83D is 7.901±0.05792 in LUAD tissues and 5.742±0.1299 in adjacent normal tissues (Figure 1A). Moreover, a correlation analysis in TCGA dataset showed that FAM83D was positively correlated with Ki-67 (r = 0.7114, P<0.0001, n = 511), a cell proliferation marker in LUAD tissues (Figure 1B). In 170 LUAD tissues with recorded DNA ploidy levels, higher FAM83D expression was found to be significantly correlated with higher DNA ploidy level (P<0.0001; Figure 1C), indicating that FAM83D expression might have a correlation with histological differentiation of the tumor.
Figure 1.
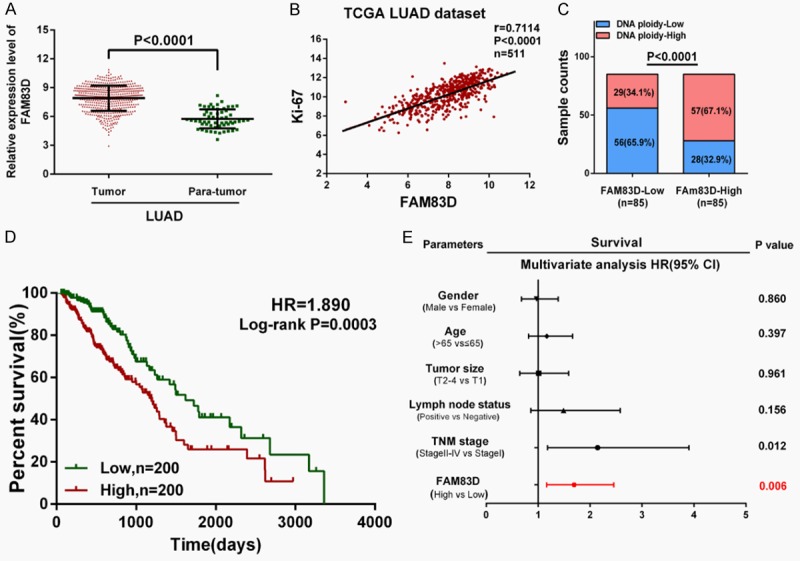
FAM83D is upregulated in LUAD tissues and correlates with more aggressive clinical characteristics in TCGA dataset. A. FAM83D is significantly upregulated in LUAD tissues compared with adjacent normal tissues (P<0.0001). B and C. FAM83D was found to be positively correlated with Ki-67 (r = 0.7114, P<0.0001, n = 511) and DNA ploidy (P<0.0001) in LUAD tissues. D. Kaplan-Meier survival analysis indicated that higher FAM83D expression is associated with worse overall survival in LUAD patients (HR = 1.890, P = 0.0003). E. Multivariate Cox regression analysis revealed that high expression of FAM83D was an independent risk factor for reduced overall survival in LUAD patients (HR = 1.692, P = 0.006).
Then, 400 LUAD patients with full-scale clinical information and follow-up data were extracted for further analysis. We designated the median expression value as a cutoff point, and the 400 LUAD patients were divided into two groups: the FAM83D-low group (n = 200) and the FAM83D-high group (n = 200). As shown in Table 2, chi-square test revealed that higher FAM83D mRNA expression was significantly correlated with male gender (P<0.0001), larger primary tumor size (P<0.0001), lymph node metastasis (P = 0.0049) and more advanced TNM stage (P<0.0001).
Table 2.
Correlation between FAM83D expression and clinical characteristics in TCGA LUAD dataset
| Characteristics | FAM83D-low cases | FAM83D-high cases | P value |
|---|---|---|---|
| Age at diagnosis (years) | 0.3164 | ||
| ≤65 | 89 | 99 | |
| >65 | 111 | 101 | |
| Sex | <0.0001* | ||
| Male | 71 | 114 | |
| Female | 129 | 86 | |
| Primary tumor size | <0.0001* | ||
| T1 | 83 | 44 | |
| T2 | 98 | 123 | |
| T3-4 | 19 | 33 | |
| Lymph node status | 0.0049* | ||
| Negative | 141 | 114 | |
| Positive | 59 | 86 | |
| Tumor stage | <0.0001* | ||
| I | 124 | 85 | |
| II | 49 | 54 | |
| III-IV | 27 | 61 |
Significant correlation.
The overall survival curve was plotted and the Cox regression analysis was used to evaluate the prognostic value of FAM83D in LUAD. Compared with the FAM83D-low group, the FAM83D-high group displayed poor OS (HR = 1.890, P = 0.0003; Figure 1D). As shown in Table 3, a multivariate Cox regression analysis further revealed that a high level of FAM83D mRNA expression was an independent risk factor for reduced overall survival in LUAD (HR = 1.692, 95% CI = 1.165-2.457, P = 0.006).
Table 3.
Cox regression analysis of overall survival in LUAD patients in TCGA dataset
| Characteristics | Univariate analysis | Multivariate analysis | ||||
|---|---|---|---|---|---|---|
|
|
|
|||||
| HR | P value | 95% CI | HR | P value | 95% CI | |
| Gender (Male vs Female) | 1.131 | 0.487 | 0.800-1.598 | / | / | / |
| Age (years) (>65 vs ≤65) | 0.985 | 0.931 | 0.695-1.395 | / | / | / |
| Primary tumor size (T2-4 vs T1) | 1.545 | 0.042* | 1.015-2.353 | 1.011 | 0.961 | 0.645-1.586 |
| Lymph node status (Positive vs Negative) | 2.810 | <0.001* | 1.974-3.999 | 1.489 | 0.156 | 0.859-2.579 |
| TNM stage (Stage II-IV vs Stage I) | 3.104 | <0.001* | 2.128-4.527 | 2.275 | 0.012* | 1.179-3.902 |
| FAM83D (High vs Low) | 1.921 | <0.001* | 1.338-2.760 | 1.692 | 0.006* | 1.165-2.457 |
Significant correlation.
Immunohistochemistry analysis
Immunohistochemistry (IHC) was performed to evaluate FAM83D protein expression in the LUAD tissues and adjacent normal tissues. As shown in Figure 2A and 2B, the FAM83D staining scores were significantly increased in the LUAD tissues (201.0±6.096) compared with adjacent normal tissues (91.17±6.861; P<0.0001). Consistent with the previously mentioned mRNA results, the FAM83D staining score was also significantly increased along with more advanced T stage, N stage and TNM stage in the LUAD tissues (Figure 2C-E). Moreover, as shown in Figure 2F and 2G, we observed that poorly differentiated LUAD samples showed higher FAM83D protein expression, compared with well-differentiated LUAD samples.
Figure 2.
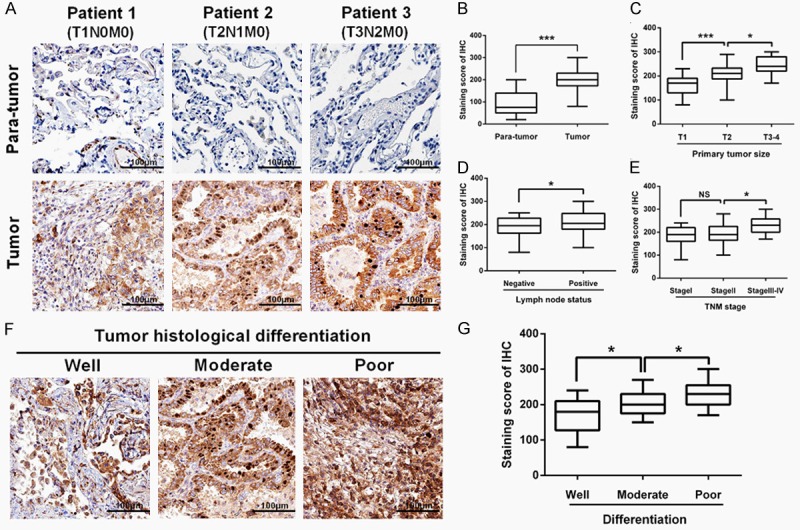
Immunohistochemistry analysis. A and B. The FAM83D staining score was significantly increased in LUAD tissues (201.0±6.096) compared with adjacent normal tissues (91.17±6.861). C-E. The FAM83D staining score was significantly increased along with more advanced T stage, N stage and TNM stage in LUAD tissues. F and G. Poorly differentiated LUAD samples showed higher FAM83D protein expression, compared with those well-differentiated LUAD samples. *P<0.05, **P<0.01, *** P<0.001, NS: No significance.
Knockdown of FAM83D inhibits LUAD cells proliferation, motility and induces cell cycle arrest in vitro
As shown in Figure 3A, FAM83D was widely upregulated in LUAD cell lines, and H1299 and A549 cell lines were chosen as appropriate cellular models for further investigation because of their highest expression of FAM83D. To investigate the biological function of FAM83D in vitro, two different effective siRNAs were used to knockdown FAM83D, and the transfection efficiency was measured by qRT-PCR and western blot (Figure 3B and 3C). As shown in Figure 3D, cell-counting kit 8 (CCK-8) assay revealed that knockdown of FAM83D markedly inhibited proliferation of both H1299 and A549 cells. Moreover, the si-FAM83D transfected group had significantly fewer colonies than the si-NC group (Figure 3E).
Figure 3.
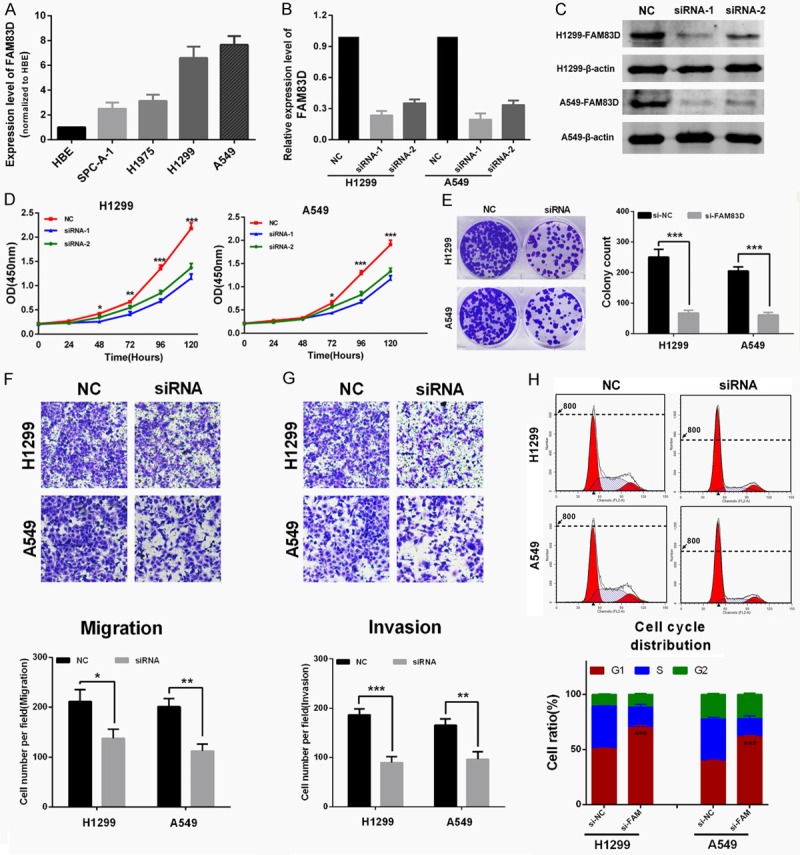
Knockdown of FAM83D inhibits LUAD cells proliferation, motility and induces cell cycle arrest in vitro. A. FAM83D was widely upregulated in LUAD cell lines. A549 and H1299 cell lines were chosen as appropriate cellular models for further investigation because they showed the highest expression. B and C. Two different effective siRNAs were used to knockdown FAM83D, and the transfection efficiency was measured by qRT-PCR and western blot. D. Knockdown of FAM83D inhibited both A549 and H1299 cell lines proliferation. E. Colony numbers of A549 and H1299 cells transfected with si-FAM83D were less than those transfected with si-NC. F and G. The transwell assay showed that the migration ability of H1299 and A549 cells was inhibited by siRNA-mediated knockdown of FAM83D, and the matrigel invasion assay yielded similar results. H. H1299 and A549 cells transfected with si-FAM83D exhibited more arrest at G1 phase than those transfected with si-NC. *P<0.05, **P<0.01, ***P<0.001.
The transwell assay showed that migration ability of H1299 and A549 cells was inhibited by siRNA-mediated knockdown of FAM83D (Figure 3F), and the matrigel invasion assay also yielded similar results (Figure 3G). Finally, the effect of FAM83D on cell cycle distribution was evaluated by flow cytometry analysis. As shown in Figure 3H, si-FAM83D treatment significantly increased the percentage of H1299 and A549 cells in G1 phase compared to si-NC (P<0.0001).
Silence of FAM83D suppresses tumor growth in vivo
To assess the oncogenic role of FAM83D in vivo, we established xenograft tumor models using A549 cells transfected with sh-NC and sh-FAM83D. All the nude mice developed xenograft tumors at the injection sites, and xenograft tumors were harvested forty days after injection (Figure 4A). As shown in Figure 4B and 4C, average volume and weight of tumors in the sh-FAM83D group were significantly lower than those in the sh-NC group. IHC analysis revealed that tumors derived from sh-FAM83D transfected cells showed weaker staining of Ki-67 than those in the NC group (Figure 4D). These data suggested that FAM83D might promote tumor growth in vivo.
Figure 4.
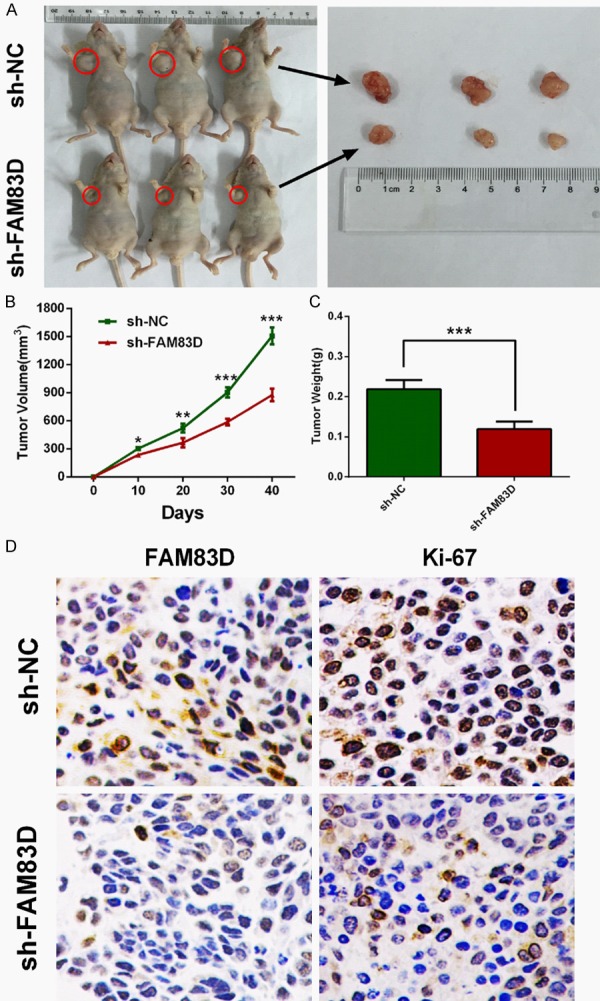
Knockdown of FAM83D inhibits tumor growth in vivo. A-C. Tumor nodules derived from sh-FAM83D-transfected A549 cells are significantly smaller than those in NC group. D. Immunohistochemistry showed that Ki-67 staining was weaker in sh-FAM83D group. *P<0.05, **P<0.01, ***P<0.001.
FAM83D exerts its oncogenic activity by regulating the cell cycle by influencing some critical cyclins
To explore how FAM83D exerts its oncogenic activity, a list of 191 genes that have highest correlation values with FAM83D were picked out from TCGA LUAD dataset. We then used GO and KEGG enrichment analysis on the 191 genes. As shown in Figure 5A, the two analyses yielded similar results. Most of the genes were enriched in the “cell cycle” pathway. The results indicated that FAM83D might play a pivotal role in the cell cycle.
Figure 5.
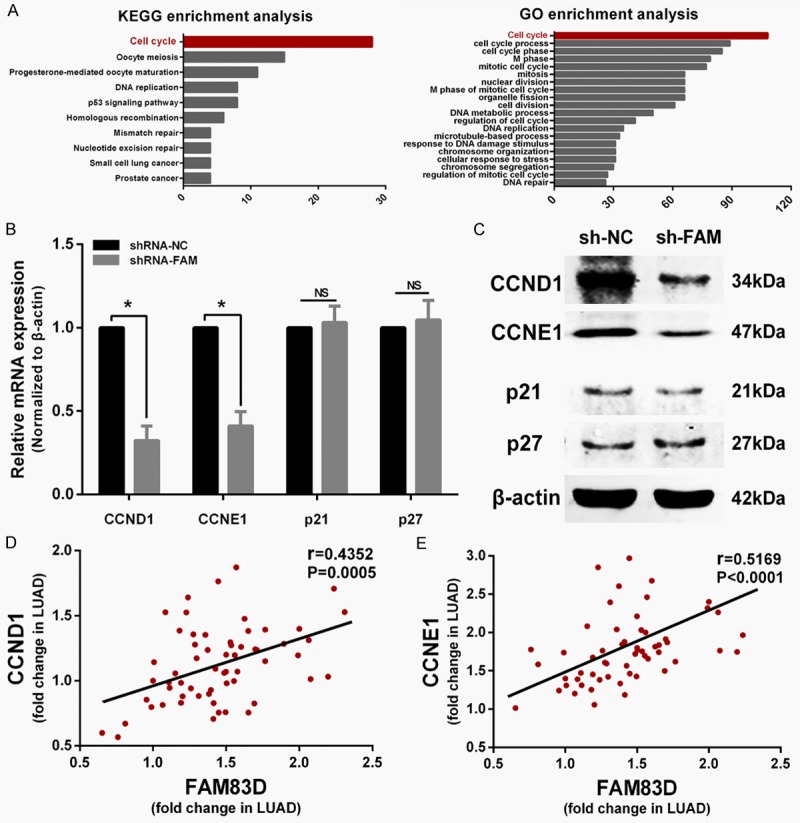
FAM83D regulates cell cycle progression by influencing CCND1 and CCNE1 expression. A. Genes co-expressed with FAM83D are enriched in the “cell cycle” pathway according to KEGG and GO enrichment analysis. B and C. qRT-PCR and western blot showed CCND1 and CCNE1 were significantly decreased in sh-FAM83D transfected cells, while p21 and p27 were not significantly altered. D and E. Pearson test showed that CCND1 and CCNE1 were both positively correlated with FAM83D in LUAD tissues. *P<0.05, NS: No significance.
Considering that knockdown of FAM83D induces G1 phase arrest in vitro, we sought to determine whether the expression levels of certain critical G1 phase genes or G1/S transition regulators, including CCND1, CCNE1, p21 and p27, were altered in sh-FAM83D cells. Compared with sh-NC transfected cells, qRT-PCR and western blot showed that both mRNA and protein expression levels of CCND1 and CCNE1 were significantly decreased in sh-FAM83D transfected cells, while p21 and p27 were not influenced (Figure 5B and 5C). Then, we measured the relative expression of FAM83D, CCND1 and CCNE1 in 60 LUAD samples using qRT-PCR. A correlation analysis of FAM83D with CCND1 and CCNE1 also confirmed that the expression of the two cyclins was positively correlated with FAM83D (P<0.0001; Figure 5D and 5E).
Then, pEGFP-N1-CCND1 and pEGFP-N1-CCNE1 plasmid was transfected into sh-FAM83D-treated A549 cells, respectively. Transfection efficiency was determined by qRT-PCR and western blot (Figure 6A). The xCELLigence system showed that the proliferation and colony formation abilities were partly recovered after CCND1 or CCNE1 was upregulated (Figure 6B and 6C). As shown in Figure 6D, oe-CCND1 (overexpression-CCND1) or oe-CCNE1 treatment significantly decreased the rate of sh-FAM83D-treated A549 cells arrested in G1 phase (P<0.01).
Figure 6.
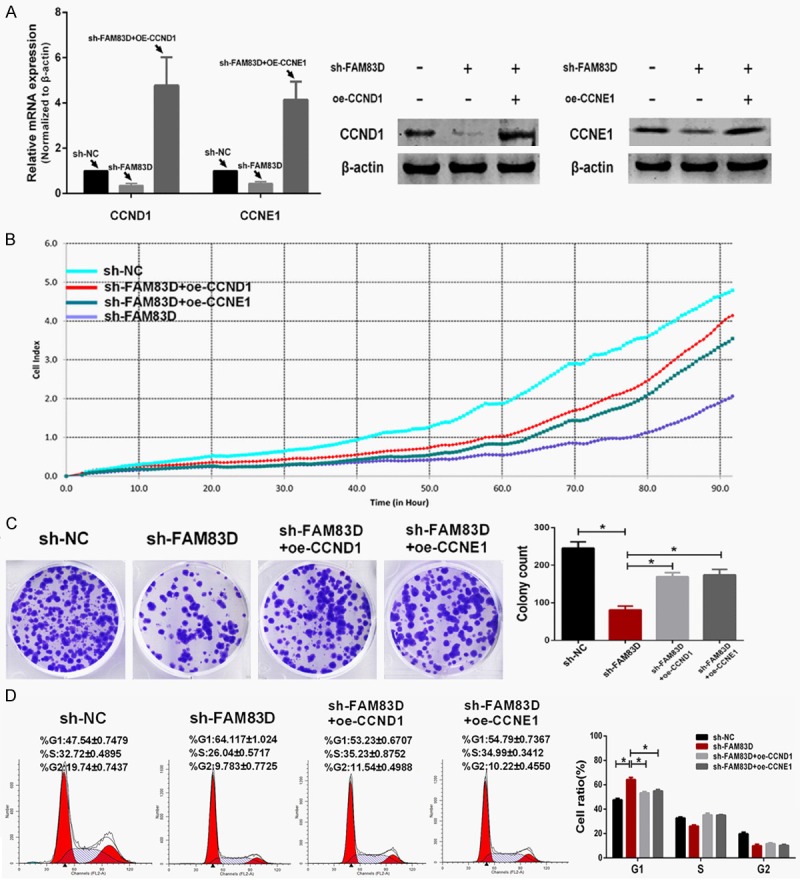
Upregulated expression of CCND1 or CCNE1 partly rescues the malignant phenotypes in FAM83D-knockdown cells. A. Transfection efficiency of upregulating CCND1 and CCNE1 was determined using qRT-PCR and western blot. B and C. Upregulation of either CCND1 or CCNE1 partly rescued the proliferative and colony formative abilities in FAM83D-knockdown cells. D. Upregulation of either CCND1 or CCNE1 alleviated the G1 phase arrest of FAM83D-knockdown cells. *P<0.01.
Discussion
FAM83D was first identified in a proteomic survey of the human spindle apparatus by Sauer G et al [7]. Later, Santamaria A et al reported that FAM83D represented a novel interaction partner of the chromokinesin KID, and the FAM83D-KID complex was required for chromosome congression and spindle maintenance [8]. Furthermore, Clark S et al reported that FAM83D promoted asymmetrical cortical localization of dynein and correct spindle orientation [19]. Dysfunction of spindle may lead to mitotic errors and aneuploidy, which correlates closely with carcinogenesis. All these studies indicated that FAM83D could play an important role in biological process.
Some microarray studies have suggested that FAM83D is upregulated in some cancers [3,12], and the oncogenic role of FAM83D has also been reported in breast cancer [13] and hepatocellular cancer [14]. In this study, we present the first evidence that upregulation of FAM83D occurs widely in LUAD and positively correlates with more advanced clinicopathological characteristics at both the mRNA and protein levels. Then we explored the prognostic value of FAM83D. A Kaplan-Meier analysis showed that LUAD patients with higher expression of FAM83D had a worse prognosis, and multivariate Cox regression analysis suggested that high expression of FAM83D was an independent risk factor for reduced overall survival in LUAD patients.
GO and KEGG enrichment analyses were then performed and yielded a similar result: The term “cell cycle” ranks first among FAM83D-related potential pathways. Consistent with this finding, experiments showed that suppression of FAM83D significantly inhibited cell proliferation via G1 phase arrest and weakened migration and invasion abilities of LUAD cells. We therefore measured several critical G1 phase genes or G1/S transition regulators to explore the potential mechanism. We found that CCND1 and CCNE1 expression were decreased by shRNA-mediated FAM83D knockdown, which was consistent with the result of Pearson test in LUAD samples. Cell cycle alteration is one of the hallmarks of cancer [20-22]. Moreover, CCND1 and CCNE1 are both critical G1 phase cyclins that control the existence of the G1 phase and the entrance into the S phase [23]. Therefore, rescue experiments were performed. We found that upregulated expression of CCND1 or CCNE1 in sh-FAM83D-treated A549 cells greatly increased proliferation and colony formation abilities, and alleviated arrest in the G1 phase. Thus, we concluded that FAM83D might regulate cell cycle progression via influencing CCND1 and CCNE1 expression during the G1 phase.
In conclusion, our study suggests that FAM83D is widely upregulated in LUAD tissues and correlates with more advanced clinicopathological characteristics and a worse prognosis. FAM83D can promote LUAD cell proliferation in vitro and in vivo. Moreover, FAM83D knockdown induces cell cycle arrest by downregulating CCND1 and CCNE1. These findings suggest that FAM83D plays an oncogenic role in LUAD and that FAM83D may serve as a potential therapeutic target and a novel prognostic biomarker in LUAD patients.
Acknowledgements
This study was supported by the Natural Science Foundation of Jiangsu Province (NO.BK2012482), National Natural Science Foundation of China (NO.81472702) and Jiangsu Provincial Special Program of Medical Science (NO.BL2012030).
Disclosure of conflict of interest
None.
Supporting Information
References
- 1.Chen W, Zheng R, Baade PD, Zhang S, Zeng H, Bray F, Jemal A, Yu XQ, He J. Cancer statistics in China, 2015. CA Cancer J Clin. 2016;66:115–132. doi: 10.3322/caac.21338. [DOI] [PubMed] [Google Scholar]
- 2.Youlden DR, Cramb SM, Baade PD. The International Epidemiology of Lung Cancer: geographical distribution and secular trends. J Thorac Oncol. 2008;3:819–831. doi: 10.1097/JTO.0b013e31818020eb. [DOI] [PubMed] [Google Scholar]
- 3.Ramakrishna M, Williams LH, Boyle SE, Bearfoot JL, Sridhar A, Speed TP, Gorringe KL, Campbell IG. Identification of candidate growth promoting genes in ovarian cancer through integrated copy number and expression analysis. PLoS One. 2010;5:e9983. doi: 10.1371/journal.pone.0009983. [DOI] [PMC free article] [PubMed] [Google Scholar]
- 4.Scotto L, Narayan G, Nandula SV, Arias-Pulido H, Subramaniyam S, Schneider A, Kaufmann AM, Wright JD, Pothuri B, Mansukhani M, Murty VV. Identification of copy number gain and overexpressed genes on chromosome arm 20q by an integrative genomic approach in cervical cancer: potential role in progression. Genes Chromosomes Cancer. 2008;47:755–765. doi: 10.1002/gcc.20577. [DOI] [PubMed] [Google Scholar]
- 5.Tsafrir D, Bacolod M, Selvanayagam Z, Tsafrir I, Shia J, Zeng Z, Liu H, Krier C, Stengel RF, Barany F, Gerald WL, Paty PB, Domany E, Notterman DA. Relationship of gene expression and chromosomal abnormalities in colorectal cancer. Cancer Res. 2006;66:2129–2137. doi: 10.1158/0008-5472.CAN-05-2569. [DOI] [PubMed] [Google Scholar]
- 6.Wullich B, Riedinger S, Brinck U, Stoeckle M, Kamradt J, Ketter R, Jung V. Evidence for gains at 15q and 20q in brain metastases of prostate cancer. Cancer Genet Cytogenet. 2004;154:119–123. doi: 10.1016/j.cancergencyto.2004.01.005. [DOI] [PubMed] [Google Scholar]
- 7.Sauer G, Korner R, Hanisch A, Ries A, Nigg EA, Sillje HH. Proteome analysis of the human mitotic spindle. Mol Cell Proteomics. 2005;4:35–43. doi: 10.1074/mcp.M400158-MCP200. [DOI] [PubMed] [Google Scholar]
- 8.Santamaria A, Nagel S, Sillje HH, Nigg EA. The spindle protein CHICA mediates localization of the chromokinesin Kid to the mitotic spindle. Curr Biol. 2008;18:723–729. doi: 10.1016/j.cub.2008.04.041. [DOI] [PubMed] [Google Scholar]
- 9.Durrbaum M, Storchova Z. Effects of aneuploidy on gene expression: implications for cancer. FEBS J. 2016;283:791–802. doi: 10.1111/febs.13591. [DOI] [PubMed] [Google Scholar]
- 10.Rajagopalan H, Lengauer C. Aneuploidy and cancer. Nature. 2004;432:338–341. doi: 10.1038/nature03099. [DOI] [PubMed] [Google Scholar]
- 11.Xu J, Huang L, Li J. DNA aneuploidy and breast cancer: a meta-analysis of 141,163 cases. Oncotarget. 2016 doi: 10.18632/oncotarget.11130. [Epub ahead of print] [DOI] [PMC free article] [PubMed] [Google Scholar]
- 12.Chang Q, Chen J, Beezhold KJ, Castranova V, Shi X, Chen F. JNK1 activation predicts the prognostic outcome of the human hepatocellular carcinoma. Mol Cancer. 2009;8:64. doi: 10.1186/1476-4598-8-64. [DOI] [PMC free article] [PubMed] [Google Scholar]
- 13.Wang Z, Liu Y, Zhang P, Zhang W, Wang W, Curr K, Wei G, Mao JH. FAM83D promotes cell proliferation and motility by downregulating tumor suppressor gene FBXW7. Oncotarget. 2013;4:2476–2486. doi: 10.18632/oncotarget.1581. [DOI] [PMC free article] [PubMed] [Google Scholar]
- 14.Wang D, Han S, Peng R, Wang X, Yang XX, Yang RJ, Jiao CY, Ding D, Ji GW, Li XC. FAM83D activates the MEK/ERK signaling pathway and promotes cell proliferation in hepatocellular carcinoma. Biochem Biophys Res Commun. 2015;458:313–320. doi: 10.1016/j.bbrc.2015.01.108. [DOI] [PubMed] [Google Scholar]
- 15.Goldman M, Craft B, Swatloski T, Cline M, Morozova O, Diekhans M, Haussler D, Zhu J. The UCSC Cancer Genomics Browser: update 2015. Nucleic Acids Res. 2015;43:D812–817. doi: 10.1093/nar/gku1073. [DOI] [PMC free article] [PubMed] [Google Scholar]
- 16.Huang DW, Sherman BT, Tan Q, Kir J, Liu D, Bryant D, Guo Y, Stephens R, Baseler MW, Lane HC, Lempicki RA. DAVID Bioinformatics Resources: expanded annotation database and novel algorithms to better extract biology from large gene lists. Nucleic Acids Res. 2007;35:W169–175. doi: 10.1093/nar/gkm415. [DOI] [PMC free article] [PubMed] [Google Scholar]
- 17.Sherman BT, Huang da W, Tan Q, Guo Y, Bour S, Liu D, Stephens R, Baseler MW, Lane HC, Lempicki RA. DAVID Knowledgebase: a gene-centered database integrating heterogeneous gene annotation resources to facilitate high-throughput gene functional analysis. BMC Bioinformatics. 2007;8:426. doi: 10.1186/1471-2105-8-426. [DOI] [PMC free article] [PubMed] [Google Scholar]
- 18.Yang X, Zhang Z, Qiu M, Hu J, Fan X, Wang J, Xu L, Yin R. Glypican-5 is a novel metastasis suppressor gene in non-small cell lung cancer. Cancer Lett. 2013;341:265–273. doi: 10.1016/j.canlet.2013.08.020. [DOI] [PubMed] [Google Scholar]
- 19.Clark S, Nyarko A, Lohr F, Karplus PA, Barbar E. The Anchored Flexibility Model in LC8 Motif Recognition: Insights from the Chica Complex. Biochemistry. 2016;55:199–209. doi: 10.1021/acs.biochem.5b01099. [DOI] [PMC free article] [PubMed] [Google Scholar]
- 20.Hanahan D, Weinberg RA. The hallmarks of cancer. Cell. 2000;100:57–70. doi: 10.1016/s0092-8674(00)81683-9. [DOI] [PubMed] [Google Scholar]
- 21.Hunter T, Pines J. Cyclins and cancer. Cell. 1991;66:1071–1074. doi: 10.1016/0092-8674(91)90028-w. [DOI] [PubMed] [Google Scholar]
- 22.Krasnoselsky AL, Whiteford CC, Wei JS, Bilke S, Westermann F, Chen QR, Khan J. Altered expression of cell cycle genes distinguishes aggressive neuroblastoma. Oncogene. 2005;24:1533–1541. doi: 10.1038/sj.onc.1208341. [DOI] [PubMed] [Google Scholar]
- 23.Massague J. G1 cell-cycle control and cancer. Nature. 2004;432:298–306. doi: 10.1038/nature03094. [DOI] [PubMed] [Google Scholar]
Associated Data
This section collects any data citations, data availability statements, or supplementary materials included in this article.


