

Abstract
Objective: The present study aims to investigate whether RAGE promotes the calcification of human arterial smooth muscle cells (HASMCs) and determine the relationshipbetween RAGE and the Wnt/β-catenin signaling pathway in this process. Method: In this study,there were four groups, namelythe blank control group, the non-transfection group, the empty vector group, and the RAGE transfection group.Cells were co-cultured with 10 mmol/L β-glycerophosphoric acid, pyruvate and 20 mg/L AGE. The expression of osteogenic proteins in each group before and after the intervention wasdetected using Western blotting. Short interfering RNA (siRNA) targeting β-catenin was used toinhibitthe expression of β-catenin. HASMCs cultured under normal conditions were usedas the blank control. Results: (1) High RAGE expression was successfully induced in HASMCs according to the results of GFP detection, flow cytometry and Western blotting. (2) Compared with the blank control group, non-transfection group and empty vector group, RAGE transfection enhanced the calcification of cells when incubated with calcification medium plus AGE. (3) The expression of RAGE, β-catenin, OPG and Cbfa1 proteins in the blank control group, empty vector group and RAGE transfection group wasnot significantly enhanced after intervention. However, expression of the proteins in the RAGE transfection group was much higher than those of the other groups. (4) Compared with the RAGE transfection group and control siRNA group, the cells transfected with β-catenin siRNA and cultured with interventional drugs showed significant inhibition of the expression of the downstream Cbfa1 and OPG genes. Conclusion: Increased expression of RAGE promoted calcification in HASMCs and up regulated the β-catenin, OPG and Cbfa1 genes. RAGE may activate the downstream genes via the Wntβ-catenin pathway, thereby promoting HASMC differentiation into osteogenic cells and calcification.
Keywords: AGE (advanced glycation end product), β-catenin, medial artery calcification, HASMCs (human aortic smooth muscle cells)
Introduction
Arterial calcification is a type of pathological lesion caused by the deposition of calcium salt in the aortic wall. It is associated with a variety of diseases, including atherosclerosis, hypertension, nephropathy, diabetes and vascular injury [1-4]. Arterial calcification is an actively regulated process [5] in which hormones, enzymes, cytokines and proteins play a role. However, the pathogenic and developmentalpathwaysremain unclear. Arterial calcification is classified as intimal calcification ormedial artery calcification (MAC), depending on the site of calcification. The latter is also known as Mönckeberg’s arteriosclerosis, which involvesdegenerative lesions resulting from unknown causes. MAC mainly occurs in diabetes and uremia and presents with dystrophic calcification of the tunica media [6-7]. Recognized as a condition associated with diabetes, chronic renal failure and atherosclerosis, MAC can be prevented, reversed and actively regulated in its early stages as in bone development.
The AGE/RAGE axis and Wnt/β-catenin signaling pathway are closely associated with phenotypic transformation and MAC of vascular smooth muscle cells (VSMCs) [8], but little is known about themolecular pathways involved. In the present study, the overexpression of RAGE was induced in human arterial smooth muscle cells (HASMCs) using adenoviral vector-mediated gene transfer. The expression of components of the Wnt/β-catenin signaling pathway and osteogenic proteins and the degree of calcification were determined by Western blotting and flow cytometry and by Von Kossa staining, respectively. The role of RAGE in promoting the calcification of HASMCs and the differentiation of HASMCs into osteogenic phenotypesis discussed. β-catenin expression was silenced by siRNAto analyze the interaction between RAGE and the Wnt/β-catenin signaling pathway.
Materials and methods
Culture of HASMCs
Cryopreservation tubes were stored at -80°C and quickly placed into a 37°C water bath for thawing. The cells were thawed after 1 min ofgentle shaking. After disinfection with 75% alcohol, the tube was placed on anultraclean bench that had been subjected to ultraviolet disinfection for 1 h. The cell suspension was transferred to acentrifuge tube, and 8 ml of culture medium was added. The cells were dispersed by gentle blowing and then centrifuged at 800 rpm for 5 min, and the supernatant was discarded. The cells were diluted with culture medium, blown gently and transferred into the culture flask. They were cultured in an incubator, and the culture medium was replaced every two days.
When the cells fully coatedthe culture flask walls, the culture medium was removed, and the cells were washed with PBS. Approximately 2 ml of trypsin was added to the culture flask. The cells were observed with an inverted phase contrast microscope at room temperature, avoiding cell contamination. When the cells retracted and the intercellular space was enlarged, digestion was terminated by the addition of fetal bovine serum. The culture flask was rotated gently, and the residual digestion liquid was removed. Culture medium was added, and the adherent cells were gently blown off the walls to form a cell suspension. Next, the cells were inoculated intothe culture flask, and culture medium was added. The cell density was maintained at 1.5×10 cells/ml, and the culture medium was replaced every 3 days.
Cell morphology
The cells were observed to be spindle-shaped or polygonal with aninverted phase contrast microscope. After reaching confluence, the cells presented a parallel arrangement, either in a radial pattern or in bundles. Thisistypical of the “crest-trough” pattern of SMCs.
Induction of high levels of stable RAGE and detection of RAGE expression
RAGE expression was induced in HASMCs using adenoviral vectors. As verified by detecting the expression of GFP and by Western blotting, RAGE was highly expressed in HASMCs. RAGE was provided by Guangzhou Fulengen Co., Ltd. The gene sequence was searched on NCBI (GenBank: AY755619.1, ORF1215 bp).
HASMCs were transfected with adenoviral vectors carrying GFP. The green fluorescence was observed withan inverted fluorescence microscope 96 h following transfection. Transfected cells were identified using 4 μg/ml puromycin because these cells are resistant to puromycin. When the expression of GFP was greater than 90%, the cells were subjected to Western blotting.
Modeling of diabetes-related calcification
Preliminary experiments determined that the calcification of VSMCs was enhanced with calcification medium plus AGE compared with calcification medium alone. Therefore, HASMCs were co-cultured with 10 mmol/L β-glycerophosphoric acid, pyruvate and 20 mg/L AGE in all experimental groups for 8-10 d to induce diabetes-related calcification.
Western blotting
The expression of RAGE, β-catenin, Cbfa1, OPG and ALP was detected by Western blotting, as described previously. The gel was prepared, and the electrophoresis tank was filled with 1× electrophoresis buffer. The starting voltage was 80 V. After the dye entered the separating gel, the voltage was switched to 120 V. When the dye reached the bottom of separating gel after approximately 80 min, the power was cut,and the proteins were transferred to the membrane. Then, the membrane was placed on filter paper, and the front face was identified. After drying for several minutes at room temperature, the PDVF membrane was blockedwith defatted milk powder. The membranewas placed on a shaker at room temperature for 1 h and stood overnight at 4°C, with the front of the membrane facing upwards. Primary antibodies were diluted with the sealing buffer and incubated with the membrane on a shaker for 2 h (the front of the membrane facing upwards). The membrane was washed with TBS-T buffer three times, for 5-10 min each time. The secondary antibodies were diluted with TBS-T buffer (1:600 dilution) and incubated with the membrane on a shaker at room temperature for 1.5 h (the front of the membrane facing upwards). The membrane was then washed with TBS-T buffer three times, for 5-10 min each time. The blot was developed, and the molecular weight and net optical density of the target bands were analyzed with Quantity One Software.
Detection of GFP expression in HASMCs by flow cytometry after transfection
The culture medium in the RAGE transfection group, empty vector group and blank control group was removed, and the cells were washed twice with PBS buffer. After trypsin digestion, culture medium was added, and the adherent cells were gently blown off the walls with a sterile pipette. The resulting cell suspension was loaded into a 2 ml round-bottom centrifuge tube and centrifuged at 1500 rpm for 5 min with the supernatant discarded. The cells were mixedwith 500 μl of precooled PBS bufferby gentle blowing. Then, the cells were subjected to flow cytometry.
Silencing of β-catenin expression by siRNA
siRNA targeting β-cateninwas purchased from Guangzhou Fulengen Co., Ltd. The gene sequence of β-catenin was found on NCBI-gene name CTNNB1, mRNA accession No. NM_001904, and gene ID 1499. One day prior to transfection, HASMCs were inoculated into 24-well plates, and the cells reached 70-90% confluence within 24 h. Then, 20 pmol β-catenin siRNA was added to 50 μl of serum-free DMEM with gentle mixing. One microliterof Lipofectamine was diluted with 50 μl of serum-free high-glucose DMEM andthen incubated with the cells at room temperature for approximately 5 min. The diluted β-catenin siRNA was mixed with RNAi-Mate reagent. Then, the cells were incubatedat room temperature for approximately 20 min to form a β-catenin siRNA/Lipofectamine complex, and 100 μl of thecomplex was added to HASMCs. The culture plate was gently shaken to fully mix the culture medium with the β-catenin siRNA. The cells with β-catenin siRNA were placed into a CO2 incubator at 37°C, and the medium was replaced 6 h later. Successfully transfected cells were identified by green fluorescence observed 24 h after transfection using a fluorescence microscope.
Determination of intracellular calcium concentration
The intracellular calcium concentration was determined using a spectrophotometer at 570 nm. Using a pipette, 800 ul of the buffer was transferred to another 1 ml cuvette, and 100 ul of the reaction solution was added. Then, 100 μl of the standard solution or samples to be determined was added, mixed well and incubated for 5 min. Absorbance was measured with a spectrophotometer. The standard curve was plotted with the optical density (OD) on the y axis and the standard calcium concentration (mmol/L) on the x axis. The corresponding calcium concentration was obtained from the standard curve using the following formula: calcium concentration (mmol/L) × dilution factor of the sample=mmol/L.
Results
Culture of HASMCs
Figure 1A shows the HASMCs cultured under normal conditions (90% DMEM high glucose+10% fetal bovine serum). The cells were spindle-shaped or polygonal under the inverted phase contrast microscope. After reaching confluence, the cells were arranged in bundles or in a radial pattern, which conformed to the “crest-trough” pattern typical of SMCs. The cells of the 8-10th generation were harvested.
Figure 1.
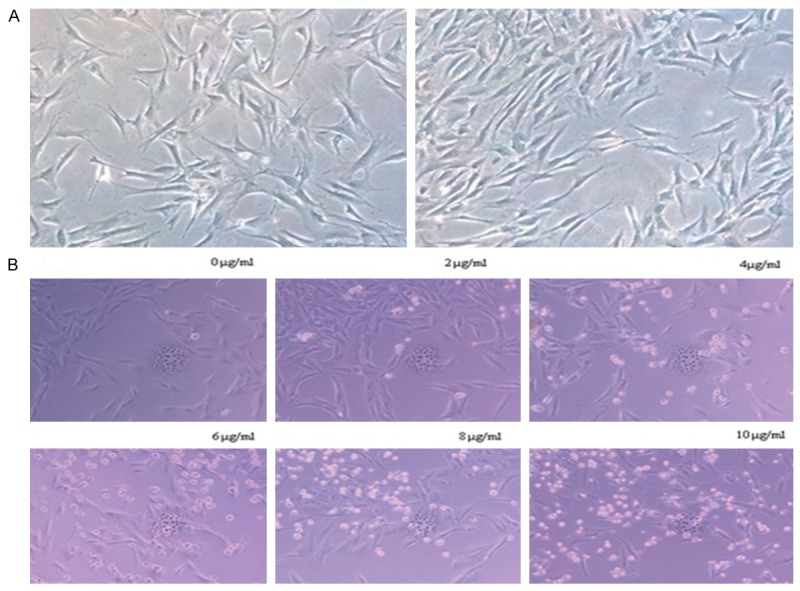
A: HASMCs were spindle-shaped or polygonal under the inverted phase contrast microscope. After reaching confluence, the “crest-trough” pattern of cell arrangement was observed. B: Cell apoptosis induced after 3 d by puromycin atdifferent concentrations observed withaninverted phase contrast microscope (×200).
Screening with puromycin atdifferent concentrations
Normal HASMCs were identified using fresh culture medium containing increasing concentrations of puromycin (0 μg/ml, 2 μg/ml, 4 μg/ml, 6 μg/ml, 8 μg/ml, 10 μg/ml). The culture medium containing puromycin was replaced every 2-3 days, and cell apoptosis was observed with a microscope for 6 consecutive days. There were almost no apoptotic cells at 6 d in the 0 μg/ml treatment group; a small amount of normal cells were found at 6 d in the 2 μg/ml treatment group; all cells were apoptotic at 3-4 d in the 4 μg/ml treatment group; in the 6 μg/ml treatment group, all cells were apoptotic at 2-3 d, and in the 8 μg/ml and 10 μg/ml treatment groups, all cells were apoptotic at 1-2 d. Therefore, the minimal concentration forwhich all cells were apoptotic within 3-5 d was 4 μg/ml; this was used as the concentration for subsequent screening (Figure 1B).
Induction of RAGE expression in HASMCs
HASMCs were transfected with an adenoviral vector carrying the RAGE gene or an empty vector. Successfully transfectedhost cells expressed GFP (Figure 2).
Figure 2.
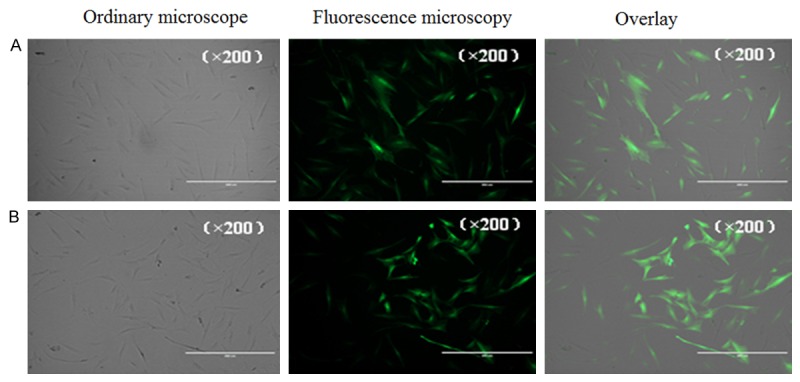
GFP expression in the transfected cells in each group as seen with the fluorescence microscope. A: Empty vector group; B: Transfected with an adenoviral vector carrying RAGE group.
The percentage of GFP-positive cells was calculated with a fluorescence microscope and was approximately 50% in both the empty vector group and the RAGE transfection group. Puromycin screening was performed 4 d after transfection with 4 μg/ml puromycin. After 5-6 d, the non-transfected normal cells were usedas the blank control, and the percentage of GFP-positive cells was determined using flow cytometry. The percentage was over 90% GFP-positive in both the empty vector group and the RAGE transfection group. Specifically, the percentage was <1%, 95.4% and 95.5% in the blank control group, empty vector group and RAGE transfection group, respectively, as shown in Figure 3 (Part 1).
Figure 3.

Part 1: Flow cytometry results in the blank control group, empty vector group and RAGE transfection group. A: Blank control group; B: Empty vector group; C: Transfected with adenoviral vector carrying RAGE group. Part 2: Expression of RAGE in each group withWestern blotting. Compared with the blank control group, P>0.05 in the empty vector group and P<0.05 in the RAGE transfection group. *P>0.05, **P<0.05. A: Empty vector group; B: Transfected with adenoviral vector carrying RAGE group.
As shown in Figure 3 (Part 2), the cells were cultured in medium containing 2 μg/ml puromycin and passaged. Some cells were cryopreserved. Proteins were extracted in the blank control group, empty vector group and RAGE transfection group and analyzed by Western blotting. RAGE expression in the RAGE transfection group was greatly enhanced compared with the blank control group and empty vector group. RAGE expression in the blank control group and the empty vector group was similar. These results indicated that robust RAGE expression was successfully induced by transfection, and the likelihoodof changes in RAGE expression induced by the adenoviral virus itself was very small.
Normal HASMCs were usedas the blank control. For the non-transfection group, empty vector group and RAGE transfection group, cells were co-cultured with 10 mmol/L β-glycerophosphoric acid, pyruvate and 20 mg/L AGE for 10 d. Cell growth and calcification were observed using an inverted phase contrast microscope. Von Kossa staining and calcium quantification were performed for each group at 10 d. The RAGE transfection group had obviously enlarged nuclei at 5 d with calcification medium plus AGE; small depositions of calcium were also observed. At 10 d, massive calcium deposits were seen. In the non-transfection group and empty vector group, some nuclei began to enlarge at 5 d under the conditions of calcification medium plus AGE. However, calcium deposits were not obvious. At 10 d, massive calcium deposition was observed with the microscope, but it was less severe compared with the RAGE transfection group, as shown in Figure 4 (Part 1). Von Kossa staining and calcium quantification were performed at 10 d. Compared with that in the blank control group, non-transfection group and empty vector group, the calcium deposition in the RAGE transfection group was enhanced greatly; the degree of calcium deposition was similar in the non-transfection group and empty vector group; Figure 4 (Part 2).
Figure 4.
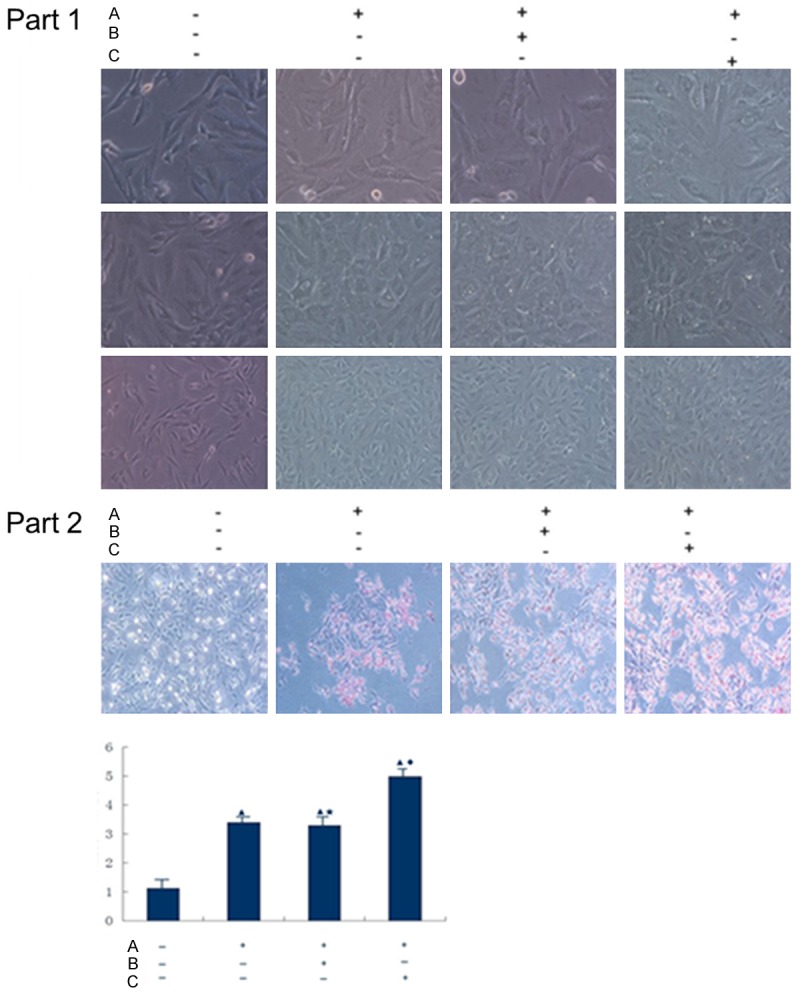
Part 1: Calcium deposition in each group under the inverted phase contrast microscope (indicated by white bright spots). A: Co-cultured with 10 mmol/L β-glycerophosphoric acid, pyruvate and 20 mg/L AGE; B: Empty vector group; C: Transfected with adenoviral vector carrying RAGE group. Part 2: In Von Kossa staining, calcium deposition was indicated by red or light pink color after counterstaining in nuclear fast red. As seen inthe figure, calcium deposition was most prominent in the RAGE transfection group, and the non-transfection group and empty vector group had similar calcium deposition. The blank control group showed almost no calcium deposition. During calcium quantification, ▲P<0.01 compared with the blank control group; ★P>0.05 compared with the non-transfection group; ♦P<0.02 compared with the empty vector group. A: Co-cultured with 10 mmol/L β-glycerophosphoric acid, pyruvate and 20 mg/L AGE; B: Empty vector group; C: Transfected with adenoviral vector carrying RAGE group.
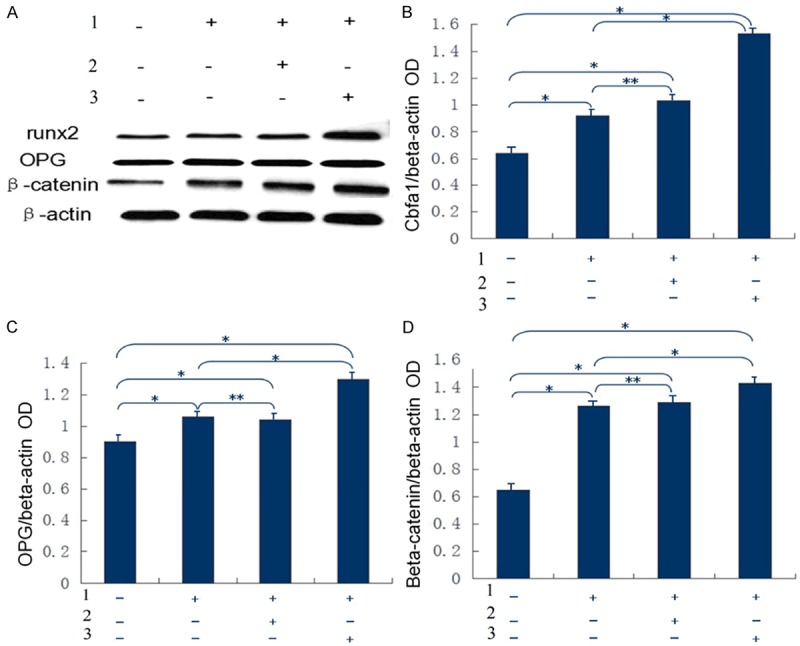
As shown in Figure 5, the normal HASMCs were usedas the blank control group. The cells in the blank control group, empty vector group and RAGE transfection group were co-cultured with 10 mmol/L β-glycerophosphoric acid, pyruvate and 20 mg/L AGE. The expression of osteogenic proteins before and after intervention in each group wasdetected using Western blotting. The results indicated that the expression of RAGE, β-catenin, OPG and Runx2 proteins was enhanced in the three groups after intervention. The expression of these proteins in the RAGE transfection group asfar higher than thatof the other groups. Similar levels of these proteins were seenin the blank control group and empty vector group either before or after the intervention. This further suggestedthat the adenoviral vector itself exerted little impact on the experiment.
Figure 5.
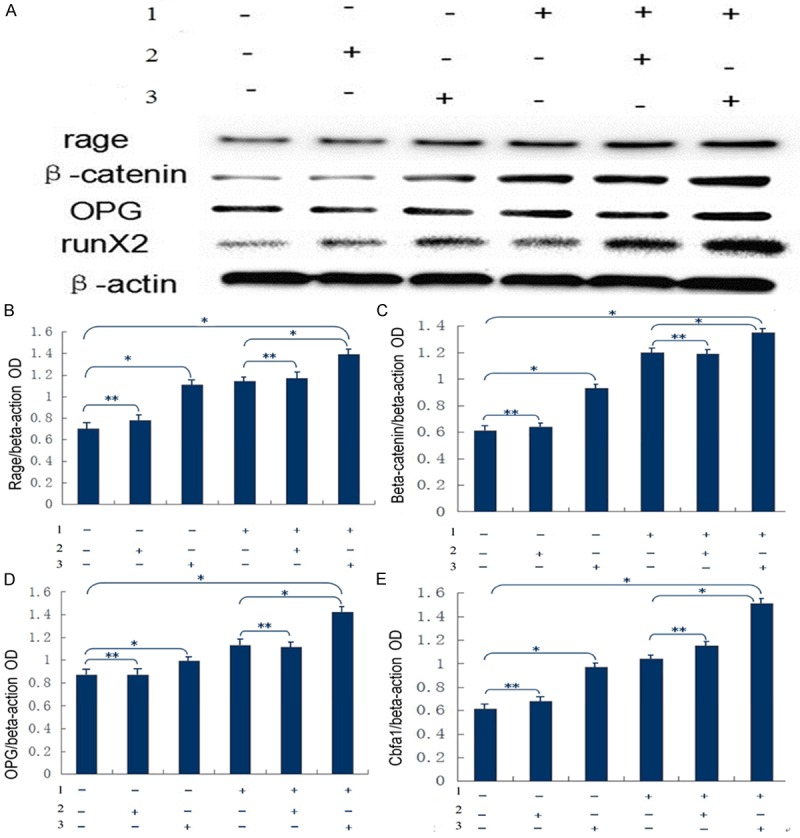
A: Expression of osteogenic factors in each group during Western blotting. B: Expression of RAGE. Compared with the blank control group, P<0.02 in the RAGE transfection group before and after intervention, and P>0.05 in the empty vector group; compared with the non-transfection group, P<0.02 in RAGE transfection group after intervention, and P>0.05 in the empty vector group after intervention. *P<0.02, **P>0.05. C: Expression of β-catenin. Compared with the blank control group, P<0.02 in the RAGE transfection group before and after intervention, and P>0.05 in the empty vector group. Compared with the non-transfection group after intervention, P<0.02 in RAGE transfection group after intervention, and P>0.05 in the empty vector group after intervention. *P<0.02, **P>0.05. D: Expression of OPG. Compared with the blank control group, P<0.05 in the RAGE transfection group before and after intervention, and P>0.05 in the empty vector group; compared with non-transfection group after intervention, P<0.05 in the RAGE transfection group after intervention, and P>0.05 in the empty vector group after intervention. *P<0.05, **P>0.05. E: Expression of Cbfa1 (Runx2). Compared with the blank control group, P<0.02 in the RAGE transfection group before and after intervention, and P>0.05 in the empty vector group; compared with the non-transfection group after intervention, P<0.02 in the RAGE transfection group after intervention, and P>0.05 in the empty vector group after intervention. *P<0.02, **P>0.05. 1: Co-cultured with 10 mmol/L β-glycerophosphoric acid, pyruvate and 20 mg/L AGE; 2: Empty vector group; 3: Transfected with adenoviral vector carrying RAGE group.
To exclude the influence of the adenovirus on theexpression of cytokines during transfection before siRNA inhibition, the expression of β-catenin, OPG and Runx2 were detected by Western blotting in each group. The expression of these proteins wasenhanced in all experimental groups compared with the blank control group. The expression of RAGE in the RAGE transfection group was far greater than that of other groups, and the expression of RAGE was similar in the non-transfection group and empty vector group after intervention (Figure 6). Therefore, the adenovirus had very little impact on the expression of cytokines.
Figure 6.
A: Shows the results of Western blotting analysis of β-catenin, OPG and Runx2 proteins in four groups. B is the expression of Cbfa1 (i.e., Runx2). Compared with the blank control group, P<0.05 in the non-transfection group, empty vector group and RAGE transfection group; compared with the non-transfection group after intervention, P>0.05 in the empty vector group after intervention, and P<0.05 in the RAGE transfection group after intervention. *P<0.05, **P>0.05. C: Expression of OPG. Compared with the blank control group, P<0.05 in the non-transfection group, empty vector group and RAGE transfection group; compared with the non-transfection group after intervention, P>0.05 in the empty vector group, and P<0.05 in the RAGE transfection group. *P<0.05, **P>0.05. D: Expression of β-catenin. Compared with the blank control group, P<0.05 in the non-transfection group, empty vector group and RAGE transfection group after intervention; compared with the non-transfection group after intervention, P>0.05 in the empty vector group after intervention, and P<0.05 in the RAGE transfection group. *P<0.05, **P>0.05. 1: Co-cultured with 10 mmol/L β-glycerophosphoric acid, pyruvate and 20 mg/L AGE; 2: Empty vector group; 3: Transfected with adenoviral vector carrying RAGE group.
Next, siRNA was added to cell culturesof each of the four groups, namely, blank control group, RAGE transfection group, control siRNA group and β-catenin siRNA group. The expression of OPG and Runx2 was detected using Western blotting, and the results showed that the expression of Runx2 and OPG decreased in RAGE-transfected cells after incubation with β-catenin siRNA. Expression of these proteins was similar between the control siRNA group and RAGE transfection group, but they were enhanced compared with the blank control group (Figure 7).
Figure 7.
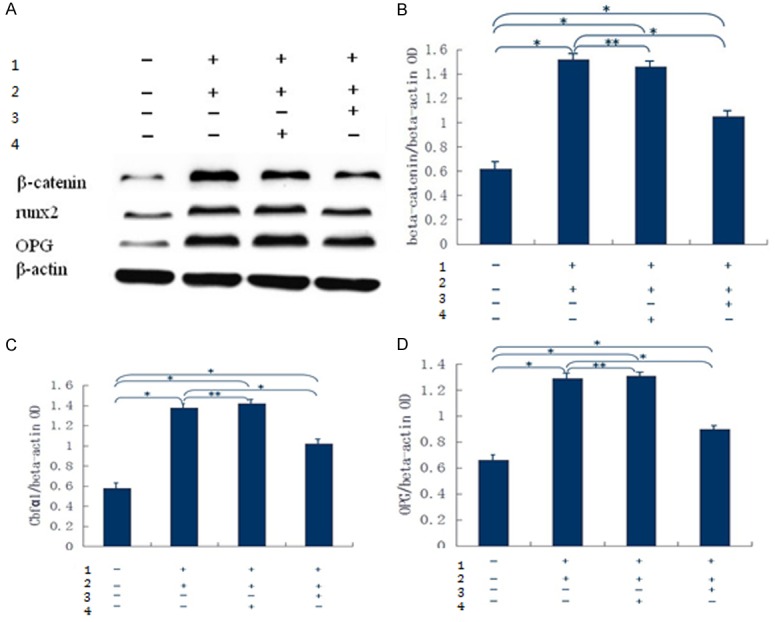
A: Expression of Runx2 and OPG in each group withWestern blotting. B: Expression of β-catenin. Com- pared with the blank control group, P<0.05 in the RAGE transfection group, control siRNA group and β-catenin siRNA group; compared with the RAGE transfection group, P>0.05 in the control siRNA group, and P<0.05 in the β-catenin siRNA group. *P<0.05, **P>0.05. C: Expression of Cbfa1 (i.e., Runx2). Compared with the blank control group, P<0.05 in the RAGE transfection group, control siRNA group and β-catenin siRNA group; compared with the RAGE transfection group, P>0.05 in the control siRNA group, and P<0.05 in the β-catenin siRNA group. *P<0.05, **P>0.05. D: Expression of OPG. Compared with the blank control group, P<0.05 in the RAGE transfection group, control siRNA group and β-catenin siRNA group. Compared with the RAGE transfection group, P>0.05 in the control siRNA group, and P<0.05 in the β-catenin siRNA group. *P<0.05, **P>0.05. 1: Co-cultured with 10 mmol/L β-glycerophosphoric acid, pyruvate and 20 mg/L AGE; 2: Transfected with adenoviral vector carrying RAGE group; 3: β-catinie siRNA; 4: siRNA control.
Discussion
RAGE, a member of the immunoglobulin superfamily, is the most studied receptor of AGE. We induced high RAGE expression in HASMCs by adenoviral vector-mediated gene transfer, followed by intervention with 10 mmol/L β-glycerophosphoric acid, pyruvate and 20 mg/L AGE. It was determinedthat the RAGE transfection group had a significant increase of both calcium deposition and calcium content compared with the blank control group, non-transfection group and empty vector group. Thus, MAC was promoted via the AGE/RAGE axis, and AGE induced the calcification of HASMCs through the RAGE receptor.
VSMCs make up a large proportion ofthe middle layer of arteries, and HASMCs are mainly derived from the phenotypic transformation of SMCs. An in vitro experimentshowed that small nodules were formed after the apoptosis of VSMCs, followed by calcification. The SMC-derived apoptotic bodies were the matrix vesicles involved in the calcification process [9]. An increasing body of evidence shows that ectopic MAC is an actively regulated mineralization similar to that in bones and teeth. The key transcription factor Cbfa1, which is associated with osteoblast differentiation, also plays a role in the development of cartilage and bones. Auxology studies indicate that both osteoblasts and theirprecursors can express Cbfa1 [10,11]. Therefore, it is important to detect the presence of Cbfa1 in the calcified SMCs.
We found that Cbfa1 expression was clearlyenhanced in HASMCs transfected with RAGE when cultured in calcification medium plus AGE. Meanwhile, OPG, an important factor in bone metabolism, was also substantiallyupregulated. OPG is a vascular regulatory factor associated with atherosclerosis and aortic calcification. Compared with non-transfected cells, RAGE-transfected cells had much higher expression of Cbfa1 and OPG. It was inferred that the HASMCs possessed osteoblast-like properties after induction with AGE and calcification medium. With the increase of RAGE, the expression of osteogenic factors was enhanced. Based on these results, we speculate that the AGE/RAGE signaling pathway is related to the phenotypic transformation of HASMCs into osteoblasts.
The Wnt/β-catenin signaling pathway in SMCs is closely associated with MAC. Both Rajamannan et al. [12] and Shao et al. [13,14]reported evidence of activation of Wnt/β-catenin at sites of cardiovascular calcification. A mouse model of diabetes was treated with the Wnt inhibitor DKK1, and inhibition was seen in aortic calcification induced by TNF-α and in the activation of genes downstream of Wnt/β-cateninas well asfactors related to early osteogenesis [15]. Aortic calcification and sclerosis in the mouse model of diabetes can be alleviated by inhibiting the Wnt/β-catenin signaling pathway. As a result, the expression of downstream Col1A1, Cbfa1 and Nox1 was also inhibited [16]. Al-Aly et al. [15] also found that diabetes-related MAC shared many similarities with calcification induced by chronic renal failure in terms of mechanism, with both showing an upregulation of Wnt3a and Wnt7a in the aortic wall.
In our experiment, both transfected cells and non-transfected cells showed the upregulation of β-catenin expression compared with the blank control group. This further confirmed the role of Wnt/β-catenin signaling pathway in the phenotypic transformation and calcification of HASMCs.
As described above, the expression of several osteogenic factors was enhanced in both RAGE-transfected cells and non-transfected cells after incubation with AGE plus the calcification medium. The increase in expression was more significant in the RAGE-transfected cells. To clarify the connection between the AGE/RAGE and Wnt/β-catenin pathway, the expression of β-catenin was silenced by β-catenin siRNA, and the cells were incubated with AGE plus the calcification medium. As a result, the expression of Cbfa1 and OPG decreased, withsimilar expression in the control siRNA group as in the RAGE transfection group. Therefore, siRNA had a negligible effect, and the increase in Cbfa1 and OPG expression and SMC calcification induced by the upregulation of RAGE was reversed by inhibiting β-catenin. In other words, the AGE/RAGE axis either directly or indirectly regulates the Wnt/β-catenin signaling pathway, leading to the phenotypic transformation and calcification of VSMCs. However, whether the AGE/RAGE axis acts by directly affecting the downstream genes of the Wnt/β-catenin signaling pathway remains unknown.
Acknowledgements
This work supported by National Natural Science Foundation of China (No.81270358).
References
- 1.Wu SS, Lin X, Yuan LQ, Liao EY. The Role of Epigenetics in Arterial Calcification. Biomed Res Int. 2015;2015:320849. doi: 10.1155/2015/320849. [DOI] [PMC free article] [PubMed] [Google Scholar]
- 2.Kitrou P, Parthipun A, Diamantopoulos A, Paraskevopoulos I, Karunanithy N, Katsanos K. Targeted True Lumen Re-Entry With the Outback Catheter: Accuracy, Success, and Complications in 100 Peripheral Chronic Total Occlusions and Systematic Review of the Literature. J Endovasc Ther. 2015;22:538–545. doi: 10.1177/1526602815594249. [DOI] [PubMed] [Google Scholar]
- 3.Yiu AJ, Callaghan D, Sultana R, Bandyopadhyay BC. Vascular Calcification and Stone Disease: A New Look towards the Mechanism. J Cardiovasc Dev Dis. 2015;2:141–164. doi: 10.3390/jcdd2030141. [DOI] [PMC free article] [PubMed] [Google Scholar]
- 4.Nitta K, Ogawa T. Vascular calcification in end-stage renal disease patients. Contrib Nephrol. 2015;185:156–167. doi: 10.1159/000380980. [DOI] [PubMed] [Google Scholar]
- 5.Orita Y, Yamamoto H, Kohno N, Sugihara M, Honda H, Kawamata S, Mito S, Soe NN, Yoshizumi M. Role of osteoprotegerin in arterial calcification: development of new animal model. Arterioscler Thromb Vasc Biol. 2007;27:2058–2064. doi: 10.1161/ATVBAHA.107.147868. [DOI] [PubMed] [Google Scholar]
- 6.Zhou YB, Zhang J, Cai Y, Teng X, Duan XH, Song JQ, Du J, Tang CS, Qi YF. Insulin resistance induces medial artery calcification in fructose-fed rats. Exp Biol Med (Maywood) 2012;237:50–57. doi: 10.1258/ebm.2011.011252. [DOI] [PubMed] [Google Scholar]
- 7.Ballanti P, Silvestrini G, Pisanò S, De Paolis P, Di Giulio S, Mantella D, Iappelli M, Favarò A, Bonucci E, Coen G. Medial artery calcification of uremic patients: a histological, histochemical and ultrastructural study. Histol Histopathol. 2011;26:191–200. doi: 10.14670/HH-26.191. [DOI] [PubMed] [Google Scholar]
- 8.Menini S, Iacobini C, Ricci C, Blasetti Fantauzzi C, Salvi L, Pesce CM, Relucenti M, Familiari G, Taurino M, Pugliese G. The galectin-3/RAGE dyad modulates vascular osteogenesis in atherosclerosis. Cardiovasc Res. 2013;100:472–480. doi: 10.1093/cvr/cvt206. [DOI] [PubMed] [Google Scholar]
- 9.Proudfoot D, Skepper JN, Hegyi L, Farzaneh-Far A, Shanahan CM, Weissberg PL. The role ofapoptosis in the initiation of vascular calcification. Z Kardiol. 2001;90:43–46. doi: 10.1007/s003920170041. [DOI] [PubMed] [Google Scholar]
- 10.Ducy P, Zhang R, Geoffroy V, Ridall AL, Karsenty G. Osf2/Cbfa1: a transcriptional activator of osteoblast differentiation. Cell. 1997;89:747–754. doi: 10.1016/s0092-8674(00)80257-3. [DOI] [PubMed] [Google Scholar]
- 11.Kim IS, Otto F, Zabel B, Mundlos S. Regulation of chondrocyte differentiation by Cbfa1. Mech Dev. 1999;80:159–170. doi: 10.1016/s0925-4773(98)00210-x. [DOI] [PubMed] [Google Scholar]
- 12.Rajamannan NM, Subramaniam M, Caira F, Stock SR, Spelsberg TC. Atorvastatin inhibits hypercholesterolemia-induced calcification in the aortic valves via the Lrp5 receptor pathway. Circulation. 2005;112:1229–1234. doi: 10.1161/01.CIRCULATIONAHA.104.524306. [DOI] [PMC free article] [PubMed] [Google Scholar]
- 13.Shao JS, Cheng SL, Pingsterhaus JM, Charlton-Kachigian N, Loewy AP, Towler DA. Msx2 promotes cardiovascular calcification by activating paracrine Wnt signals. J Clin Invest. 2005;115:1210–1220. doi: 10.1172/JCI24140. [DOI] [PMC free article] [PubMed] [Google Scholar]
- 14.Cheng SL, Shao JS, Halstead LR, Distelhorst K, Sierra O, Towler DA. Activation of vascular smooth muscle parathyroid hormone receptor inhibits Wnt/beta-catenin signaling and aortic fibrosis in diabetic arteriosclerosis. Circ Res. 2010;107:271–282. doi: 10.1161/CIRCRESAHA.110.219899. [DOI] [PMC free article] [PubMed] [Google Scholar]
- 15.Al-Aly Z, Shao JS, Lai CF, Huang E, Cai J, Behrmann A, Cheng SL, Towler DA. Aortic Msx2-Wnt calcification cascade is regulated by TNF-alpha-dependent signals in diabetic Ldlr-/- mice. Arterioscler Thromb Vasc Biol. 2007;27:2589–2596. doi: 10.1161/ATVBAHA.107.153668. [DOI] [PubMed] [Google Scholar]
- 16.Cheng SL, Shao JS, Halstead LR, Distelhorst K, Sierra O, Towler DA. Activation of vascular smooth muscle parathyroid hormone receptor inhibits Wnt/beta-catenin signaling and aortic fibrosis in diabetic arteriosclerosis. Circ Res. 2010;107:271–282. doi: 10.1161/CIRCRESAHA.110.219899. [DOI] [PMC free article] [PubMed] [Google Scholar]