

ABSTRACT
Human immunodeficiency virus (HIV)- and simian immunodeficiency virus (SIV)-specific CD8+ T cells are typically largely excluded from lymphoid B cell follicles, where HIV- and SIV-producing cells are most highly concentrated, indicating that B cell follicles are somewhat of an immunoprivileged site. To gain insights into virus-specific follicular CD8+ T cells, we determined the location and phenotype of follicular SIV-specific CD8+ T cells in situ, the local relationship of these cells to Foxp3+ cells, and the effects of CD8 depletion on levels of follicular SIV-producing cells in chronically SIV-infected rhesus macaques. We found that follicular SIV-specific CD8+ T cells were able to migrate throughout follicular areas, including germinal centers. Many expressed PD-1, indicating that they may have been exhausted. A small subset was in direct contact with and likely inhibited by Foxp3+ cells, and a few were themselves Foxp3+. In addition, subsets of follicular SIV-specific CD8+ T cells expressed low to medium levels of perforin, and subsets were activated and proliferating. Importantly, after CD8 depletion, the number of SIV-producing cells increased in B cell follicles and extrafollicular areas, suggesting that follicular and extrafollicular CD8+ T cells have a suppressive effect on SIV replication. Taken together, these results suggest that during chronic SIV infection, despite high levels of exhaustion and likely inhibition by Foxp3+ cells, a subset of follicular SIV-specific CD8+ T cells are functional and suppress viral replication in vivo. These findings support HIV cure strategies that augment functional follicular virus-specific CD8+ T cells to enhance viral control.
IMPORTANCE HIV- and SIV-specific CD8+ T cells are typically largely excluded from lymphoid B cell follicles, where virus-producing cells are most highly concentrated, suggesting that B cell follicles are somewhat of an immunoprivileged site where virus-specific CD8+ T cells are not able to clear all follicular HIV- and SIV-producing cells. To gain insights into follicular CD8+ T cell function, we characterized follicular virus-specific CD8+ T cells in situ by using an SIV-infected rhesus macaque model of HIV. We found that subsets of follicular SIV-specific CD8+ T cells are able to migrate throughout the follicle, are likely inhibited by Foxp3+ cells, and are likely exhausted but that, nonetheless, subsets are likely functional, as they express markers consistent with effector function and show signs of suppressing viral replication in vivo. These findings support HIV cure strategies that increase the frequency of functional follicular virus-specific CD8+ T cells.
INTRODUCTION
In the absence of combination antiretroviral therapy (cART), the majority of human immunodeficiency virus (HIV)-infected individuals experience persistent high-level viral replication that results in progressive loss of CD4+ T cells, AIDS, and eventually death. During chronic HIV and simian immunodeficiency virus (SIV) infections, the vast majority of virus-producing cells are CD4+ T cells located in secondary lymphoid tissues (1–3). Within secondary lymphoid tissues, virus-producing cells are most concentrated within B cell follicles (4–8). When the frequency of virus-producing cells within follicles and extrafollicular compartments was adjusted for the frequency of target cells (i.e., either CD4+ or CD4+ Ki67+ cells), there was still a significantly higher concentration of SIV-producing cells in B cell follicles than in extrafollicular regions of the spleen, lymph nodes, and gut-associated lymphoid tissues (6). In rhesus macaques undergoing long-term, fully suppressive cART, residual SIV infection is also preferentially localized in B cell follicles (9). In addition, follicular dendritic cells (FDCs) within mature B cell follicles hold onto extracellular virions (2, 10), and FDC-bound virions are potently infectious to CD4+ T cells (11).
Numerous studies indicate that CD8+ cytotoxic T lymphocytes (CTL) play a key role in controlling HIV and SIV infections both in vitro (12, 13) and in vivo. For example, the development of HIV-specific CD8+ T cells during acute infection coincides with a decrease in plasma viremia (14, 15). Ratios of effector CD8+ T cells to virus-infected cells in lymphoid and genital tissues in vivo correlate with reductions in viral load (16), and levels of SIV-specific CD8+ T cells in lymphoid compartments predict levels of SIV-producing cells in those compartments (6). Furthermore, disease progression is associated with diminished HIV- and SIV-specific CD8+ T cell responses (17–19). Elite control of HIV is associated with specific major histocompatibility complex (MHC) class I alleles and polyfunctional CTL responses (20–23). In addition, HIV and SIV mutate virally encoded CTL epitopes to evade HIV- and SIV-specific CD8+ T cell responses (24, 25). Perhaps the most powerful evidence that CTL are important in controlling HIV and SIV infections comes from experiments in which CD8+ cells were temporarily depleted in rhesus macaques during chronic SIV infection (26–29), which led to as much as 1,000-fold increases in plasma viremia, and the subsequent recovery of CD8+ cells led to decreased viremia (26). Nevertheless, HIV- and SIV-specific CD8+ T cells are not able to fully suppress all viral replication or prevent disease progression.
We and others previously showed that HIV- and SIV-specific CD8+ T cells are typically most concentrated in T cell zones outside B cell follicles in lymph node and spleen tissues and are largely excluded from follicles (5, 6, 30, 31). Thus, B cell follicles appear to be somewhat of an immunoprivileged site in which virus-specific CD8+ T cells are not able to clear all virus-producing cells. The relatively low levels of follicular virus-specific CD8+ T cells can be explained by a lack of expression of the follicular homing molecule CXCR5 on most lymphoid CD8+ T cells (6). In addition to numerical deficiencies of follicular virus-specific CD8+ T cells, there likely exist other factors that may inhibit follicular virus-specific CD8+ T cell function.
It makes sense evolutionarily for B cell follicles to be immunoprivileged sites in order to prevent unwanted CD8+ T cell cytolytic activity within follicles, which might lead to a decreased ability of B cells to make antibodies. Follicular CD8+ T cells might primarily serve to provide help to CD4+ T follicular helper cells (TFH cells) or B cells. In support of this thesis, we previously reported that many SIV-specific CD8+ T cells downmodulate CD8 upon entering B cell follicles (32), and Xu et al. found that CD8low SIV-specific T cells show impaired function (33). In addition, we frequently observe SIV-specific CD8+ T cells in contact with B cells, with their cell membranes intertwined (our unpublished data), and Quigley et al. showed that isolated follicular CD8+ T cells supported IgG production in tonsillar B cells to some extent (34). Thus, many follicular SIV-specific CD8+ T cells may downmodulate cytolytic function in favor of providing help to B cells to produce SIV-specific antibodies.
There is also evidence that at least some follicular CD8+ T cells likely maintain cytolytic function. For example, we found that subsets of follicular SIV-specific CD8+ T cells express the cytolytic enzymes granzyme B and perforin, indicating that some follicular CD8+ T cells have the capacity for cytolytic function (6). Furthermore, we found that levels of SIV-specific CD8+ T cells inversely correlated with levels of SIV RNA+ cells in follicular and extrafollicular compartments of lymph nodes, suggesting a suppression of follicular virus-producing cells by virus-specific CD8+ T cells in vivo (6).
In this study, to gain further insights into follicular virus-specific CD8+ T cells, we determined the location and phenotype of follicular SIV-specific CD8+ T cells in situ, the local relationship of these cells to Foxp3+ cells, and the effects of CD8 depletion on levels of follicular SIV-producing cells in SIV-infected rhesus macaques. We hypothesize that subsets of follicular SIV-specific CD8+ T cells evade suppression by T regulatory cells (Tregs), evade functional exhaustion, display an effector memory phenotype, and can suppress follicular viral replication in vivo. Our findings support this hypothesis and further support HIV cure strategies that increase the frequency of functional follicular virus-specific CD8+ T cells.
MATERIALS AND METHODS
Tissues from chronically SIV-infected animals.
Lymph nodes and spleens were obtained from captive-bred rhesus macaques of Indian origin chronically infected with either SIVmac239 or SIVmac251. Five animals were inoculated intravaginally with SIVmac251, six were inoculated rectally with SIVmac239, and four were inoculated intravenously with SIVmac239. Two animals (animals R03094 and R01106) had <200 CD4+ T cells/mm3 (Table 1). All animals were housed and cared for according to American Association for Accreditation of Laboratory Animal Care standards in accredited facilities. All animal procedures were performed according to protocols approved by the Institutional Animal Care and Use Committees of the Wisconsin National Primate Research Center and the University of Minnesota. Portions of fresh lymphoid tissues were immediately snap-frozen in OCT and/or formalin fixed and embedded in paraffin. For animals with MHC class I alleles known to restrict SIV-specific CD8+ T cells, portions of fresh lymphoid tissue were also collected in RPMI 1640 medium with sodium heparin (18.7 U/ml) and shipped overnight to the University of Minnesota for in situ tetramer staining. Four rhesus macaques (rh2515, rh2516, rh2520. and rh2588) in the early chronic phase of SIVmac239 infection (59 days postinfection) received 50 mg/kg anti-CD8 monoclonal antibody (MAb) MT-87R1 (Nonhuman Primate Reagent Resource, Boston, MA) to deplete CD8+ cells.
TABLE 1.
Characteristics of rhesus macaques included in the present study
| Macaque ID | Days postinfection | MHC genotypea and peptide | Virus | Plasma SIV RNA concn (log10 copies/ml) | Route of SIV infectionb | Phenotypee |
|||
|---|---|---|---|---|---|---|---|---|---|
| Ki67 | Perforin | Foxp3 | PD-1 | ||||||
| Rh2515 | 42 | A01 Gag-CM9 | SIVmac239 | 4.22 | IV | ND | − | + | + |
| Rh2516 | 42 | A01 Gag-CM9 | SIVmac239 | 5.55 | IV | + | ND | + | + |
| Rh2520 | 42 | A01 Gag-CM9 | SIVmac239 | 7.58 | IV | + | ND | + | + |
| Rh2306 | 84 | A01 Gag-CM9 | SIVmac239 | 6.15 | R | − | + | − | − |
| R03111 | 105 | A02 Nef-YY9 | SIVmac239 | 6.45 | R | − | + | − | − |
| R03094c | 154 | A01 Gag-CM9 | SIVmac239 | 6.20 | R | − | + | − | − |
| R03116 | 161 | A01 Gag-CM9 | SIVmac239 | 3.78 | R | − | + | − | − |
| 11-57 | 258 | A01 Gag-CM9 | SIVmac251 | 4.51 | V | +d | + | − | + |
| 11-45 | 272 | A01 Gag-CM9 | SIVmac251 | 6.26 | V | ND | + | + | + |
| JD85 | 272 | A01 Gag-CM9 | SIVmac251 | 4.56 | V | +d | ND | + | + |
| 11-89 | 349 | A01 Gag-CM9 | SIVmac251 | 5.15 | V | +d | + | + | + |
| 11-061 | 545 | A01 Gag-CM9 | SIVmac251 | 3.72 | V | +d | ND | + | + |
| Rhax18c | 546 | B08 Nef-RL10 | SIVmac239 | 4.97 | R | +d | + | − | + |
| R01106 | 567 | B08 Env-KL9 | SIVmac239 | 4.73 | R | +d | + | − | − |
| Rhau10 | 1,687 | B08 Nef-RL10 | SIVmac239 | 4.11 | IV | − | + | − | − |
Full MHC allele names are as follows: A01, Mamu-A1*001:01; A02, Mamu-A1*002:01; and B08, Mamu-B*008:01.
IV, intravenous; R, rectal; V, vaginal.
The animal had <200 CD4+ T cells/mm3.
Quantitative image analysis was done with both lymph node and splenic tissues.
−, there were not enough follicles in stained tissue sections for quantitative image analysis; ND, not done.
In situ tetramer staining combined with immunohistochemistry.
In situ tetramer staining combined with immunohistochemistry was performed on fresh lymph tissue specimens that were shipped overnight, sectioned with a Compresstome instrument (35), and stained essentially as previously described (5, 6, 36). Biotinylated MHC class I monomers were loaded with peptides (National Institutes of Health Tetramer Core Facility, Emory University, Atlanta, GA) and converted to MHC class I tetramers. Mamu-A1*001 molecules were loaded with the SIV Gag CM9 (CTPYDINQM) peptide (37) or the irrelevant negative-control peptide FV10 (FLPSDYFPSV) from the hepatitis B virus core protein, Mamu-B*008 molecules were loaded with the Nef RL10 (RRHRILDIYL) (38) and Env KL9 (KRQQELLRL) (38) peptides, and Mamu-A1*002 monomers were loaded with the Nef YY9 (YTSGPGIRY) peptide (39). Fresh lymph node and spleen tissue sections were incubated with MHC class I tetramers (0.5 μg/ml) alone or along with goat anti-human PD-1 polyclonal antibodies (Abs) (1 μg/ml; R&D Systems). For secondary incubations, sections were incubated with rabbit anti-fluorescein isothiocyanate (anti-FITC) Abs (0.5 μg/ml; BioDesign, Saco, ME) and mouse anti-human Ki67 Abs (1:500 dilution; clone MM1 [Vector]), mouse anti-human perforin Abs (0.1 μg/ml; clone 5B10 [Novacastra]), mouse anti-human Foxp3 Abs (2.5 μg/ml; clone 206D [BioLegend]), or mouse anti-human CD20 Abs (0.19 μg/ml; clone L26 [Novocastra]). For tertiary incubations, the sections stained with goat anti-human PD-1 Abs were incubated with Cy3-conjugated donkey anti-rabbit Abs (0.3 μg/ml; Jackson ImmunoResearch Laboratories, West Grove, PA), Alexa 488-conjugated donkey anti-goat Abs (0.75 μg/ml; Jackson ImmunoResearch Laboratories), and Cy5-conjugated donkey anti-mouse Abs (0.3 μg/ml; Jackson ImmunoResearch Laboratories). All other sections were incubated with Cy3-conjugated goat anti-rabbit Abs (0.3 μg/ml; Jackson ImmunoResearch Laboratories), Alexa 488-conjugated goat anti-mouse Abs (0.75 μg/ml; Molecular Probes), and Dylight 649-conjugated goat anti-human IgM (0.3 μg/ml; Jackson ImmunoResearch Laboratories). Sections were imaged using an Olympus FluoView 1000 microscope. Confocal z-series were collected from ∼6 μm from the surface of the section to 35 to 45 μm into the tissue. Montage images of multiple areas of 800 by 800 pixels were created and used for analysis.
Quantitative image analysis.
For determinations of levels of SIV-specific CD8+ T cells and percentages of SIV-specific CD8+ T cells that coexpressed specific molecules, follicular areas were identified morphologically as clusters of brightly stained closely aggregated CD20+ or IgM+ cells. Follicular and extrafollicular areas were delineated using Olympus FluoView 1000 software. Areas that showed loosely aggregated B cells that were ambiguous as to whether the area was a follicle were not included. Quantification of MHC tetramer-stained cells within germinal center (GC) and non-GC areas was performed on sections stained with IgM and Ki67 antibodies, with IgM antibody staining used to delineate follicles and Ki67 antibody staining used to delineate GC areas of follicles. GC delineation was done only in the studies that included Ki67 antibody staining. For PD-1 expression analysis, follicular regions were analyzed in an average of 174 tetramer+ cells (range, 46 to 313 cells), and extrafollicular regions were analyzed in 445 tetramer+ cells (range, 120 to 883 cells). For quantification of tetramer+ cells that were in contact with Foxp3+ cells and expressed Foxp3+, follicular regions were analyzed in an average of 271 tetramer+ cells (range, 100 to 486 cells), and extrafollicular regions were analyzed in 294 tetramer+ cells (range, 119 to 498 cells). For perforin expression level analysis, follicular regions were analyzed in an average of 107 tetramer+ cells (range, 22 to 300 cells), and extrafollicular regions were analyzed in 201 tetramer+ cells (range, 82 to 389 cells). To determine levels of perforin expression, tetramer+ cells were scored using the following objective criteria. Tetramer+ cells with no detectable perforin staining above background levels were scored as perforin negative. Tetramer+ cells with perforin staining 2 to 3 times higher than the background level were scored as having low levels of perforin, those with perforin staining 4 to 9 times higher than the background level were scored as having medium levels, and those with perforin staining ≥10 times higher than the background level and with perforin staining detectable throughout much of the cytoplasm were scored as having high levels. Cell counts were done on single z-scans. While doing the cells counts, we stepped up and down through the z-scans to distinguish tops and bottoms of cells from nonspecific background staining and demarcated cells by use of a software tool to avoid counting the same cell twice. Quantitative image analyses of PD-1, Foxp3, and perforin staining were done with lymph node tissues, while quantitative image analysis of Ki67 staining was done with both lymph node and splenic tissues. An average of 1.97 mm2 (range, 1.19 to 2.64 mm2) was analyzed for each lymph node, and an average of 2.82 mm2 (range, 1.67 to 3.98 mm2) was analyzed for each spleen.
In situ hybridization combined with immunohistochemistry.
In situ hybridization for detection of SIV RNA was performed as previously described (4, 6). This technique identifies cells that are actively transcribing SIV but not extracellular virions encapsulated in envelope glycoprotein and bound to FDC. Briefly, 6-μm frozen sections were fixed in 3% paraformaldehyde (Sigma-Aldrich, St. Louis, MO), hybridized overnight with digoxigenin-labeled SIVmac239 antisense probes (Lofstrand Labs, Gaithersburg, MD), and visualized using nitroblue tetrazolium (NBT)/5-bromo-4-chloro-3-indolyl phosphate (Roche, Nutley, NJ). Immunohistochemistry staining for B cells was performed with the same tissues, using mouse anti-human CD20 (clone 7D1; AbD Serotec, Raleigh, NC) and detection with horseradish peroxidase (HRP)-labeled polymer anti-mouse IgG (ImmPress kit; Vector Laboratories, Burlingame, CA) and Vector NovaRed substrate (Vector Laboratories). SIV RNA+ cells were counted by visual inspection and classified as either inside or outside B cell follicles, which were identified morphologically as a cluster of CD20+ cells as previously described (4, 6). The total tissue area and the area of follicles were determined by quantitative image analysis (Qwin Pro, version 3.4.0; Leica, Cambridge, United Kingdom) and used to calculate the frequency of SIV+ cells per square millimeter. An average area of 49.3 mm2 (4.7 mm2 to 95.2 mm2) was analyzed.
Statistical analysis.
All statistical analyses assumed two-sided tests with a significance level of 0.05. Count data were analyzed using generalized linear mixed models that would accommodate within-subject correlation, overdispersion (negative binomial with log link), and an offset for total cells or area, as appropriate. Simple linear regression was used for modeling log10 viral load. Perforin expression on tetramer+ cells was analyzed using repeated-measures ordinal (proportional odds) logistic regression (40–42), with standard errors estimated via bootstrapping. SAS, version 9.3 (Cary, NC), R (43), and GraphPad Prism 6.0 software was used. Because there were only four animals in the CD8 depletion study, statistics were not performed.
RESULTS
SIV-specific CD8+ T cells can migrate into GCs.
Although HIV- and SIV-specific CD8+ T cells are typically most concentrated in T cell zones of lymphoid tissues, some localize inside lymphoid B cell follicles (5, 6). Within B cell follicles, HIV- and SIV-specific CD8+ T cells are typically distributed near the borders of follicles adjacent to the T cell zone (5, 6). In addition, more than 50% of the follicular area is devoid of HIV- and SIV-specific CD8+ T cells in most follicles (5, 6). These findings led us to wonder whether virus-specific CD8+ T cells are restricted to certain areas of the follicle or are able to migrate throughout the follicular area, including the GC, where FDCs hold viruses in immune complexes and presumably actively infect passing CD4+ T cells.
To address this question, we used MHC class I tetramers to stain SIV-specific CD8+ T cells in situ in lymph node tissue sections from SIV-infected rhesus macaques (Table 1). We counterstained tissue sections with antibodies directed against IgM to label B cell follicles and with antibodies directed against Ki67 to label proliferating cells and to allow us to delineate GCs. We found that within follicles, tetramer+ SIV-specific CD8+ T cells were located both inside and outside GCs (Fig. 1A). They were present at similar levels inside and outside the GC area of B cell follicles (P = 0.85), and as anticipated, they were present at significantly lower levels in follicles than in extrafollicular regions (Fig. 1B) (P < 0.0001). Thus, although there are typically relatively small numbers of SIV-specific CD8+ T cells within B cell follicles, these cells can migrate throughout the follicles, including the GC.
FIG 1.

SIV-specific CD8+ T cells can migrate throughout B cell follicles, including germinal centers (GCs). (A) Representative lymph node section stained with Mamu-A1*001/Gag CM9 tetramers to label SIV-specific CD8+ T cells (red; indicated with arrows in the enlargement), with IgM antibodies (blue) to define follicles (F), and with Ki67 antibodies (green) to label the GC. Confocal images were collected with a 20× objective. Bar, 100 μm. (B) Frequencies of tetramer+ SIV-specific CD8+ T cells in different compartments of the lymph nodes and spleen during chronic SIV infection. Data for samples from the spleen are indicated in red, whereas all other data are for lymph nodes. There were no significant differences between frequencies of tetramer+ SIV-specific CD8+ T cells in GC and non-GC follicular areas (P = 0.85). Frequencies of extrafollicular tetramer+ SIV-specific CD8+ T cells were 109% (95% confidence interval [CI], 60 to 172%) higher than the frequencies of tetramer+ SIV-specific CD8+ T cells in the GC (P < 0.0001) and 104% (95% CI, 56 to 166%) higher than those in the non-GC follicular areas (P < 0.0001). (C) Relationship between frequencies of follicular and extrafollicular tetramer+ SIV-specific CD8+ T cells. The frequency of extrafollicular tetramer+ SIV-specific CD8+ T cells predicted the frequency of follicular tetramer+ SIV-specific CD8+ T cells. For every 1-log10 increase in extrafollicular tetramer+ SIV-specific CD8+ T cells, there was an estimated 1.14-log10 (95% CI, 0.86- to 1.42-log) increase in the frequency of follicular tetramer+ SIV-specific CD8+ T cells (P = 0.0001). After adjusting for extrafollicular tetramer+ SIV-specific CD8+ T cells, tissue type (lymph node or spleen) was not a significant predictor of follicular tetramer+ SIV-specific CD8+ T cells (P = 0.39). (D) Relationship between frequencies of GC and extrafollicular tetramer+ SIV-specific CD8+ T cells. The frequency of extrafollicular tetramer+ SIV-specific CD8+ T cells predicted the frequency of GC tetramer+ SIV-specific CD8+ T cells. For every 1-log10 increase in extrafollicular tetramer+ SIV-specific CD8+ T cells, there was an estimated 1.11-log10 (95% CI, 0.34- to 1.88-log) increase in the frequency of GC tetramer+ SIV-specific CD8+ T cells (P = 0.014). After adjusting for extrafollicular tetramer+ SIV-specific CD8+ T cells, tissue type (lymph node or spleen) was not a significant predictor of GC tetramer+ SIV-specific CD8+ T cells (P = 0.96). (E) Relationship between frequencies of non-GC follicular and extrafollicular tetramer+ SIV-specific CD8+ T cells. The frequency of extrafollicular tetramer+ SIV-specific CD8+ T cells predicted the frequency of non-GC follicular tetramer+ SIV-specific CD8+ T cells. For every 1-log10 increase in extrafollicular tetramer+ SIV-specific CD8+ T cells, there was an estimated 0.87-log10 (95% CI, 0.45- to 1.28-log) increase in the frequency of non-GC follicular tetramer+ SIV-specific CD8+ T cells (P = 0.0030). After adjusting for extrafollicular tetramer+ SIV-specific CD8+ T cells, tissue type (lymph node or spleen) was not a significant predictor of non-GC follicular tetramer+ SIV-specific CD8+ T cells (P = 0.86).
In addition, we previously found a positive correlation between levels of follicular and extrafollicular tetramer+ virus-specific CD8+ T cells (6). We performed a similar comparison in the present study, including 7 animals from our previously published work (6) and 8 additional animals. The results for the larger animal cohort strongly supported our previous finding and showed a highly significant positive correlation between levels of follicular and extrafollicular tetramer+ virus-specific CD8+ T cells in lymph node and spleen tissues (Fig. 1C) (P = 0.0001). Furthermore, we also observed significant correlations between levels of GC and extrafollicular tetramer+ virus-specific CD8+ T cells (Fig. 1D) (P = 0.014) and between levels of non-GC follicular and extrafollicular tetramer+ virus-specific CD8+ T cells (Fig. 1E) (P = 0.0030). Thus, as the total number of virus-specific CD8+ T cells increases, there is a corresponding increase in extrafollicular as well as follicular virus-specific CD8+ T cells, including cells in the GC as well as areas outside the GC in follicles.
Many follicular SIV-specific CD8+ T cells express PD-1 during chronic SIV infection.
As mentioned above, we previously showed that many SIV-specific CD8+ T cells appear to downmodulate surface expression of CD8 upon entering B cell follicles (32). Here we investigated additional factors that might inhibit follicular SIV-specific CD8+ T cell function. We investigated the inhibitory receptor PD-1, which is a marker of functional exhaustion of CD8+ T cells (44, 45) as well as a marker of CD8+ T cells that have recently been exposed to antigenic stimulation (44). PD-1 is markedly upregulated on the surfaces of dysfunctional virus-specific CD8+ T cells during chronic HIV and SIV infections (46, 47), and blockade of PD-1 in vivo enhanced SIV-specific CD8+ T cell responses (48). The degree to which follicular SIV-specific CD8+ T cells express PD-1 has not yet been investigated. To investigate this, we stained tissue sections from chronically SIV-infected rhesus macaques with MHC class I tetramers, antibodies directed against PD-1, and antibodies directed against CD20 to label B cell follicles (Table 1 and Fig. 2A). We found a broad range of 10 to 86% (average, 54%) of follicular tetramer+ SIV-specific CD8+ T cells expressing PD-1. Levels were lowest in animals Rh2515 and Rh2520, which were sacrificed at the earliest time point evaluated, at 42 days postinfection. Comparisons of viral loads and percentages of follicular tetramer+ SIV-specific CD8+ T cells expressing PD-1 showed no significant correlation (P = 0.10). PD-1 expression was slightly higher (11.2%; P = 0.047) in follicular than in extrafollicular tetramer+ SIV-specific CD8+ T cells (Fig. 2B). These results indicate that PD-1 expression is quite variable in animals during chronic SIV infection and suggest that many follicular as well as extrafollicular SIV-specific CD8+ T cells are continually being exposed to antigen and likely exhausted. Importantly, these results also indicate that subsets of follicular SIV-specific CD8+ T cells in each animal do not express PD-1 and are not exhausted.
FIG 2.
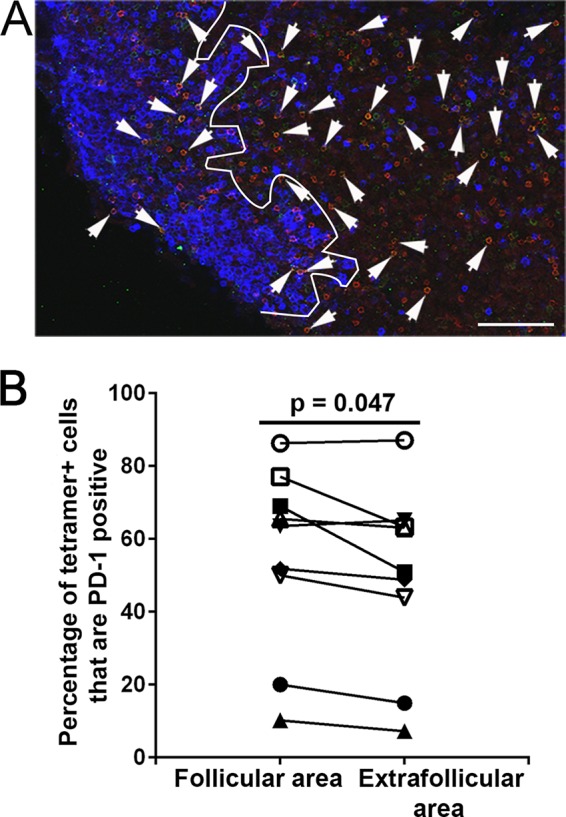
Many follicular tetramer+ SIV-specific CD8+ T cells express PD-1. (A) Representative lymph node section stained with Mamu-A*001:01/Gag CM9 tetramers to label SIV-specific CD8+ T cells (red), with PD-1 antibodies (green) to label PD-1-expressing cells, and with CD20 antibodies (blue) to define follicles. Confocal images were collected with a 20× objective. Bar, 100 μm. (B) The percentage of PD-1+ cells within the tetramer-binding population was 11.2% (P = 0.047; 95% CI, 0.2 to 23%) higher in follicles than in the extrafollicular regions.
Foxp3+ cells likely inhibit follicular and extrafollicular SIV-specific CD8+ T cell function.
We also investigated whether Foxp3+ cells were in contact with and potentially inhibiting follicular SIV-specific CD8+ T cells. Tregs play a pivotal role in maintaining immunological self-tolerance, controlling autoimmune disease (49, 50), and suppressing immune activation (51, 52). A large subset of Tregs is characterized by expression of the transcription factor Foxp3 (53–55). Although most Tregs are CD4+, a subpopulation of CD8+ T cells also function as Tregs (56–58). During chronic infection, Tregs can suppress CD8+ T cell activity in a contact-dependent manner (59). In this study, we investigated whether Foxp3+ Tregs were in contact with and potentially inhibiting follicular SIV-specific CD8+ T cell function. We stained lymph node tissue sections from chronically SIV-infected rhesus macaques with MHC class I tetramers to label SIV-specific CD8+ T cells, with anti-Foxp3 antibodies to label Foxp3+ Tregs, and with anti-IgM antibodies to label B cell follicles, and we quantified the numbers of tetramer+ cells in contact with Foxp3+ cells and the levels of tetramer+ Foxp3+ cells (Table 2). We found that, on average, 7% (range, 5 to 9%) of follicular tetramer+ SIV-specific CD8+ T cells were in direct contact with Foxp3+ cells (Fig. 3A and B). In extrafollicular regions, significantly higher levels of tetramer+ SIV-specific CD8+ T cells were in contact with Foxp3+ cells (average, 16%; and range, 9 to 29%) (Fig. 3B). In addition, a small subset of tetramer+ SIV-specific CD8+ T cells expressed Foxp3 (Fig. 3C). Averages of 0.35% (range, 0 to 1%) of follicular and 0.7% (range, 0 to 3%) of extrafollicular SIV-specific CD8+ T cells were Foxp3+ (Fig. 3D). No significant difference was observed between follicular and extrafollicular Foxp3+ SIV-specific CD8+ T cells. Thus, Foxp3+ cells contact and likely inhibit subsets of follicular as well as extrafollicular SIV-specific CD8+ T cells.
TABLE 2.
Numbers of tetramer+ cells in contact with Foxp3+ cells
| Macaque ID | Total no. of tetramer+ cells |
|||
|---|---|---|---|---|
| Counted in follicular areas | In contact with Foxp3+ cells in follicular areas | Counted in extrafollicular areas | In contact with Foxp3+ cells in extrafollicular areas | |
| Rh2515 | 100 | 6 | 176 | 40 |
| Rh2516 | 261 | 17 | 352 | 47 |
| Rh2520 | 212 | 20 | 119 | 35 |
| 11-45 | 406 | 23 | 486 | 43 |
| JD85 | 486 | 23 | 498 | 63 |
| 11-89 | 129 | 11 | 129 | 18 |
| 11-061 | 306 | 15 | 297 | 26 |
| Total | 1,900 | 115 | 2,057 | 272 |
FIG 5.

A subset of follicular tetramer+ SIV-specific CD8+ T cells are likely inhibited by Foxp3+ cells. (A) Representative lymph node section stained with Mamu-A*001:01/Gag CM9 tetramers (red), IgM (blue), and Foxp3 antibody (green), showing tetramer+ cells in contact with Foxp3+ cells. (B) Percentages of follicular tetramer+ SIV-specific CD8+ T cells that were in direct contact with Foxp3+ cells were significantly lower than those of extrafollicular tetramer+ SIV-specific CD8+ T cells (P = 0.0014). (C) Representative image showing that tetramer+ cells are Foxp3+. (D) There was no significant difference between percentages of tetramer+ SIV-specific CD8+ T cells inside and outside follicles that were Foxp3+ (P = 0.37). (E) Frequencies of tetramer+ SIV-specific CD8+ T cells inside follicles were significantly lower than those outside follicles (P = 0.017). (F) Frequencies of Foxp3+ cells inside follicles were significantly lower than those outside follicles (P = 0.0004) as well. (G) Ratios of tetramer+ SIV-specific CD8+ T cells to Foxp3+ cells inside follicles tended to be higher than those outside follicles (P = 0.052). (H) Separate linear regression lines were fit for follicular and extrafollicular percentages of tetramer+ cells in contact with Foxp3+ cells as predictors of plasma viral load. In the follicle, for every 1% increase in the percentage of tetramer+ cells in contact with Foxp3+ cells, there was an estimated 0.51-log10 (−0.09- to 1.1-log10) increase in SIV RNA log10 copies per milliliter (P = 0.08; R2 = 38.8%). In the extrafollicular region, for every 1% increase in tetramer+ cells in contact with Foxp3+ cells, there was an estimated 0.09-log10 (−0.09- to 0.26-log10) increase in SIV RNA log10 copies per milliliter (P = 0.26; R2 = 9.5%).
In addition, consistent with previous studies (5, 6, 30, 31), we found that tetramer+ SIV-specific CD8+ T cell levels were significantly lower in follicular than extrafollicular areas (P = 0.017) (Fig. 3E). Similarly, Foxp3+ cell levels were significantly lower in follicular than extrafollicular areas (P = 0.0004) (Fig. 3F). By combining these data, we found that the ratio of tetramer+ SIV-specific CD8+ T cells to Foxp3+ cells tended to be higher for follicular areas than for extrafollicular areas (P = 0.052) (Fig. 3G). Moreover, the absolute number of tetramer+ cells in contact with Foxp3+ cells was also higher in the extrafollicular region (272 of 2,057 tetramer+ SIV-specific CD8+ T cells) than in the follicular region (115 of 1,900 tetramer+ SIV-specific CD8+ T cells) (Table 2). These findings suggest that contact-mediated suppression of SIV-specific CD8+ T cells by Foxp3+ cells may be lower in follicular than in extrafollicular compartments.
Interestingly, when the percentages of follicular and extrafollicular tetramer+ SIV-specific CD8+ T cells in contact with Foxp3+ cells were evaluated together vis-à-vis viral load (SIV RNA copies per milliliter) for each animal, the percentage of follicular but not extrafollicular tetramer+ SIV-specific T cells in contact with Foxp3+ cells was a borderline significant predictor of viral load (P = 0.08 and P = 0.26, respectively) (Fig. 3H).
Levels of lymphoid SIV-specific CD8+ T cells tend to predict viral load.
We compared levels of follicular and extrafollicular tetramer+ SIV-specific CD8+ T cells and viral loads. We found that follicular levels of these cells tended to negatively predict (P = 0.060), and extrafollicular levels to significantly negatively predict (P = 0.036), plasma viral load (Fig. 4). These findings suggest that SIV-specific CD8+ T cells located in lymph nodes are important for controlling plasma viral loads.
FIG 4.

Relationships between plasma viral loads and frequencies of tetramer+ SIV-specific CD8+ T cells in follicular and extrafollicular areas. (A) Log10 follicular tetramer+ SIV-specific CD8+ T cells tended to predict plasma viral load (P = 0.060). For every 1-log10 increase in follicular tetramer+ SIV-specific CD8+ T cells, there was an estimated 1.25-log10 (95% CI, −0.064- to 2.57-log10) decrease in SIV RNA log10 copies per milliliter. (B) Log10 extrafollicular tetramer+ SIV-specific CD8+ T cells significantly predicted plasma viral load (P = 0.036). For every 1-log10 increase in follicular tetramer+ SIV-specific CD8+ T cells, there was an estimated 1.60-log10 (95% CI, 0.12- to 3.08-log10) decrease in SIV RNA log10 copies per milliliter.
Activated proliferating SIV-specific CD8+ T cells are found in follicles.
We next assessed whether follicular SIV-specific CD8+ T cells express Ki67 in the lymph nodes and spleen (Table 1). In T cells, Ki67 is a marker of activation and proliferation (60, 61). We found Ki67+ tetramer+ SIV-specific CD8+ T cells in follicular (Fig. 5A) as well as extrafollicular (Fig. 5B) regions, at similar levels (Fig. 5C). On average, 11% (range, 5 to 22%) of tetramer+ SIV-specific CD8+ T cells in the GCs were Ki67+, with 12% (range, 0 to 33%) Ki67+ in non-GC follicular areas and 13% (range, 5 to 24%) Ki67+ in extrafollicular areas. These data indicate that subsets of both follicular and extrafollicular SIV-specific CD8+ T cells were activated and proliferating.
FIG 5.
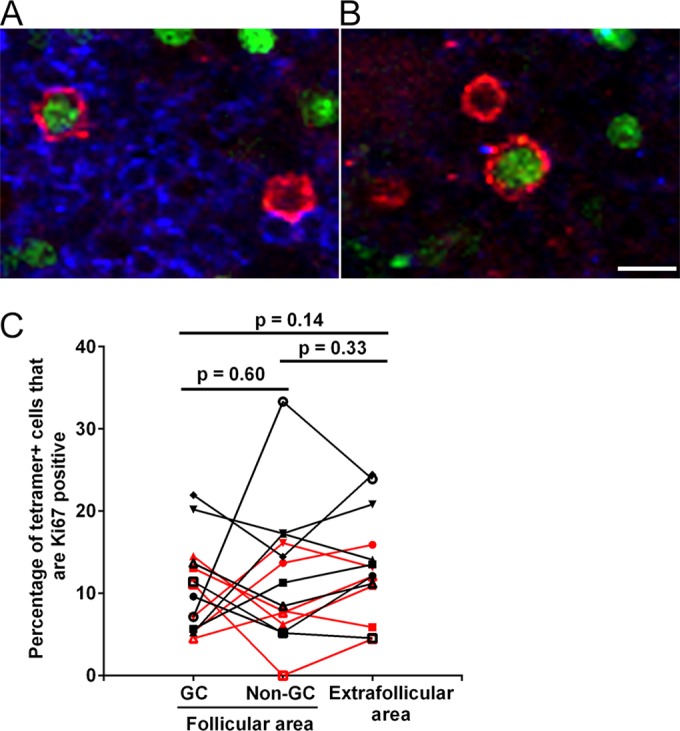
Ki67 expression levels in follicular and extrafollicular tetramer+ SIV-specific CD8+ T cells. (A and B) Representative lymph node sections stained with Mamu-A*001:01/Gag CM9 tetramers (red), IgM (blue), and Ki67 antibody (green), showing tetramer+ Ki67+ cells in follicles (A) and extrafollicular regions (B). Bar, 10 μm. (C) Percentages of tetramer+ SIV-specific CD8+ T cells that expressed Ki67 in GC and non-GC areas of follicles and in extrafollicular areas in the lymph nodes and spleen. Data for samples from the spleen are shown in red, and data for lymph nodes are shown in black. There was no significant difference between compartments for the lymph nodes or the spleen (P = 0.13).
Many follicular SIV-specific CD8+ T cells express low levels of perforin.
Perforin is an important cytolytic effector molecule which CTL use to lyse virus-infected cells. We previously showed that approximately 35% of follicular SIV-specific CD8+ T cells express perforin and that most expressed another effector molecule, granzyme B, which typically works in concert with perforin to lyse infected cells (6).
Central memory (TCM) and effector memory (TEM) T cells are two distinct populations of memory T lymphocytes. TCM subsets of CTL can be identified by their absence of perforin expression (62, 63). TCM are known for proliferating and secreting cytokines upon contact with antigen, which serves to propagate antigen-specific CTL and to send inflammatory signals to propagate inflammatory responses, but they are not able to kill infected cells immediately upon contact (62, 63). In contrast, TEM express perforin and, importantly, can kill infected cells immediately upon contact (62, 63).
Based on the importance of perforin expression for the ability of CTL to immediately kill infected cells, we set out to characterize perforin expression levels within follicular and extrafollicular SIV-specific CD8+ T cells in lymph nodes during chronic SIV infection (Table 1). We determined the levels of perforin (negative, low, medium, and high) in tetramer+ follicular and extrafollicular SIV-specific CD8+ T cells (Fig. 6A). We found that a wide range of tetramer+ follicular SIV-specific CD8+ T cells did not express perforin (mean, 56%; and range, 20 to 81%), consistent with their being TCM. The percentage of perforin− tetramer+ cells was slightly higher in follicular than in extrafollicular regions (P = 0.026) (Fig. 6B). Among perforin+ tetramer+ cells, most expressed low to medium levels of perforin (mean, 94%; and range, 91 to 97%), consistent with their being TEM. A small population of perforin+ tetramer+ cells (mean, 6%; and range, 3 to 9%) expressed high levels of perforin, consistent with their being effector T cells or terminally differentiated memory populations. Percentages of both follicular (P = 0.90) and extrafollicular (P = 0.91) tetramer+ SIV-specific CD8+ T cells expressing perforin showed no significant correlation with plasma viral loads. The percentages of follicular and extrafollicular tetramer+ cells that expressed each level of perforin were not significantly different (Fig. 6C). Thus, there were similar levels of tetramer+ SIV-specific CD8+ T cells expressing low, medium, and high levels of perforin in follicular and extrafollicular compartments.
FIG 6.
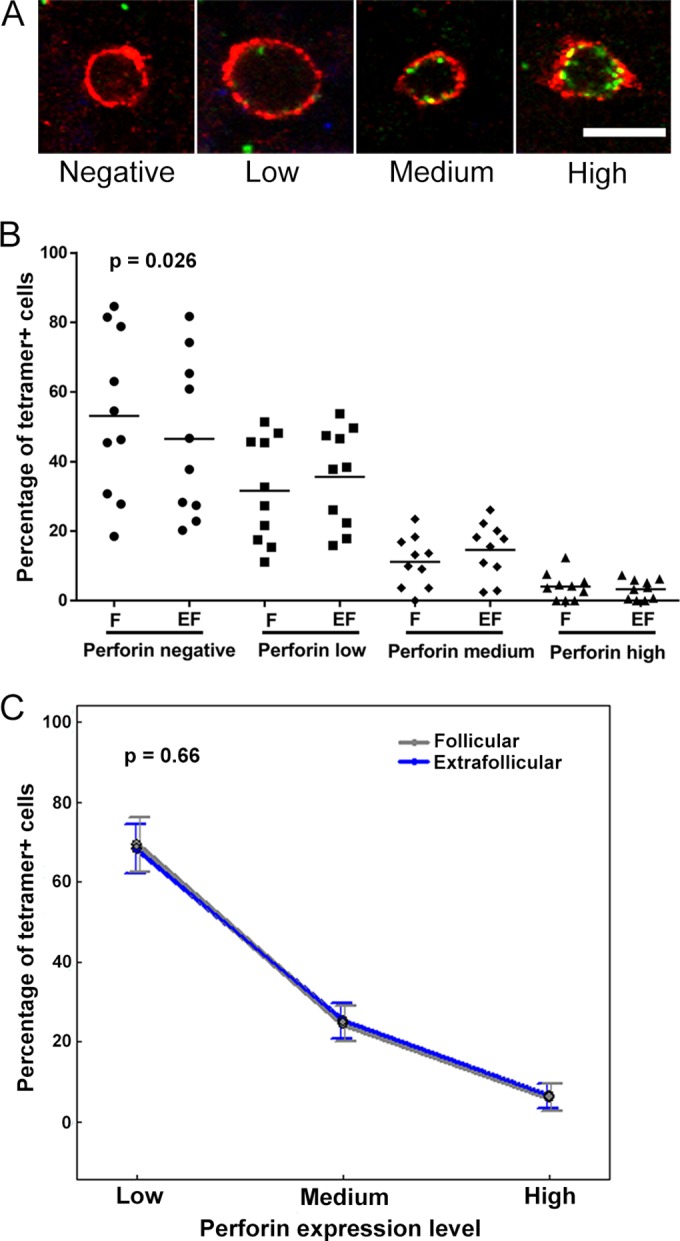
Perforin expression levels in follicular and extrafollicular tetramer+ SIV-specific CD8+ T cells. (A) Representative lymph node sections stained with Mamu-A*001:01/Gag CM9 tetramers (red) and perforin (green), showing negative, low, medium, and high levels of perforin in MHC class I tetramer+ SIV-specific CD8+ T cells. Bar, 10 μm. (B) Percentages of tetramer+ SIV-specific CD8+ T cells that expressed perforin in follicular (F) and extrafollicular (EF) regions. The percentage of tetramer+ SIV-specific CD8+ T cells that did not express perforin was ∼5.4% (95% CI, 0.7 to 10.2%) higher in follicles than in extrafollicular regions (P = 0.026). (C) Among tetramer+ cells that expressed perforin, the distributions of cells across low, medium, and high levels of perforin expression were not significantly different between follicular and extrafollicular regions (P = 0.66).
Increase in follicular SIV-producing cells post-CD8 depletion.
To evaluate the ability of SIV-specific CD8+ T cells to kill SIV-producing cells in follicular and extrafollicular compartments in vivo, we temporarily depleted CD8+ T cells in four chronically SIV-infected rhesus macaques by using anti-CD8 antibodies. As anticipated from previous CD8 depletion studies (26–28), after administration of anti-CD8 antibodies, CD8+ T cells, including tetramer-binding SIV-specific CD8+ T cells, were temporarily depleted from blood and the plasma viral loads increased (Fig. 7A). At 10 days postdepletion, animals were sacrificed and tissues collected for in situ analyses. Using in situ tetramer staining combined with immunohistochemistry, we visualized and quantified tetramer+ SIV-specific CD8+ T cells inside and outside B cell follicles before (Fig. 7B) and after (Fig. 7C) CD8 depletion. Tetramer+ SIV-specific CD8+ T cells were largely depleted in both follicular and extrafollicular areas (Fig. 7D and E). Using in situ hybridization combined with immunohistochemistry, we visualized and quantified SIV RNA+ cells inside and outside B cell follicles before (Fig. 7F) and after (Fig. 7G) CD8 depletion. We found higher levels of both follicular and extrafollicular SIV-producing cells after CD8+ T cell depletion for all four animals examined, albeit the increase was much more substantial in extrafollicular areas, with the average change in follicles being 3.8 cells/mm2 (range, 0.6 to 10.3 cells/mm2) (Fig. 7H) and that in extrafollicular areas being 8.9 cells/mm2 (range, 0.6 to 22.4 cells/mm2) (Fig. 7I). These results suggest that both follicular and extrafollicular CD8+ T cells suppress viral replication in vivo.
FIG 7.
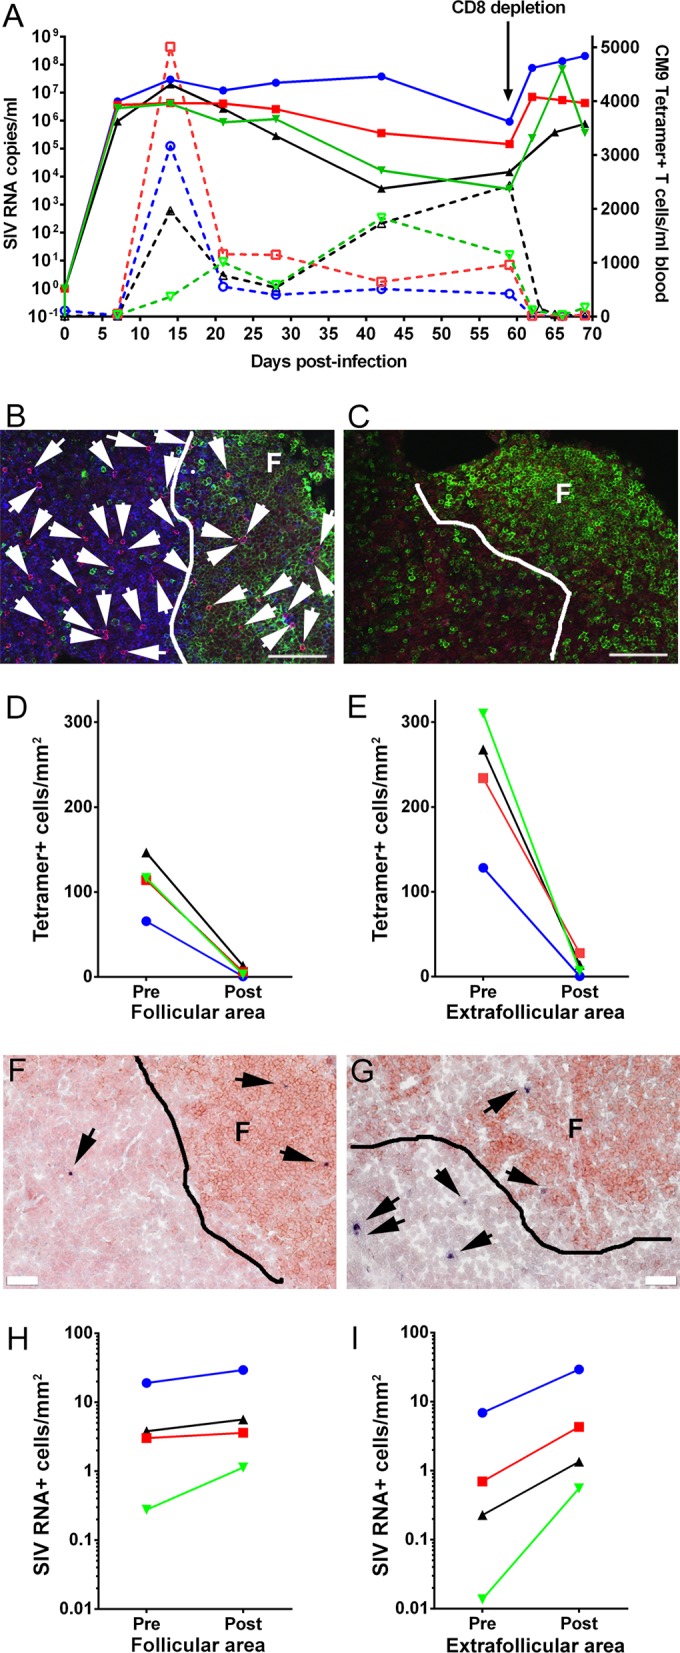
Increase in follicular and extrafollicular SIV-producing cells post-CD8 depletion. (A) Dynamics of plasma viral load and Mamu-A*001:01/Gag CM9 tetramer+ cell concentration in blood post-SIV infection. (B and C) Representative lymph node tissue sections stained with MHC class I tetramers (red) to label SIV-specific CD8+ T cells, with CD8 antibodies (blue) to label T cells, and with CD20 antibodies (green) to label B cells and define B cell follicles. (B) Lymph node section from animal Rh2516, stained with Mamu-A*001:01/Gag CM9 tetramers, as an example of the tetramer+ SIV-specific CD8+ T cell level and location before CD8 depletion. (C) Lymph node section from animal Rh2516, stained with Mamu-A*001:01/Gag CM9 tetramers, as an example of the tetramer+ SIV-specific CD8+ T cell level and location after CD8 depletion. Bars, 100 μm. (D) Tetramer+ SIV-specific CD8+ T cells in B cell follicles were almost completely depleted after CD8 depletion in all four animals. (E) Tetramer+ SIV-specific CD8+ T cells in extrafollicular regions dramatically decreased after CD8 depletion. (F and G) Representative images of in situ hybridization for SIV RNA to identify virus-producing cells (blue/black cells indicated by arrows) and of CD20 staining (brown) to morphologically identify B cell follicles in lymph nodes before (F) and after (G) CD8 depletion. Bars, 50 μm. (H) Frequencies of SIV RNA+ cells in B cell follicles increased after CD8 depletion in all four animals. (I) Frequencies of SIV RNA+ cells in extrafollicular regions dramatically increased after CD8 depletion.
DISCUSSION
B cell follicles are a major reservoir of HIV and SIV replication and remain a critical obstacle to the elimination of HIV and SIV infections. During chronic infection, HIV- and SIV-producing cells are highly concentrated within B cell follicles (4–6, 9), while virus-specific CD8+ T cells fail to accumulate in large numbers in these areas (5, 6, 30, 31), indicating that B cell follicles are somewhat of an immunoprivileged site where low concentrations of antiviral CD8+ T cells permit ongoing viral replication. Furthermore, during HIV and SIV infections, FDCs within the GCs of mature B cell follicles have large quantities of virions attached to the cell surface via complement and antibody complexes (2, 10, 11), and they are thought to continually be infecting follicular CD4+ T cells.
Prior to our study presented here, it was not clear whether SIV-specific CD8+ T cells are able to migrate throughout the follicular area, including the GC, or are limited to only certain regions of the follicle. We found that tetramer+ SIV-specific CD8+ T cells were located throughout the follicle, including the GC as well as non-GC regions of follicles, at similar levels, in both lymph node and spleen tissues. These findings indicate that virus-specific CD8+ T cells are able to migrate throughout the follicular area, including GC areas laden with virus.
In addition to there being relatively low levels of SIV-specific CD8+ T cells in follicles, other factors or cellular processes likely contribute to the inability of CTL to fully control follicular viral replication. We previously found that virus-specific CD8+ T cells often downmodulate cell surface expression of the important CD8 coreceptor upon entering follicles (32), which likely impairs cytolytic function. We show here that some follicular tetramer+ SIV-specific CD8+ T cells are PD-1 positive and likely struggling with exhaustion. We also found that small subsets were in contact with Foxp3+ cells or were Foxp3+, indicating a potential source of T cell inhibition. Thus, there are several mechanisms that likely contribute to the failure of virus-specific CD8+ T cells to fully control follicular HIV and SIV replication.
Although several mechanisms contribute to the failure of follicular virus-specific CTL to fully control HIV and SIV replication, evidence exists that at least a subset of follicular virus-specific CD8+ T cells are able to suppress viral replication. In support of this hypothesis, we recently reported that virus-specific CD8+ T cells in lymphoid compartments predict levels of SIV-producing cells in those compartments (6), and as we show here, they also tend to predict plasma viral load. We also show here that many follicular tetramer+ virus-specific CD8+ T cells express the effector molecule perforin at low to medium levels, with a small subset expressing perforin at high levels, and thus have the machinery needed for cytolytic function. In addition, we show here that a subset of follicular tetramer+ SIV-specific CD8+ T cells express Ki67, indicating that they are activated and proliferating cells. Importantly, we also show here a rise in follicular virus-producing cells after CD8 depletion in all four animals examined, suggesting that follicular CD8+ T cells actively suppress follicular viral replication in vivo.
Additional evidence that follicular CD8+ T cells suppress viral replication was presented in two recently published studies (64, 65). Follicular CXCR5+ lymphocytic choriomeningitis virus (LCMV)-specific CD8+ T cells were shown to control LCMV infection of TFH cells and to reduce viral loads significantly better than CXCR5− CD8+ T cells adoptively transferred to LCMV-infected mice (64, 65). In addition, and importantly, HIV-specific CXCR5+ CD8+ T cell levels in blood inversely correlated with viral loads for untreated chronically HIV-infected patients (64). Thus, substantial evidence is accumulating to support an important role for follicular antiviral CD8+ T cells in controlling infection.
While the focus of this study is follicular CD8+ T cells, it is also important to discuss extrafollicular cells. We found a greater increase of extrafollicular SIV-producing cells after CD8 depletion than the increase seen in follicular areas. This finding supports the hypothesis that we have been promoting for a decade, that HIV- and SIV-specific CD8+ T cells are able to effectively clear virus-producing cells in the extrafollicular region but are not as effective at targeting virus-producing cells in B cell follicles (5, 6, 66). These findings support the recent findings by Fukazawa et al., who found that in vivo CD8+ lymphocyte depletion of chronically SIV-infected rhesus macaques led to a redistribution of SIV infection from TFH cells within the follicles to extrafollicular CD4+ T cells (9), which similarly suggests a superior ability of extrafollicular relative to follicular CD8+ T cells in controlling viral replication.
There is clearly a need to develop strategies to eliminate HIV and SIV virions and infected cells from B cell follicles. The studies presented here and those of others support HIV cure strategies that augment functional follicular virus-specific CD8+ T cells to enhance viral control. This might be achieved in a number of ways. First, we found a highly significant positive correlation between levels of extrafollicular and follicular tetramer+ virus-specific CD8+ T cells, suggesting that increasing the total number of lymphoid virus-specific CD8+ T cells may increase the total numbers of both extrafollicular and follicular virus-specific CD8+ T cells. Second, given that CXCR5 directs CD8+ T cells to B cell follicles (64, 65), adoptive transfer of autologous HIV-specific CXCR5+ CD8+ T cells may increase levels of HIV-specific CXCR5+ CD8+ T cells in follicles and reduce follicular viral replication. Third, combining a therapy that increases levels of follicular HIV-specific CD8+ T cells with other therapies may be synergistic. For example, adding blockade of PD-1/PD-L1 to a therapy that augments levels of follicular HIV-specific CD8+ T cells may enhance reductions in viral replication, as it has been shown that blockade of the PD-1/PD-L1 pathway in vivo restores the function of exhausted CD8+ T cells during chronic viral infection (44) and enhances SIV-specific CD8+ T cell responses (48). In addition, anti-PD-L1 treatment synergistically strengthened the control of LCMV replication mediated by the adoptive transfer of CXCR5+ CD8+ T cells in mice (64). Inhibition of Tregs might also synergize with a therapy that augments levels of follicular HIV-specific CD8+ T cells. Interleukin-15 (IL-15) is a cytokine that facilitates CD8+ and CD4+ effector T cell expansion while having no preferential effect on the proliferation of Tregs (67). In addition, IL-27 delivery inhibits CD4+ CD25+ Foxp3+ Treg expansion and potentiates tumor-specific CTL reactivity (68). Based on these properties, it is reasonable to speculate that therapeutic IL-15 and IL-27 administration might lead to lower levels of Tregs and higher levels of effector T cells in lymphoid tissues, and thus lead to improved viral control. A therapy that increases levels of follicular HIV-specific CD8+ T cells might also be combined with HIV latency reversal agents to improve killing of reactivated cells. It might also be combined with approaches that create CD4+ T cells that are resistant to infection to improve overall viral suppression. Fourth, therapies that eliminate infectious HIV from the FDC network may be developed, and these may be combined with the strategies suggested above. Thus, there is a critical need to reduce HIV replication in B cell follicles, and there are many new approaches that may tackle this problem.
In summary, the studies presented here suggest that during chronic SIV infection, despite the likely inhibition of SIV-specific CD8+ T cells by Foxp3+ cells and the likely exhaustion of a subset of follicular SIV-specific CD8+ T cells, some follicular SIV-specific CD8+ T cells express the functional markers perforin and Ki67 and appear to suppress viral replication in vivo. These findings support HIV cure strategies that augment functional follicular virus-specific CD8+ T cells to enhance viral control.
ACKNOWLEDGMENTS
We thank Vaiva Vezys for a thoughtful review of the manuscript, the NIH Nonhuman Primate Reagent Resource for CD8-depleting antibodies, the Immunology Services and Virology Services of the Wisconsin National Primate Research Center for providing CD4 count and plasma viral load data, and Heather Simmons of the Wisconsin National Primate Research Center for consultation and assistance in providing rhesus macaque tissue specimens.
This work was supported by Public Health Service grants from the National Institutes of Health (grants R01AI096966, R01AI090732, and R56AI080418), by Wisconsin National Primate Research Center grant P51OD011106/P51RR000167, by the Wisconsin National Primate Research Center Pathology and Scientific Protocol Implementation Units, NIH Tetramer Core Facility (contract HHSN272201300006C), by the NIH Nonhuman Primate Reagent Resource (grant R24 RR016001), and by the National Institute of Allergy and Infectious Diseases (contract HHSN 2722000900037C).
REFERENCES
- 1.Schacker T, Little S, Connick E, Gebhard K, Zhang ZQ, Krieger J, Pryor J, Havlir D, Wong JK, Schooley RT, Richman D, Corey L, Haase AT. 2001. Productive infection of T cells in lymphoid tissues during primary and early human immunodeficiency virus infection. J Infect Dis 183:555–562. doi: 10.1086/318524. [DOI] [PubMed] [Google Scholar]
- 2.Embretson J, Zupancic M, Ribas JL, Burke A, Racz P, Tenner-Racz K, Haase AT. 1993. Massive covert infection of helper T lymphocytes and macrophages by HIV during the incubation period of AIDS. Nature 362:359–362. doi: 10.1038/362359a0. [DOI] [PubMed] [Google Scholar]
- 3.Reinhart TA, Rogan MJ, Huddleston D, Rausch DM, Eiden LE, Haase AT. 1997. Simian immunodeficiency virus burden in tissues and cellular compartments during clinical latency and AIDS. J Infect Dis 176:1198–1208. doi: 10.1086/514113. [DOI] [PubMed] [Google Scholar]
- 4.Folkvord JM, Armon C, Connick E. 2005. Lymphoid follicles are sites of heightened human immunodeficiency virus type 1 (HIV-1) replication and reduced antiretroviral effector mechanisms. AIDS Res Hum Retroviruses 21:363–370. doi: 10.1089/aid.2005.21.363. [DOI] [PubMed] [Google Scholar]
- 5.Connick E, Mattila T, Folkvord JM, Schlichtemeier R, Meditz AL, Ray MG, McCarter MD, Mawhinney S, Hage A, White C, Skinner PJ. 2007. CTL fail to accumulate at sites of HIV-1 replication in lymphoid tissue. J Immunol 178:6975–6983. doi: 10.4049/jimmunol.178.11.6975. [DOI] [PubMed] [Google Scholar]
- 6.Connick E, Folkvord JM, Lind KT, Rakasz EG, Miles B, Wilson NA, Santiago ML, Schmitt K, Stephens EB, Kim HO, Wagstaff R, Li S, Abdelaal HM, Kemp N, Watkins DI, MaWhinney S, Skinner PJ. 2014. Compartmentalization of simian immunodeficiency virus replication within secondary lymphoid tissues of rhesus macaques is linked to disease stage and inversely related to localization of virus-specific CTL. J Immunol 193:5613–5625. doi: 10.4049/jimmunol.1401161. [DOI] [PMC free article] [PubMed] [Google Scholar]
- 7.Hufert FT, van Lunzen J, Janossy G, Bertram S, Schmitz J, Haller O, Racz P, von Laer D. 1997. Germinal centre CD4 T cells are an important site of HIV replication in vivo. AIDS 11:849–857. doi: 10.1097/00002030-199707000-00003. [DOI] [PubMed] [Google Scholar]
- 8.Brenchley JM, Vinton C, Tabb B, Hao XP, Connick E, Paiardini M, Lifson JD, Silvestri G, Estes JD. 2012. Differential infection patterns of CD4+ T cells and lymphoid tissue viral burden distinguish progressive and nonprogressive lentiviral infections. Blood 120:4172–4181. doi: 10.1182/blood-2012-06-437608. [DOI] [PMC free article] [PubMed] [Google Scholar]
- 9.Fukazawa Y, Lum R, Okoye AA, Park H, Matsuda K, Bae JY, Hagen SI, Shoemaker R, Deleage C, Lucero C, Morcock D, Swanson T, Legasse AW, Axthelm MK, Hesselgesser J, Geleziunas R, Hirsch VM, Edlefsen PT, Piatak M Jr, Estes JD, Lifson JD, Picker LJ. 2015. B cell follicle sanctuary permits persistent productive simian immunodeficiency virus infection in elite controllers. Nat Med 21:132–139. doi: 10.1038/nm.3781. [DOI] [PMC free article] [PubMed] [Google Scholar]
- 10.Schacker T, Little S, Connick E, Gebhard-Mitchell K, Zhang ZQ, Krieger J, Pryor J, Havlir D, Wong JK, Richman D, Corey L, Haase AT. 2000. Rapid accumulation of human immunodeficiency virus (HIV) in lymphatic tissue reservoirs during acute and early HIV infection: implications for timing of antiretroviral therapy. J Infect Dis 181:354–357. doi: 10.1086/315178. [DOI] [PubMed] [Google Scholar]
- 11.Heath SL, Tew JG, Tew JG, Szakal AK, Burton GF. 1995. Follicular dendritic cells and human immunodeficiency virus infectivity. Nature 377:740–744. doi: 10.1038/377740a0. [DOI] [PubMed] [Google Scholar]
- 12.Walker CM, Moody DJ, Stites DP, Levy JA. 1986. CD8+ lymphocytes can control HIV infection in vitro by suppressing virus replication. Science 234:1563–1566. doi: 10.1126/science.2431484. [DOI] [PubMed] [Google Scholar]
- 13.Kannagi M, Chalifoux LV, Lord CI, Letvin NL. 1988. Suppression of simian immunodeficiency virus replication in vitro by CD8+ lymphocytes. J Immunol 140:2237–2242. [PubMed] [Google Scholar]
- 14.Borrow P, Lewicki H, Hahn BH, Shaw GM, Oldstone MB. 1994. Virus-specific CD8+ cytotoxic T-lymphocyte activity associated with control of viremia in primary human immunodeficiency virus type 1 infection. J Virol 68:6103–6110. [DOI] [PMC free article] [PubMed] [Google Scholar]
- 15.Koup RA, Safrit JT, Cao Y, Andrews CA, McLeod G, Borkowsky W, Farthing C, Ho DD. 1994. Temporal association of cellular immune responses with the initial control of viremia in primary human immunodeficiency virus type 1 syndrome. J Virol 68:4650–4655. [DOI] [PMC free article] [PubMed] [Google Scholar]
- 16.Li Q, Skinner PJ, Ha SJ, Duan L, Mattila TL, Hage A, White C, Barber DL, O'Mara L, Southern PJ, Reilly CS, Carlis JV, Miller CJ, Ahmed R, Haase AT. 2009. Visualizing antigen-specific and infected cells in situ predicts outcomes in early viral infection. Science 323:1726–1729. doi: 10.1126/science.1168676. [DOI] [PMC free article] [PubMed] [Google Scholar]
- 17.Migueles SA, Laborico AC, Shupert WL, Sabbaghian MS, Rabin R, Hallahan CW, Van Baarle D, Kostense S, Miedema F, McLaughlin M. 2002. HIV-specific CD8 T cell proliferation is coupled to perforin expression and is maintained in nonprogressors. Nat Immunol 3:1061–1068. doi: 10.1038/ni845. [DOI] [PubMed] [Google Scholar]
- 18.Hersperger AR, Pereyra F, Nason M, Demers K, Sheth P, Shin LY, Kovacs CM, Rodriguez B, Sieg SF, Teixeira-Johnson L, Gudonis D, Goepfert PA, Lederman MM, Frank I, Makedonas G, Kaul R, Walker BD, Betts MR. 2010. Perforin expression directly ex vivo by HIV-specific CD8 T-cells is a correlate of HIV elite control. PLoS Pathog 6:e1000917. doi: 10.1371/journal.ppat.1000917. [DOI] [PMC free article] [PubMed] [Google Scholar]
- 19.Betts MR, Nason MC, West SM, De Rosa SC, Migueles SA, Abraham J, Lederman MM, Benito JM, Goepfert PA, Connors M, Roederer M, Koup RA. 2006. HIV nonprogressors preferentially maintain highly functional HIV-specific CD8+ T cells. Blood 107:4781–4789. doi: 10.1182/blood-2005-12-4818. [DOI] [PMC free article] [PubMed] [Google Scholar]
- 20.Migueles SA, Sabbaghian MS, Shupert WL, Bettinotti MP, Marincola FM, Martino L, Hallahan CW, Selig SM, Schwartz D, Sullivan J, Connors M. 2000. HLA B*5701 is highly associated with restriction of virus replication in a subgroup of HIV-infected long term nonprogressors. Proc Natl Acad Sci U S A 97:2709–2714. doi: 10.1073/pnas.050567397. [DOI] [PMC free article] [PubMed] [Google Scholar]
- 21.Saez-Cirion A, Lacabaratz C, Lambotte O, Versmisse P, Urrutia A, Boufassa F, Barre-Sinoussi F, Delfraissy JF, Sinet M, Pancino G, Venet A, Agence Nationale de Recherches sur le Sida EP36 HIV Controllers Study Group . 2007. HIV controllers exhibit potent CD8 T cell capacity to suppress HIV infection ex vivo and peculiar cytotoxic T lymphocyte activation phenotype. Proc Natl Acad Sci U S A 104:6776–6781. doi: 10.1073/pnas.0611244104. [DOI] [PMC free article] [PubMed] [Google Scholar]
- 22.Deeks SG, Walker BD. 2007. Human immunodeficiency virus controllers: mechanisms of durable virus control in the absence of antiretroviral therapy. Immunity 27:406–416. doi: 10.1016/j.immuni.2007.08.010. [DOI] [PubMed] [Google Scholar]
- 23.Walker BD, Xu GY. 2013. Unravelling the mechanisms of durable control of HIV-1. Nat Rev Immunol 13:487–498. doi: 10.1038/nri3478. [DOI] [PubMed] [Google Scholar]
- 24.Goulder PJ, Watkins DI. 2004. HIV and SIV CTL escape: implications for vaccine design. Nat Rev Immunol 4:630–640. doi: 10.1038/nri1417. [DOI] [PubMed] [Google Scholar]
- 25.Mens H, Kearney M, Wiegand A, Shao W, Schonning K, Gerstoft J, Obel N, Maldarelli F, Mellors JW, Benfield T, Coffin JM. 2010. HIV-1 continues to replicate and evolve in patients with natural control of HIV infection. J Virol 84:12971–12981. doi: 10.1128/JVI.00387-10. [DOI] [PMC free article] [PubMed] [Google Scholar]
- 26.Schmitz JE, Kuroda MJ, Santra S, Sasseville VG, Simon MA, Lifton MA, Racz P, Tenner-Racz K, Dalesandro M, Scallon BJ, Ghrayeb J, Forman MA, Montefiori DC, Rieber EP, Letvin NL, Reimann KA. 1999. Control of viremia in simian immunodeficiency virus infection by CD8+ lymphocytes. Science 283:857–860. doi: 10.1126/science.283.5403.857. [DOI] [PubMed] [Google Scholar]
- 27.Jin X, Bauer DE, Tuttleton SE, Lewin S, Gettie A, Blanchard J, Irwin CE, Safrit JT, Mittler J, Weinberger L, Kostrikis LG, Zhang L, Perelson AS, Ho DD. 1999. Dramatic rise in plasma viremia after CD8(+) T cell depletion in simian immunodeficiency virus-infected macaques. J Exp Med 189:991–998. doi: 10.1084/jem.189.6.991. [DOI] [PMC free article] [PubMed] [Google Scholar]
- 28.Matano T, Shibata R, Siemon C, Connors M, Lane HC, Martin MA. 1998. Administration of an anti-CD8 monoclonal antibody interferes with the clearance of chimeric simian/human immunodeficiency virus during primary infections of rhesus macaques. J Virol 72:164–169. [DOI] [PMC free article] [PubMed] [Google Scholar]
- 29.Chowdhury A, Hayes TL, Bosinger SE, Lawson BO, Vanderford T, Schmitz JE, Paiardini M, Betts M, Chahroudi A, Estes JD, Silvestri G. 2015. Differential impact of in vivo CD8+ T lymphocyte depletion in controller versus progressor simian immunodeficiency virus-infected macaques. J Virol 89:8677–8686. doi: 10.1128/JVI.00869-15. [DOI] [PMC free article] [PubMed] [Google Scholar]
- 30.Tjernlund A, Zhu J, Laing K, Diem K, McDonald D, Vazquez J, Cao J, Ohlen C, McElrath MJ, Picker LJ, Corey L. 2010. In situ detection of Gag-specific CD8+ cells in the GI tract of SIV infected Rhesus macaques. Retrovirology 7:12. doi: 10.1186/1742-4690-7-12. [DOI] [PMC free article] [PubMed] [Google Scholar]
- 31.Sasikala-Appukuttan AK, Kim HO, Kinzel NJ, Hong JJ, Smith AJ, Wagstaff R, Reilly C, Piatak M Jr, Lifson JD, Reeves RK, Johnson RP, Haase AT, Skinner PJ. 2013. Location and dynamics of the immunodominant CD8 T cell response to SIVΔnef immunization and SIVmac251 vaginal challenge. PLoS One 8:e81623. doi: 10.1371/journal.pone.0081623. [DOI] [PMC free article] [PubMed] [Google Scholar]
- 32.Hong JJ, Reynolds MR, Mattila TL, Hage A, Watkins DI, Miller CJ, Skinner PJ. 2009. Localized populations of CD8 MHC class I tetramer SIV-specific T cells in lymphoid follicles and genital epithelium. PLoS One 4:e4131. doi: 10.1371/journal.pone.0004131. [DOI] [PMC free article] [PubMed] [Google Scholar]
- 33.Xu H, Wang X, Lackner AA, Veazey RS. 2013. CD8 down-regulation and functional impairment of SIV-specific cytotoxic T lymphocytes in lymphoid and mucosal tissues during SIV infection. J Leukoc Biol 93:943–950. doi: 10.1189/jlb.1112580. [DOI] [PMC free article] [PubMed] [Google Scholar]
- 34.Quigley MF, Gonzalez VD, Granath A, Andersson J, Sandberg JK. 2007. CXCR5 CCR7-CD8 T cells are early effector memory cells that infiltrate tonsil B cell follicles. Eur J Immunol 37:3352–3362. doi: 10.1002/eji.200636746. [DOI] [PubMed] [Google Scholar]
- 35.Abdelaal HM, Kim HO, Wagstaff R, Sawahata R, Southern PJ, Skinner PJ. 2015. Comparison of Vibratome and Compresstome sectioning of fresh primate lymphoid and genital tissues for in situ MHC-tetramer and immunofluorescence staining. Biol Proced Online 17:2. doi: 10.1186/s12575-014-0012-4. [DOI] [PMC free article] [PubMed] [Google Scholar]
- 36.Skinner PJ, Daniels MA, Schmidt CS, Jameson SC, Haase AT. 2000. Cutting edge: in situ tetramer staining of antigen-specific T cells in tissues. J Immunol 165:613–617. doi: 10.4049/jimmunol.165.2.613. [DOI] [PubMed] [Google Scholar]
- 37.Allen TM, Sidney J, del Guercio MF, Glickman RL, Lensmeyer GL, Wiebe DA, DeMars R, Pauza CD, Johnson RP, Sette A, Watkins DI. 1998. Characterization of the peptide binding motif of a rhesus MHC class I molecule (Mamu-A*01) that binds an immunodominant CTL epitope from simian immunodeficiency virus. J Immunol 160:6062–6071. [PubMed] [Google Scholar]
- 38.Loffredo JT, Sidney J, Bean AT, Beal DR, Bardet W, Wahl A, Hawkins OE, Piaskowski S, Wilson NA, Hildebrand WH, Watkins DI, Sette A. 2009. Two MHC class I molecules associated with elite control of immunodeficiency virus replication, Mamu-B*08 and HLA-B*2705, bind peptides with sequence similarity. J Immunol 182:7763–7775. doi: 10.4049/jimmunol.0900111. [DOI] [PMC free article] [PubMed] [Google Scholar]
- 39.Loffredo JT, Sidney J, Wojewoda C, Dodds E, Reynolds MR, Napoe G, Mothe BR, O'Connor DH, Wilson NA, Watkins DI, Sette A. 2004. Identification of seventeen new simian immunodeficiency virus-derived CD8+ T cell epitopes restricted by the high frequency molecule, Mamu-A*02, and potential escape from CTL recognition. J Immunol 173:5064–5076. doi: 10.4049/jimmunol.173.8.5064. [DOI] [PubMed] [Google Scholar]
- 40.Parsons NR, Costa ML, Achten J, Stallard N. 2009. Repeated measures proportional odds logistic regression analysis of ordinal score data in the statistical software package R. Comput Stat Data Anal 53:632–641. doi: 10.1016/j.csda.2008.08.004. [DOI] [Google Scholar]
- 41.Parsons NR, Edmondson R, Gilmour S. 2006. A generalized estimating equation method for fitting autocorrelated ordinal score data with an application in horticultural research. J R Stat Soc Ser C Appl Stat 55:507–524. doi: 10.1111/j.1467-9876.2006.00550.x. [DOI] [Google Scholar]
- 42.Parsons NR. 2013. Proportional-odds models for repeated composite and long ordinal outcome scales. Stat Med 32:3181–3191. doi: 10.1002/sim.5756. [DOI] [PubMed] [Google Scholar]
- 43.R Core Team. 2014. R: a language and environment for statistical computing. R Foundation for Statistical Computing, Vienna, Austria. [Google Scholar]
- 44.Barber DL, Wherry EJ, Masopust D, Zhu B, Allison JP, Sharpe AH, Freeman GJ, Ahmed R. 2006. Restoring function in exhausted CD8 T cells during chronic viral infection. Nature 439:682–687. doi: 10.1038/nature04444. [DOI] [PubMed] [Google Scholar]
- 45.Day CL, Kaufmann DE, Kiepiela P, Brown JA, Moodley ES, Reddy S, Mackey EW, Miller JD, Leslie AJ, DePierres C. 2006. PD-1 expression on HIV-specific T cells is associated with T-cell exhaustion and disease progression. Nature 443:350–354. doi: 10.1038/nature05115. [DOI] [PubMed] [Google Scholar]
- 46.Trautmann L, Janbazian L, Chomont N, Said EA, Gimmig S, Bessette B, Boulassel M, Delwart E, Sepulveda H, Balderas RS. 2006. Upregulation of PD-1 expression on HIV-specific CD8 T cells leads to reversible immune dysfunction. Nat Med 12:1198–1202. doi: 10.1038/nm1482. [DOI] [PubMed] [Google Scholar]
- 47.Velu V, Kannanganat S, Ibegbu C, Chennareddi L, Villinger F, Freeman GJ, Ahmed R, Amara RR. 2007. Elevated expression levels of inhibitory receptor programmed death 1 on simian immunodeficiency virus-specific CD8 T cells during chronic infection but not after vaccination. J Virol 81:5819–5828. doi: 10.1128/JVI.00024-07. [DOI] [PMC free article] [PubMed] [Google Scholar]
- 48.Velu V, Titanji K, Zhu B, Husain S, Pladevega A, Lai L, Vanderford TH, Chennareddi L, Silvestri G, Freeman GJ. 2009. Enhancing SIV-specific immunity in vivo by PD-1 blockade. Nature 458:206–210. doi: 10.1038/nature07662. [DOI] [PMC free article] [PubMed] [Google Scholar]
- 49.Sakaguchi S, Sakaguchi N. 2005. Regulatory T cells in immunologic self-tolerance and autoimmune disease. Int Rev Immunol 24:211–226. doi: 10.1080/08830180590934976. [DOI] [PubMed] [Google Scholar]
- 50.Sakaguchi S, Ono M, Setoguchi R, Yagi H, Hori S, Fehervari Z, Shimizu J, Takahashi T, Nomura T. 2006. Foxp3 CD25 CD4 natural regulatory T cells in dominant self-tolerance and autoimmune disease. Immunol Rev 212:8–27. doi: 10.1111/j.0105-2896.2006.00427.x. [DOI] [PubMed] [Google Scholar]
- 51.Schmidt A, Oberle N, Krammer PH. 2012. Molecular mechanisms of Treg-mediated T cell suppression. Front Immunol 3:51. doi: 10.3389/fimmu.2012.00051. [DOI] [PMC free article] [PubMed] [Google Scholar]
- 52.Sakaguchi S, Wing K, Onishi Y, Prieto-Martin P, Yamaguchi T. 2009. Regulatory T cells: how do they suppress immune responses? Int Immunol 21:1105–1111. doi: 10.1093/intimm/dxp095. [DOI] [PubMed] [Google Scholar]
- 53.Hori S, Nomura T, Sakaguchi S. 2003. Control of regulatory T cell development by the transcription factor Foxp3. Science 299:1057–1061. doi: 10.1126/science.1079490. [DOI] [PubMed] [Google Scholar]
- 54.Fontenot JD, Gavin MA, Rudensky AY. 2003. Foxp3 programs the development and function of CD4 CD25 regulatory T cells. Nat Immunol 4:330–336. doi: 10.1038/ni904. [DOI] [PubMed] [Google Scholar]
- 55.Sakaguchi S. 2005. Naturally arising Foxp3-expressing CD25 CD4 regulatory T cells in immunological tolerance to self and non-self. Nat Immunol 6:345–352. [DOI] [PubMed] [Google Scholar]
- 56.Kim H, Verbinnen B, Tang X, Lu L, Cantor H. 2010. Inhibition of follicular T-helper cells by CD8 regulatory T cells is essential for self tolerance. Nature 467:328–332. doi: 10.1038/nature09370. [DOI] [PMC free article] [PubMed] [Google Scholar]
- 57.Suzuki M, Jagger AL, Konya C, Shimojima Y, Pryshchep S, Goronzy JJ, Weyand CM. 2012. CD8+CD45RA+CCR7+FOXP3+ T cells with immunosuppressive properties: a novel subset of inducible human regulatory T cells. J Immunol 189:2118–2130. doi: 10.4049/jimmunol.1200122. [DOI] [PMC free article] [PubMed] [Google Scholar]
- 58.Nigam P, Velu V, Kannanganat S, Chennareddi L, Kwa S, Siddiqui M, Amara RR. 2010. Expansion of FOXP3+ CD8 T cells with suppressive potential in colorectal mucosa following a pathogenic simian immunodeficiency virus infection correlates with diminished antiviral T cell response and viral control. J Immunol 184:1690–1701. doi: 10.4049/jimmunol.0902955. [DOI] [PubMed] [Google Scholar]
- 59.Park HJ, Park JS, Jeong YH, Son J, Ban YH, Lee BH, Chen L, Chang J, Chung DH, Choi I, Ha SJ. 2015. PD-1 upregulated on regulatory T cells during chronic virus infection enhances the suppression of CD8+ T cell immune response via the interaction with PD-L1 expressed on CD8+ T cells. J Immunol 194:5801–5811. doi: 10.4049/jimmunol.1401936. [DOI] [PubMed] [Google Scholar]
- 60.Scholzen T, Gerdes J. 2000. The Ki-67 protein: from the known and the unknown. J Cell Physiol 182:311–322. doi:. [DOI] [PubMed] [Google Scholar]
- 61.Soares A, Govender L, Hughes J, Mavakla W, de Kock M, Barnard C, Pienaar B, van Rensburg EJ, Jacobs G, Khomba G. 2010. Novel application of Ki67 to quantify antigen-specific in vitro lymphoproliferation. J Immunol Methods 362:43–50. doi: 10.1016/j.jim.2010.08.007. [DOI] [PMC free article] [PubMed] [Google Scholar]
- 62.Wolint P, Betts MR, Koup RA, Oxenius A. 2004. Immediate cytotoxicity but not degranulation distinguishes effector and memory subsets of CD8+ T cells. J Exp Med 199:925–936. doi: 10.1084/jem.20031799. [DOI] [PMC free article] [PubMed] [Google Scholar]
- 63.Sallusto F, Geginat J, Lanzavecchia A. 2004. Central memory and effector memory T cell subsets: function, generation, and maintenance. Annu Rev Immunol 22:745–763. doi: 10.1146/annurev.immunol.22.012703.104702. [DOI] [PubMed] [Google Scholar]
- 64.He R, Hou S, Liu C, Zhang A, Bai Q, Han M, Yang Y, Wei G, Shen T, Yang X, Xu L, Chen X, Hao Y, Wang P, Zhu C, Ou J, Liang H, Ni T, Zhang X, Zhou X, Deng K, Chen Y, Luo Y, Xu J, Qi H, Wu Y, Ye L. 2016. Follicular CXCR5-expressing CD8 T cells curtail chronic viral infection. Nature 537:412–428. doi: 10.1038/nature19317. [DOI] [PubMed] [Google Scholar]
- 65.Leong YA, Chen Y, Ong HS, Wu D, Man K, Deleage C, Minnich M, Meckiff BJ, Wei Y, Hou Z, Zotos D, Fenix KA, Atnerkar A, Preston S, Chipman JG, Beilman GJ, Allison CC, Sun L, Wang P, Xu J, Toe JG, Lu HK, Tao Y, Palendira U, Dent AL, Landay AL, Pellegrini M, Comerford I, McColl SR, Schacker TW, Long HM, Estes JD, Busslinger M, Belz GT, Lewin SR, Kallies A, Yu D. 2016. CXCR5(+) follicular cytotoxic T cells control viral infection in B cell follicles. Nat Immunol 17:1187–1196. doi: 10.1038/ni.3543. [DOI] [PubMed] [Google Scholar]
- 66.Skinner P, Connick E. 2014. Overcoming the immune privilege of B cell follicles to cure HIV-1 infection. J Hum Virol Retrovirol 1:00001. [Google Scholar]
- 67.Pavlakis GN, Bergamaschi C, Li J, Valentin A, Chen S, Ng SS, Beach REK, Bear J, Rosati M, Alicea C, Sowder R, Chertova E, Felber BK. 2013. Heterodimeric IL-15 regulates the differentiation and survival of different populations of memory T cells and the balance of effector and regulatory cells. J Immunother Cancer 1(Suppl 1):P109. doi: 10.1186/2051-1426-1-S1-P109. [DOI] [Google Scholar]
- 68.Salcedo R, Hixon JA, Stauffer JK, Jalah R, Brooks AD, Khan T, Dai RM, Scheetz L, Lincoln E, Back TC, Powell D, Hurwitz AA, Sayers TJ, Kastelein R, Pavlakis GN, Felber BK, Trinchieri G, Wigginton JM. 2009. Immunologic and therapeutic synergy of IL-27 and IL-2: enhancement of T cell sensitization, tumor-specific CTL reactivity and complete regression of disseminated neuroblastoma metastases in the liver and bone marrow. J Immunol 182:4328–4338. doi: 10.4049/jimmunol.0800471. [DOI] [PMC free article] [PubMed] [Google Scholar]