

Erratum to: Algorithms Mol Biol (2016) 11:20 DOI 10.1186/s13015-016-0083-7
After publication of the original article [1], the authors noticed errors in Algorithm 2 and the caption of Table 4. In Algorithm 2, the term “rank1(Bl, i − 1) + 1” should be included on line 28 and not line 29. In addition, in the caption of Table 4, the word “BVr” should be replaced by “Br” and the word “BVl” should be replaced by “Bl”. The correct versions of Algorithm 2 and Table 4 are included in this erratum.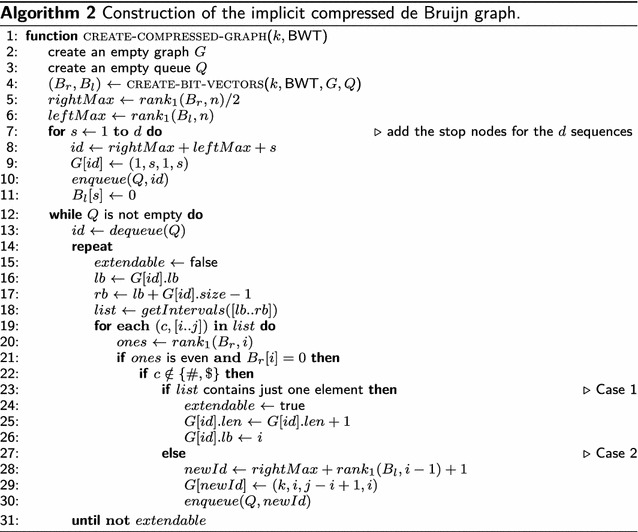
Table 4.
Breakdown of the space usage of the variants of Algorithm A4
| Algorithm | Part | 62 E.coli | 7 × Chr1 | 7 × HG |
|---|---|---|---|---|
| A4 | wt-bwt | 0.42 (23.83%) | 0.44 (36.23%) | 0.43 (22.68%) |
| A4 | Nodes | 0.10 (5.94%) | 0.03 (2.61%) | 0.04 (2.02%) |
| A4 | 0.16 (8.93%) | 0.16 (12.86%) | 0.16 (8.25%) | |
| A4 | 0.14 (8.04%) | 0.14 (11.57%) | 0.14 (7.42%) | |
| A4 | wt-doc | 0.93 (53.26%) | 0.45 (36.73%) | 1.13 (59.63%) |
| A4compr1 | wt-bwt | 0.42 (28.57%) | 0.44 (47.83%) | 0.43 (26.85%) |
| A4compr1 | Nodes | 0.10 (7.12%) | 0.03 (3.44%) | 0.04 (2.39%) |
| A4compr1 | 0.00 (0.23%) | 0.00 (0.12%) | 0.00 (0.09%) | |
| A4compr1 | 0.00 (0.23%) | 0.00 (0.12%) | 0.00 (0.08%) | |
| A4compr1 | wt-doc | 0.93 (63.85%) | 0.45 (48.49%) | 1.13 (70.59%) |
| A4compr2 | wt-bwt | 0.16 (13.03%) | 0.22 (31.01%) | 0.22 (15.62%) |
| A4compr2 | Nodes | 0.10 (8.67%) | 0.03 (4.55%) | 0.04 (2.76%) |
| A4compr2 | 0.00 (0.28%) | 0.00 (0.16%) | 0.00 (0.10%) | |
| A4compr2 | 0.00 (0.28%) | 0.00 (0.16%) | 0.00 (0.10%) | |
| A4compr2 | wt-doc | 0.93 (77.74%) | 0.45 (64.11%) | 1.13 (81.42%) |
The first column shows the algorithm used in the experiment (the k-mer size is 50). The second column specifies the different data structures used: wt-bwt stands for the wavelet tree of the (including rank and select support), nodes stands for the array of nodes (the implicit graph representation), and are the bit vectors described in “Computation of right-maximal k-mers and node identifiers” section (including rank support), and wt-doc stands for the wavelet tree of the document array. The remaining columns show the memory usage in bytes per base pair and, in parentheses, their percentage
Footnotes
The online version of the original article can be found under doi:10.1186/s13015-016-0083-7.
Reference
- 1.Beller T, Ohlebusch E. A representation of a compressed de Bruijn graph for pan-genome analysis that enables search. Algorithms Mol Biol. 2016;11:20. doi: 10.1186/s13015-016-0083-7. [DOI] [PMC free article] [PubMed] [Google Scholar]